Debug Production at the Speed of AI

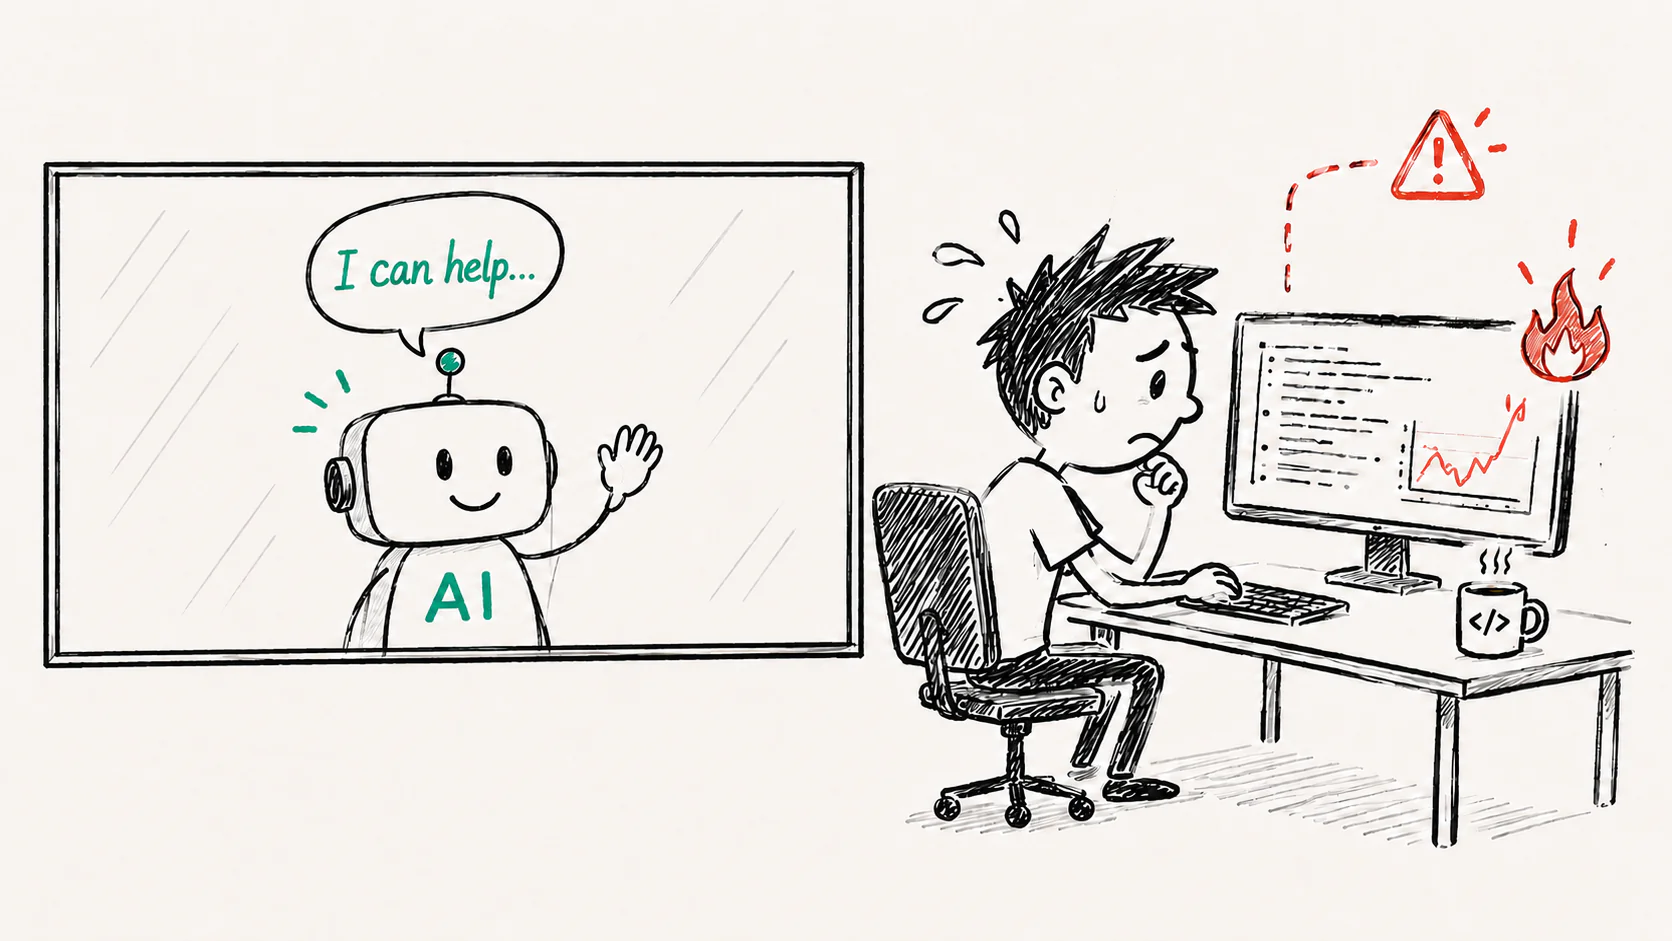
Your coding agent can debug production issues now.
Yes…
Not just “help you debug.”
Actually run the investigation… FOR YOU!
In this new era of agentic development, speed matters.
And in the old days (you know… last week or so) we used to investigate production bugs ourselves.
Manually.
Like humans.
But for a lot of incidents, we don’t need to do all of that anymore.
Now you can just ask Claude (or any other coding agent) to investigate directly in Coralogix: logs, metrics, distributed traces, RUM and infrastructure data.
It follows the evidence and comes back with a likely root cause… fast.
The Future Is Here… Like, Now
Here’s how you do it…
1. Install
just tell your agent :
And that’s basically it.
Your agent handles the installation and guides you through the sign-in.
2. Test drive it quickly
…and see what it says.
it will show you a summary of the most urgent things that require your attention in Coralogix.
3. When something actually breaks
You don’t dig — you ask:
And off it goes.
It then comes back with a full analysis.
If the issue is in your repository, it shows you the code that likely needs to change.
And with the right repository access, it can even draft the fix and open a PR for you to review.
Coralogix provides the coding agent the missing production context it needs.
Put them together, and the debugging loop is finally connected.
That’s the short version.
But if you’re curious about what the agent is actually doing, let’s go…
Behind The Scenes
To see why this matters, let’s replay how we used to handle that same production alert.
Slack interrupts.
Cool.
Cool cool cool.
You stop what you’re doing.
Open Coralogix, and start browsing around.
First you check RUM (Real User Monitoring).
It shows that the failures are coming from the checkout page – and that POST/api/checkout is returning 500.
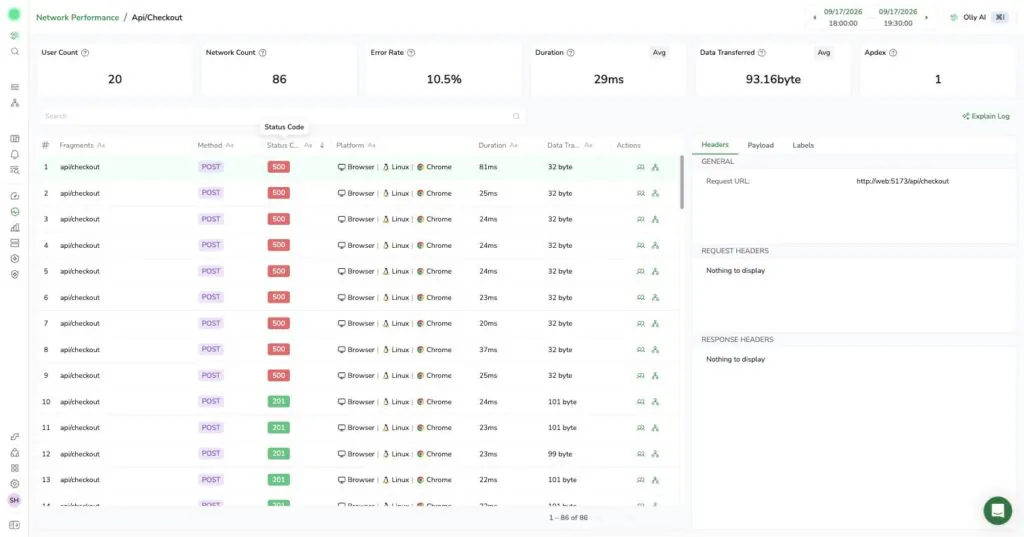
But what exactly is causing that?
You move to traces.
You follow the breadcrumbs, Hansel and Gretel style, to see where the error originated.
Oops…. checkout-service is lit up red.
You filter for failed spans in the last 30 minutes.
A handful come back..
Every one of them shows the same shape: checkout-service is red, but the call it makes to promotions-service comes back a clean green 200.
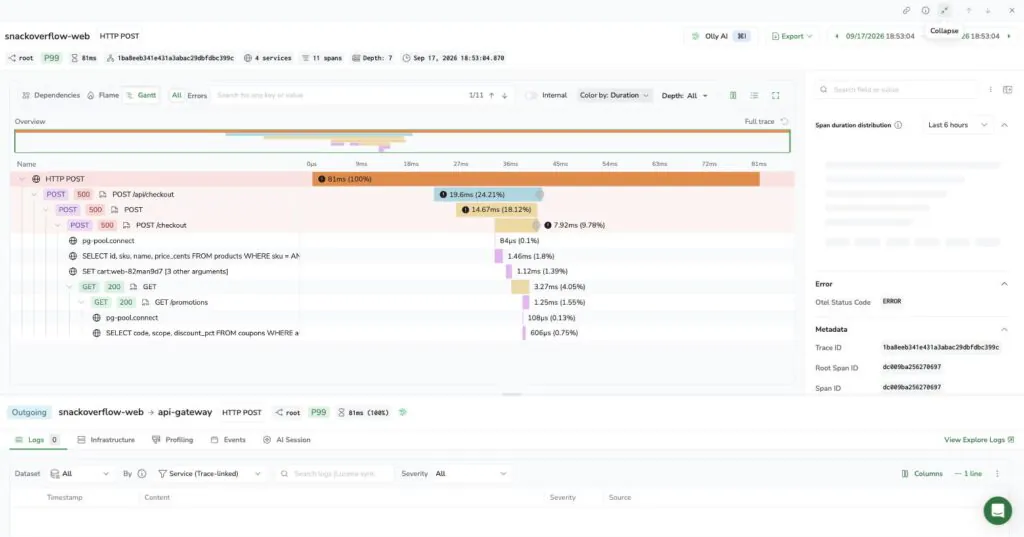
One more stop before logs: APM.
Service Catalog → checkout-service. Health: Critical. Error rate and P95 latency both spiking, right in step with the alert.
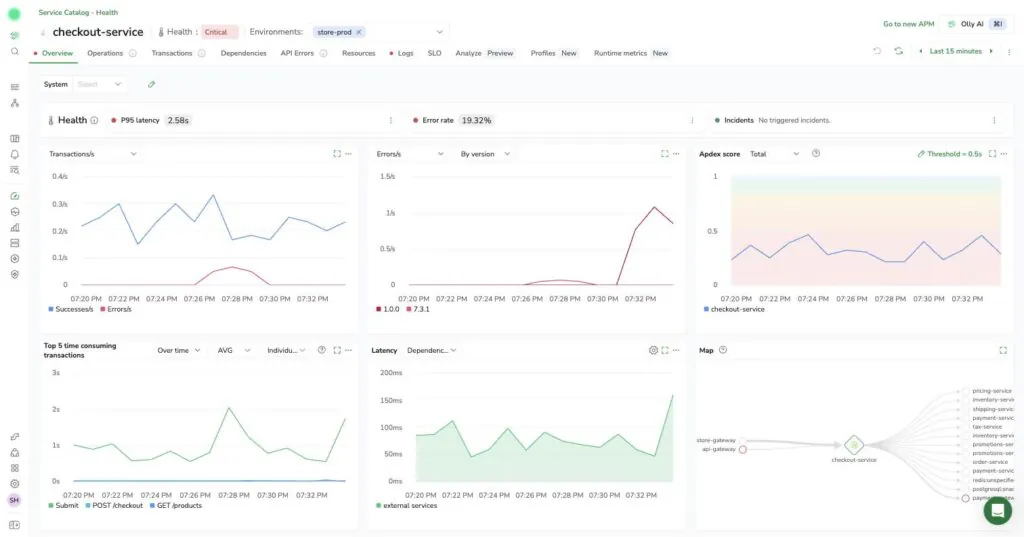
Right there on the service page: a Logs tab. One click from APM straight into this service’s logs.
Now you need logs to confirm it.
Switch tab.
New query.
Too noisy.
You narrow it to the trace ID from the span you just found.
There it is.
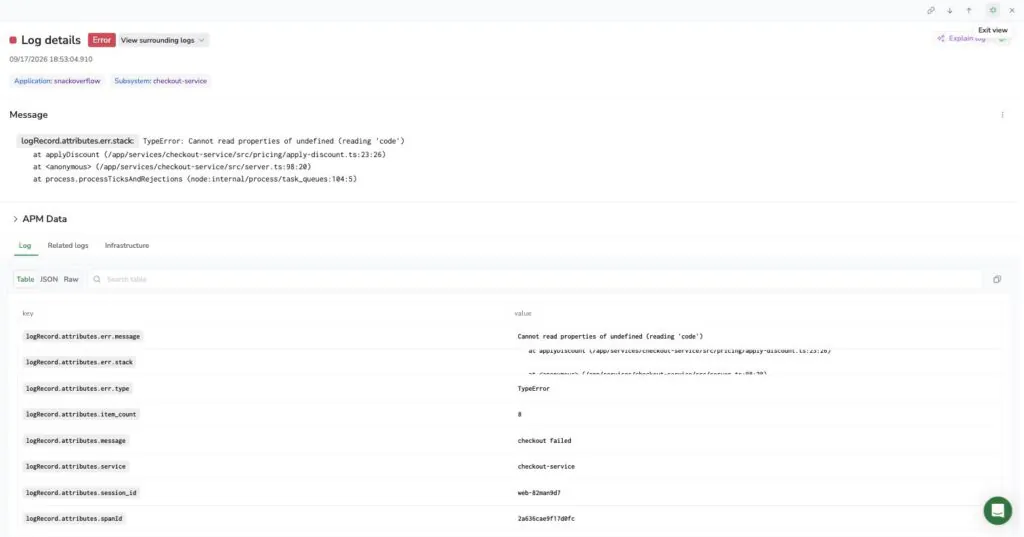
Good. But is this new, or has this been happening quietly for a while?
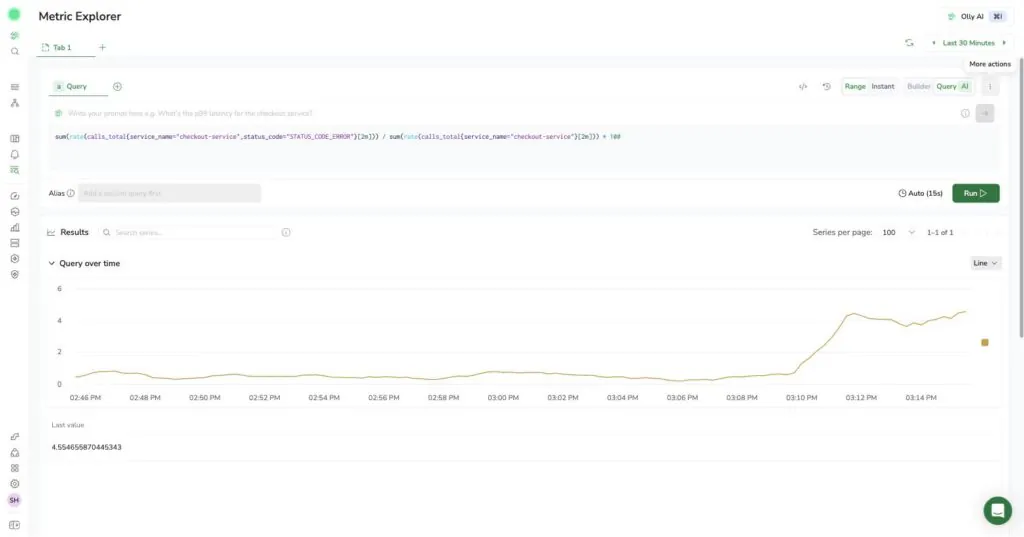
Switch to metrics.
Chart the error rate over the last 6 hours.
There’s a clear step change.
And it begins the moment a promo coupon quietly expired.
One more tab.
Infra, just to rule out a noisy-neighbor node problem.
Nope. It’s clean.
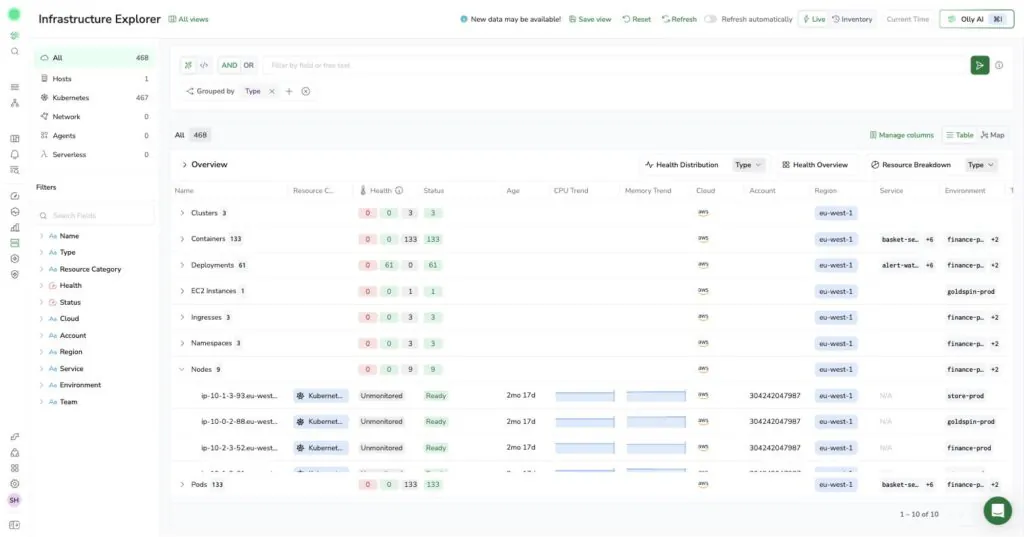
So: a downstream call that actually succeeded, clean infrastructure, and a spike that begins exactly when a coupon expires.
Maybe it is your code after all.
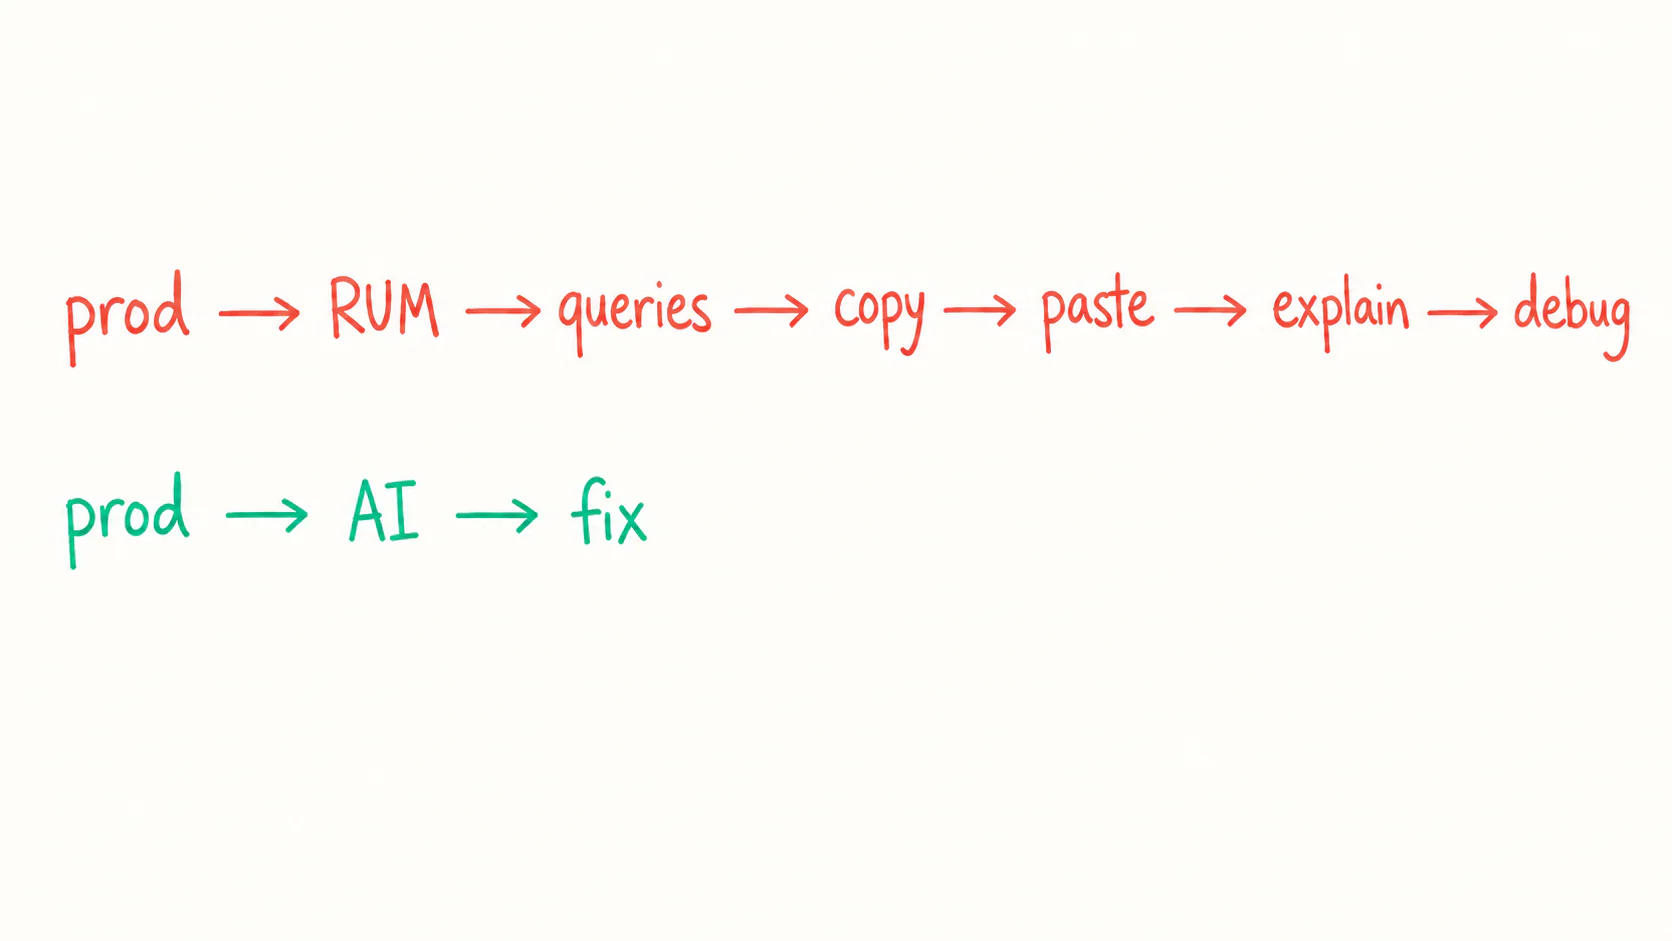
Six views.
Six separate mental models to hold at once.
Now copy the trace ID.
Copy the log line.
Copy the chart, or at least describe it well enough to be believed.
Switch back to the coding agent.
Paste.
Explain again the entire context
Basically, everything you just spent 15, 30-sometimes 60-minutes finding…
Then, finally, Claude helps you inspect the code.
And there it is: apply-discount.ts assumed promotions would always return a matching campaign — once SUMMER24 expired, that assumption broke for every basket over $50.
Congratulations!
You did almost the entire investigation yourself… like it’s 2025 all over again 🙂
This Is What The Agent Does Now
Now replay the same incident with the Coralogix CLI connected.
You paste the alert:
The agent checks RUM, follows the trace, narrows the logs using the trace ID, checks whether the spike lines up with a deploy, a config change, or a campaign expiring, and rules out infrastructure.
Then it comes back with:
Much easier right?
And if it really had been payment-gateway?
Same investigation, different ending: a ready-to-send Slack message with the trace ID, impact, and evidence for the Payments team.
And because the CLI can query archived telemetry, the agent can also check whether today’s “new” failure has happened before.
Hard To Go Back
The funny thing is, after you do this a couple of times, it’s hard to go back to the old workflow.
Not because the Coralogix UI is unnecessary. Sometimes you do want to explore the data yourself.
But now that the agent can look for itself, why spend all that time collecting evidence before it can start helping?
Humans aren’t leaving production debugging.
We’re just finally getting a better role in it.
Less searching, copying, and re-explaining.
More reviewing the proposed fix, making the call, and moving on.
That makes us waaaaay more efficient.
And when an entire engineering team works that way?
Things get fixed faster, customers are happier and the company does better.
Now It’s Your Turn
You don’t need to wait for production to catch fire.
Start small.
Tell your coding agent:
Once it’s connected, ask one simple question:
Watch what it queries. Check the answer. Ask a follow-up.
That’s it.
Get used to the idea that your agent can look at production for itself.
Then, when the next 503 arrives, you won’t start with five different views.
You’ll instead start… with a prompt.