Comparing Coralogix with open source observability backends
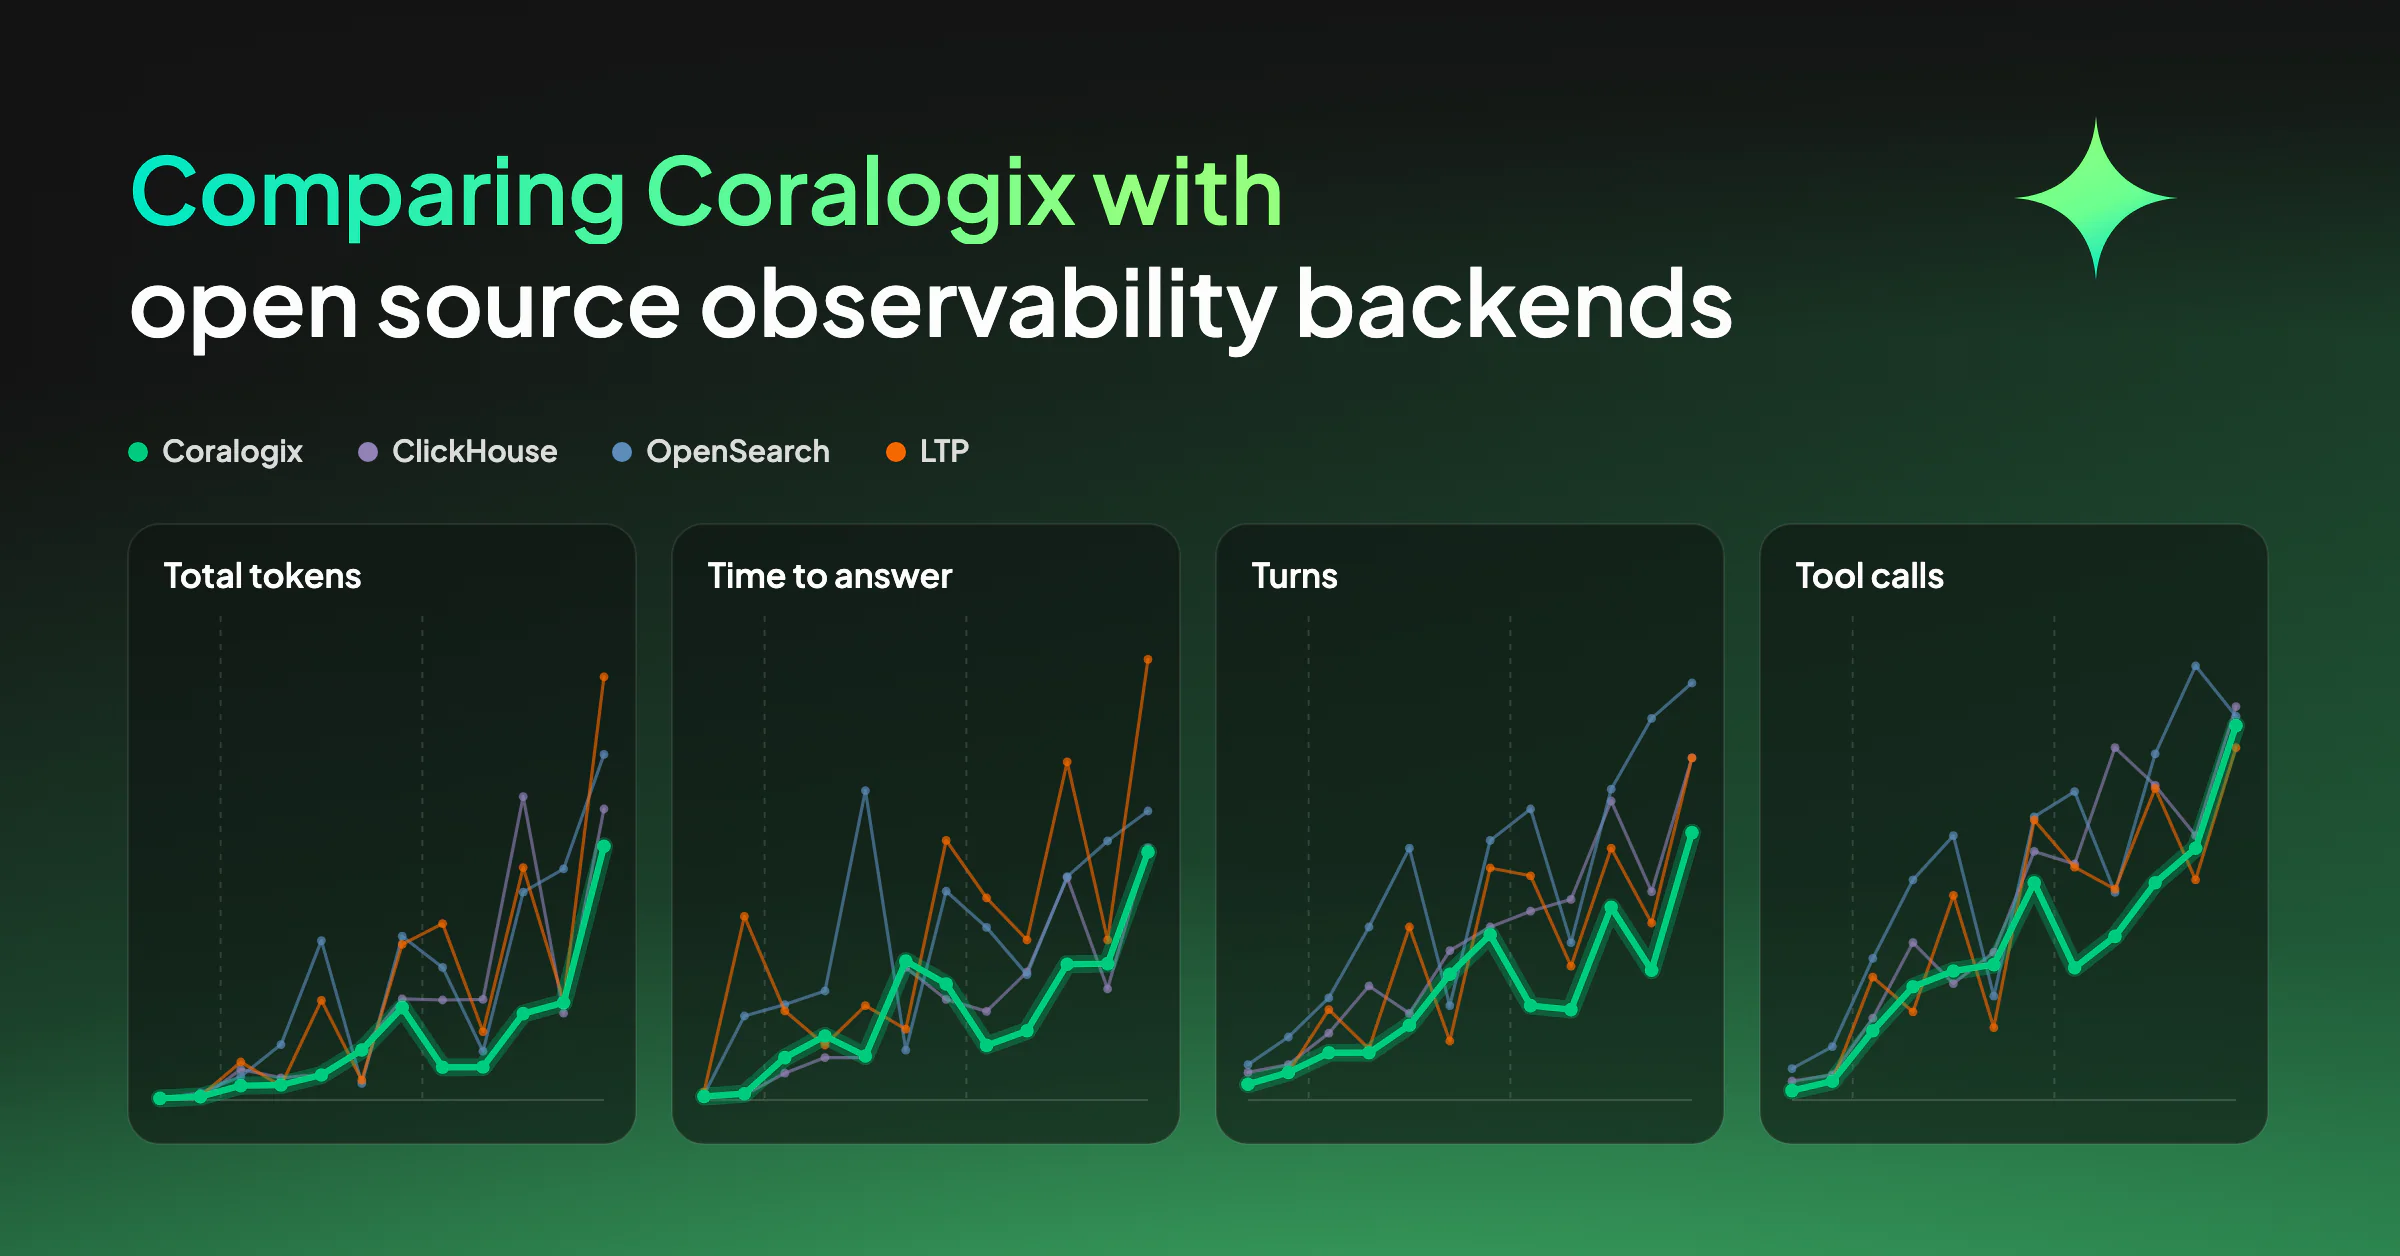

We put the same OpenTelemetry data into four backends, Coralogix, ClickHouse, OpenSearch and a Loki, Tempo and Prometheus stack, then set an agent twelve questions against each one, from counting spans to working out what is wrong in a system it has never seen. Then we forced the agents to continue investigating until they got to the right answer. In this experiment, what separated them was the time, tokens, tool calls and turns it took to get there. The full benchmark, every question, every run and every caveat, is at benchmarks.coralogix.com/agent-benchmark-homegrown.
Why are we benchmarking open source backends?
Agents are becoming the thing that reads telemetry, and an agent pays for every byte it looks at. A human skimming a dashboard pays nothing extra for a wide query, so the cost of an awkward data layer stayed invisible for years. An agent turns that cost into tokens, so we wanted to figure out, if we ensure correctness across all models, what other patterns emerge? So we measured it across some popular stacks: ClickHouse, OpenSearch with Prometheus, and Loki with Tempo and Prometheus.
Why we used the same telemetry in all four
Every backend got the identical logs, spans and metrics from the OpenTelemetry Astronomy Shop Demo, and every backend ran out of the box. ClickHouse and OpenSearch each ran on the minimum infrastructure their own documentation recommends, the Loki stack on the same instance type, all three on their default storage. Nothing was tuned, indexed or configured on any of them, including Coralogix.
Every run used one model, GLM 5.3. The agent started fresh each time, with its own PATH, HOME and an empty working directory, so nothing carried between runs and cache read was zero across the whole campaign. Each agent got the question and an instruction to give the shortest complete answer, with no hints and no examples, and reached its backend only through that backend’s command line tools. A reviewer checked every answer and sent the agent back until it was right. Every figure here includes the attempts that took.
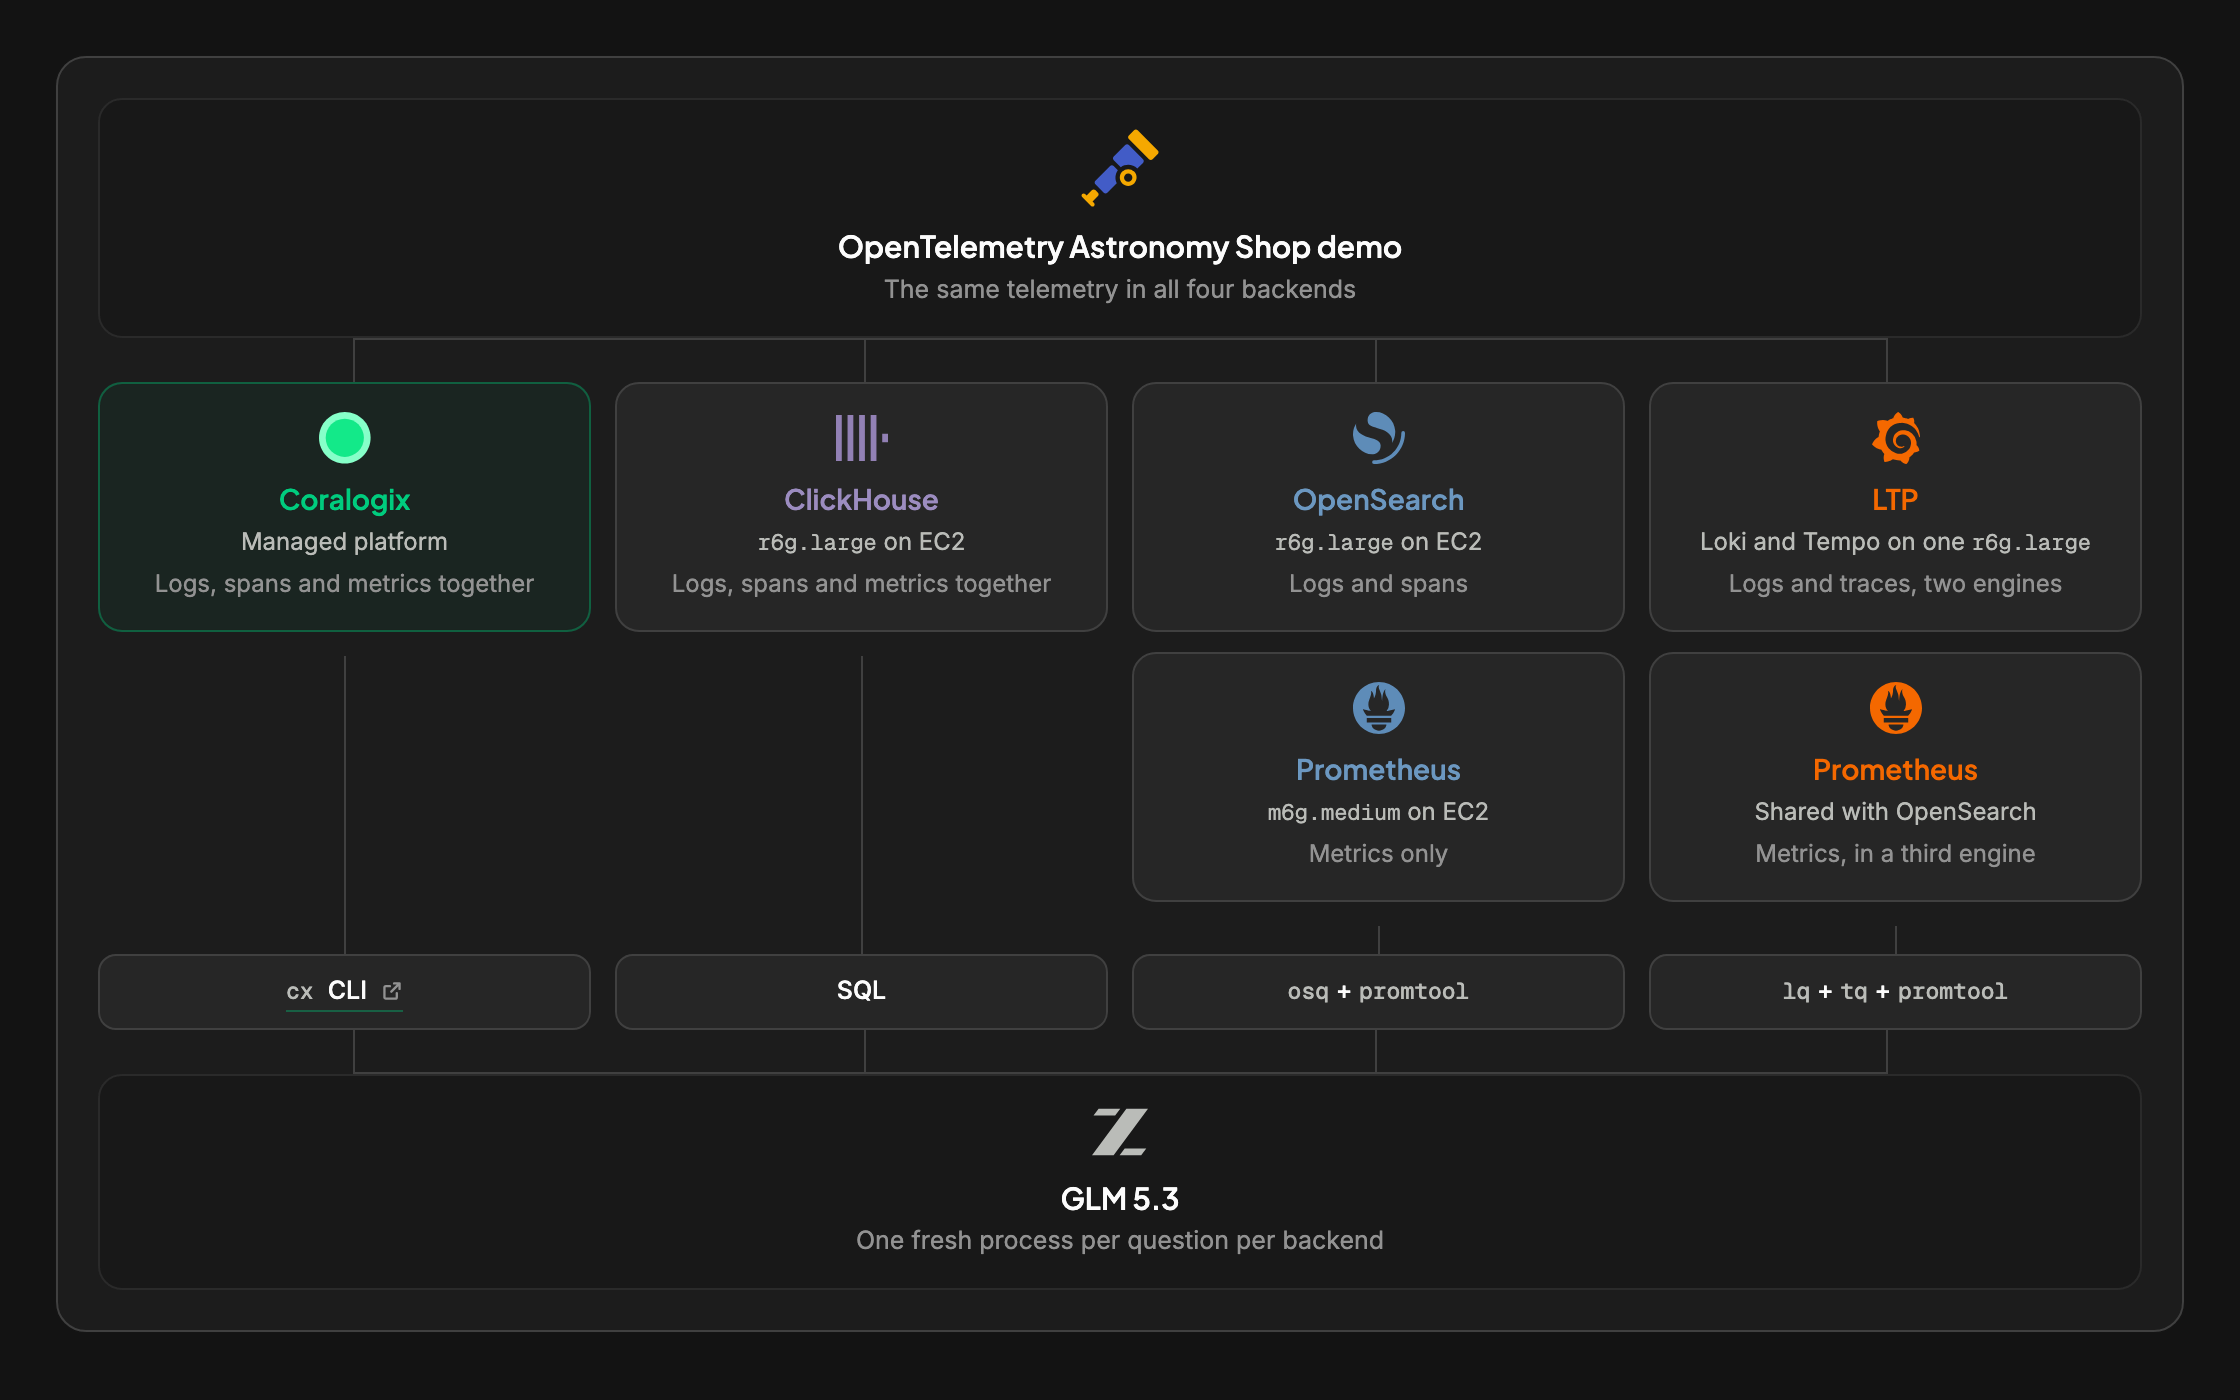
Coralogix and ClickHouse hold logs, spans and metrics together, so their agents need one tool. The Loki stack splits the three signals across three engines, so its agent queries three. OpenSearch 2.19 has no supported OpenTelemetry Protocol metrics path, so we sent its metrics to Prometheus too, which gives it two. In our tests, this was significant, but in our view fair; in the end, if an engineer wishes to access the same data with each of these stacks, they need multiple tools.
Schema-on-write is quick until the request is ambiguous
Precise requests are cheap everywhere. The two counting questions averaged 51,367 total tokens across all four backends, and the ten ambiguous ones averaged 2,396,719, over 46 times as much.
A precise request is a single query. Asked how many spans the cart service emitted in a one hour window, the agent is handed the service, the computation and the window, so a schema decided before the data arrived is exactly the right thing to run it against. That is what an index is for.
An ambiguous request inverts the work. The agent does not know which services matter, which fields exist or which signal will carry the evidence, so before it can query the data it has to find out what the data is. On a schema-on-write stack that discovery runs through a structure that only knows what it was told to expect at ingest time. Anything the schema did not anticipate has to be reached the long way, through wider scans and more of them. For example, OpenSearch took 53.8 turns and 73.6 tool calls per question against Coralogix’s 27.1 and 48.5, which is an agent going back to look again.
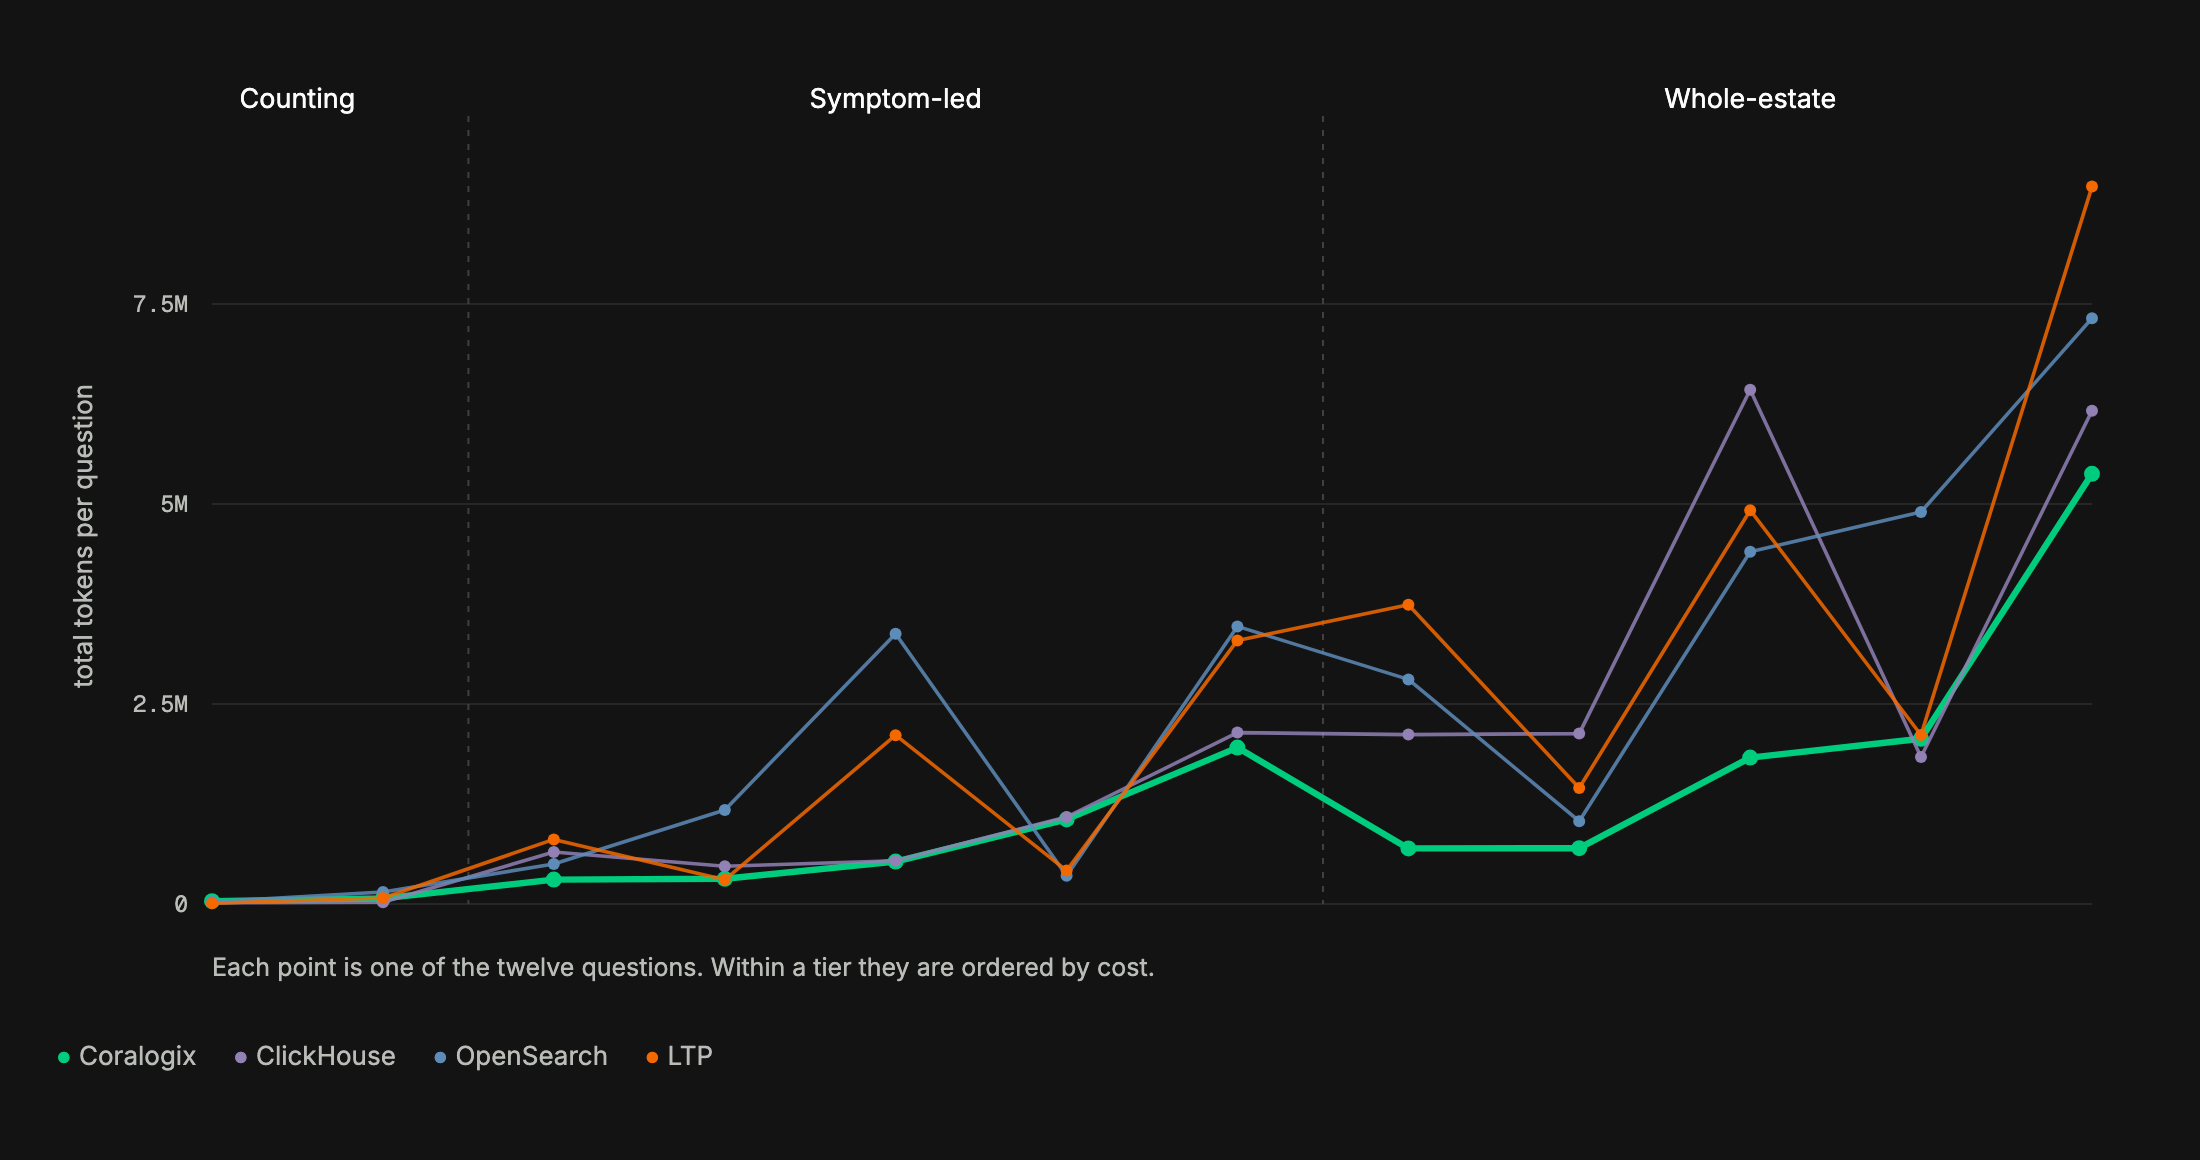
For simple questions, open source performs well. ClickHouse answered the counting questions in 20,058 tokens on average against Coralogix’s 53,139.
The platforms split as the questions become more ambiguous, without containing all the information for an effective query. ClickHouse rises 118-fold from counting to ambiguous, more than any of the four. Across the ten ambiguous requests Coralogix averaged 1,483,176 tokens, ClickHouse 2,357,362, the Loki stack 2,812,368 and OpenSearch 2,933,969.
| Backend | Avg total tokens | Avg time | Avg turns | Avg tool calls | Wins |
| Coralogix | 1,244,837 | 168s | 27.1 | 48.5 | 7/12 |
| ClickHouse | 1,967,811 | 184s | 40.1 | 62.4 | 2/12 |
| Loki + Tempo + Prometheus | 2,350,753 | 328s | 37.7 | 56.2 | 2/12 |
| OpenSearch | 2,459,906 | 307s | 53.8 | 73.6 | 1/12 |
The most ambiguous questions were where the agent was given no target and no symptom. Asked to find the single biggest problem in a system it had never seen, the Coralogix agent spent 693,917 tokens against 2,117,864 for ClickHouse, 2,808,136 for OpenSearch and 3,738,753 for the Loki stack.
The Loki stack is the slowest at 328 seconds a question, despite using fewer turns and tool calls than OpenSearch. Three engines means three round trips before an agent can correlate anything. Splitting the signals is a schema decision too, taken at the point the stack was chosen. This split means more expensive exploration, and much more challenging correlation that the model must perform, instead of delegating to a reliable data layer.
Setup effort
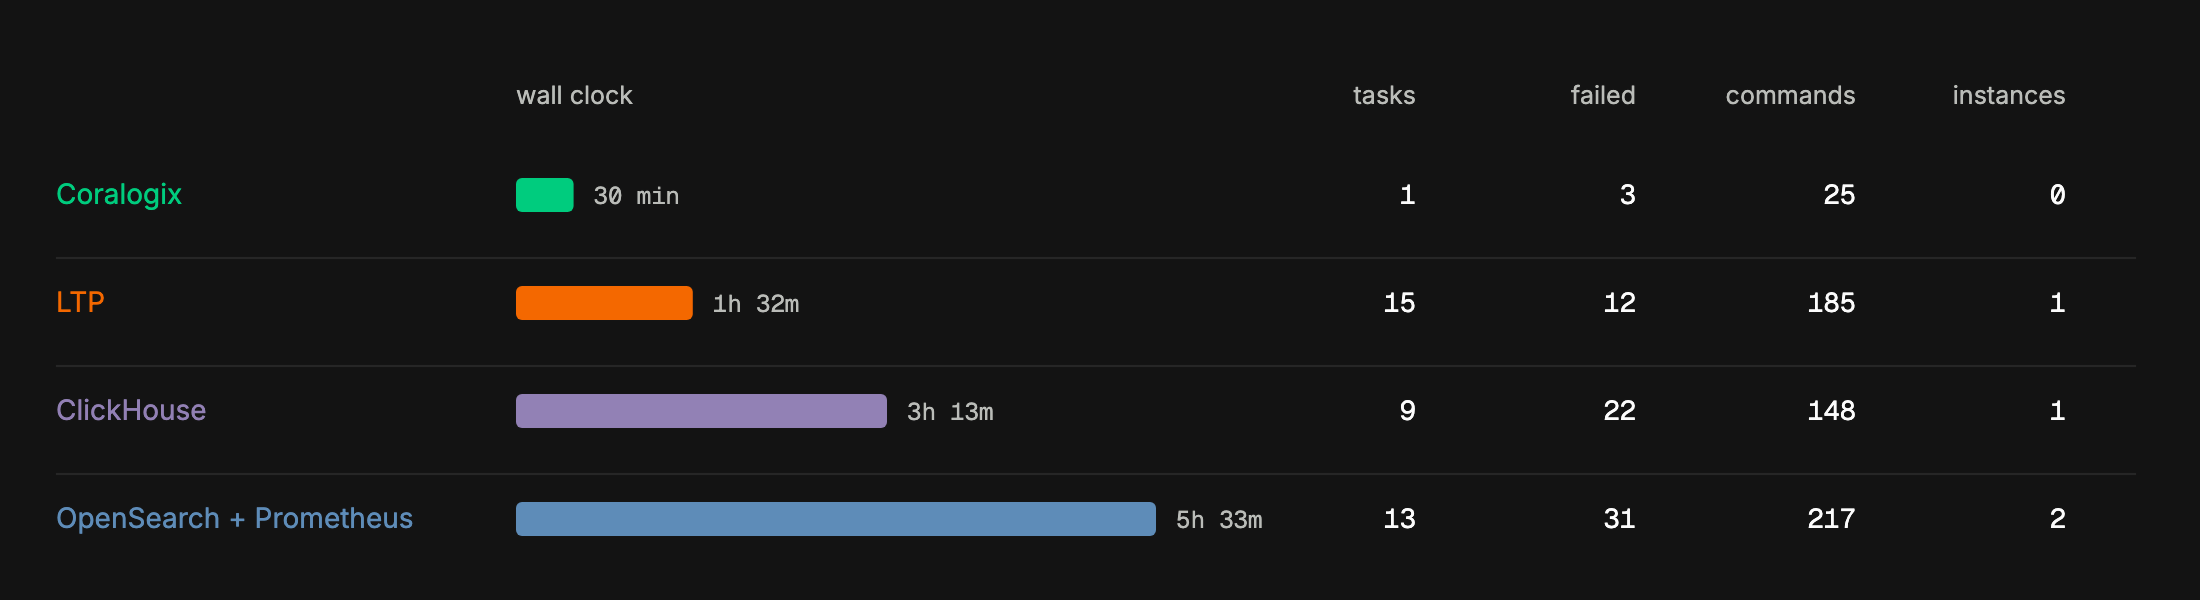
We also set an agent the job of building each backend from nothing, and logged every task, command and failure as it went.
What does this mean for open source observability?
Every one of these backends were forced to answer every question correctly. When forced to chase a problem to completion, the systems that enabled high performance exploration, across all data, via a single tool, scaled better, and only Coralogix scaled linearly, and with the lowest token count, tool calls & turns out of the set.
What’s next?
Some dimensions we intend to explore next:
- Whether tuning each self-managed stack, rather than running it out of the box, closes the gap on the ambiguous requests or just moves the cost into setup
- How the picture changes with a larger estate, where compression ratios and instance counts start to dominate
- Whether a second model agrees with GLM 5.3 about which backend is cheap, or whether these rankings are partly a property of the model
If agents are going to do the investigating, the question to ask of a data layer is no longer how fast it answers what you already know, but what it costs when you do not know yet.
A quick note on the work of open source solutions
Open source software is the lifeblood of innovation. We’re making these comparisons to show how different architectures tackle different problems. We have contributed extensively to open source software over our history, and we will continue to do so enthusiastically. Thanks to the ClickHouse, OpenSearch, Grafana and Prometheus communities, whose work made a fair comparison possible at all.