

Introducing MCP server observability in Coralogix
OpenTelemetry now has semantic conventions for MCP. The new MCP Servers page in Coralogix AI Center turns them into calls, clients, tools, errors and latency you can query, alert on and follow through one trace.
Ofri Grushka7 min read
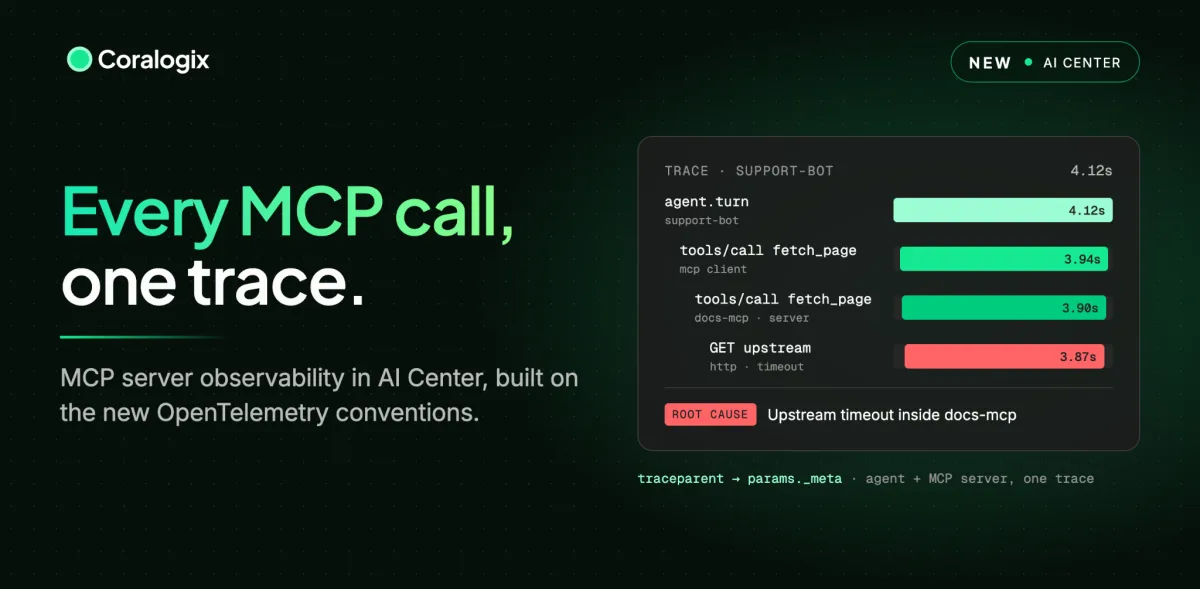
OpenTelemetry now has semantic conventions for MCP, and Coralogix is one of the first observability platforms to turn them into a working product: a dedicated MCP Servers experience in AI Center that lets you see, query, alert on and correlate every MCP call your agents make.
What the MCP conventions define
MCP servers can already emit telemetry, but without a shared standard every server, SDK and vendor names things differently. Lock-in follows: proprietary attributes, custom agents and dashboards that only work in one tool.
Open, portable standards put a layer of abstraction between customer and vendor, so your instrumentation outlives any single backend. OpenTelemetry is something we take seriously at Coralogix, with major contributions to OBI, the OpenTelemetry Kubernetes Helm charts and more.
MCP runs on JSON-RPC, and neither generic RPC nor HTTP conventions describe it well. A single streamable HTTP request can carry several MCP messages, and one MCP request can span several HTTP retries. The OpenTelemetry MCP conventions treat MCP as its own domain, with three pieces that matter most.
The first is a pair of spans. Every MCP operation produces a client span and a server span, named for the method and its target, such as tools/call search_issues. Each records the method (mcp.method.name), the tool or prompt involved, the session, the protocol version and the transport. Tool calls also set gen_ai.operation.name to execute_tool, so an MCP tool call looks the same as any other tool an agent runs.
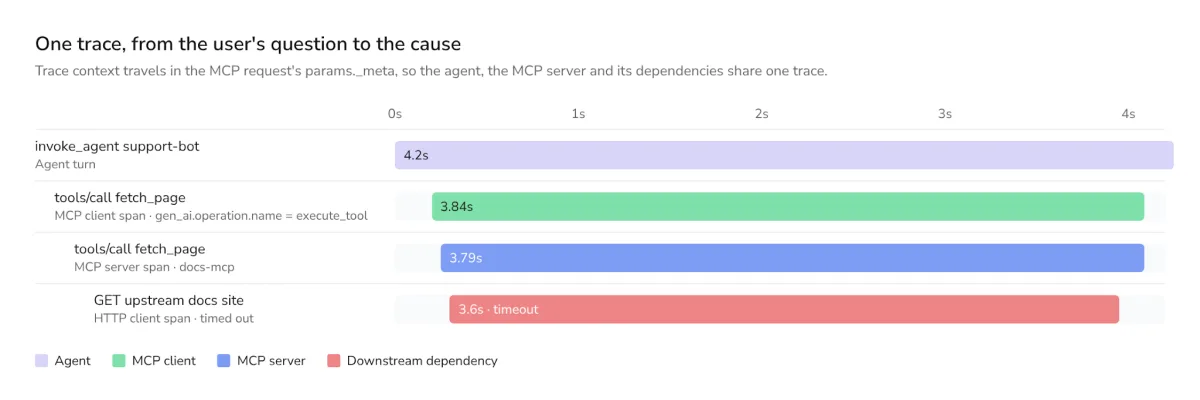
The second is context propagation. MCP has no built-in way to pass trace context, so the conventions put traceparent inside the request's params._meta. The server picks it up and parents its span on the client's. When both sides are instrumented, the agent's trace and the MCP server's trace become one trace.
{
  "jsonrpc": "2.0",
  "id": 7,
  "method": "tools/call",
  "params": {
    "name": "fetch_page",
    "arguments": { "url": "https://docs.example.com/refunds" },
    "_meta": {
      "traceparent": "00-4bf92f3577b34da6a3ce929d0e0e4736-00f067aa0ba902b7-01"
    }
  }
}
The third is a set of metrics: operation and session duration, on both the client and the server side. They are recorded with a consistent error model, so a JSON-RPC failure and a tool that returns isError are classified the same way everywhere.
The result is that MCP traffic from any compliant client or server, in any language, arrives in a shape a backend can understand without custom parsing, and Coralogix now reads it.
Meet the MCP Servers page
The new MCP Servers page lives in AI Center, and it answers the question every team running agents eventually asks: what are my agents actually doing with their tools, and is it working?
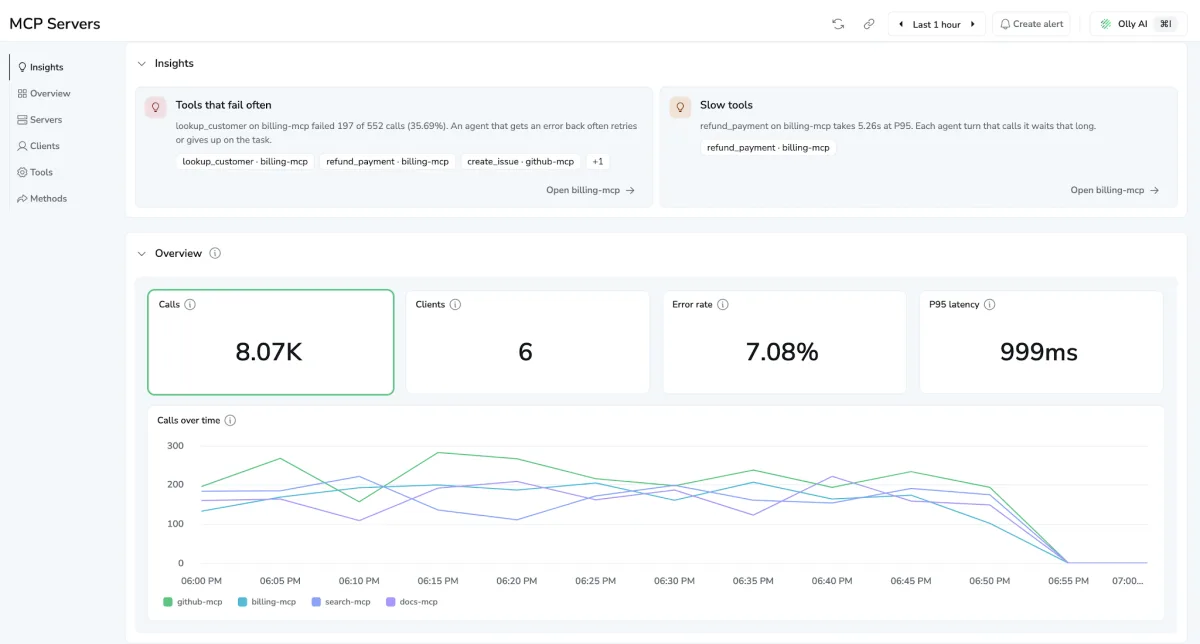
It opens on four numbers: calls, clients, error rate and P95 latency. Select any of them and the chart beneath re-cuts that measure over time, by server. From there, the page breaks your MCP estate down along the four dimensions the conventions make possible.
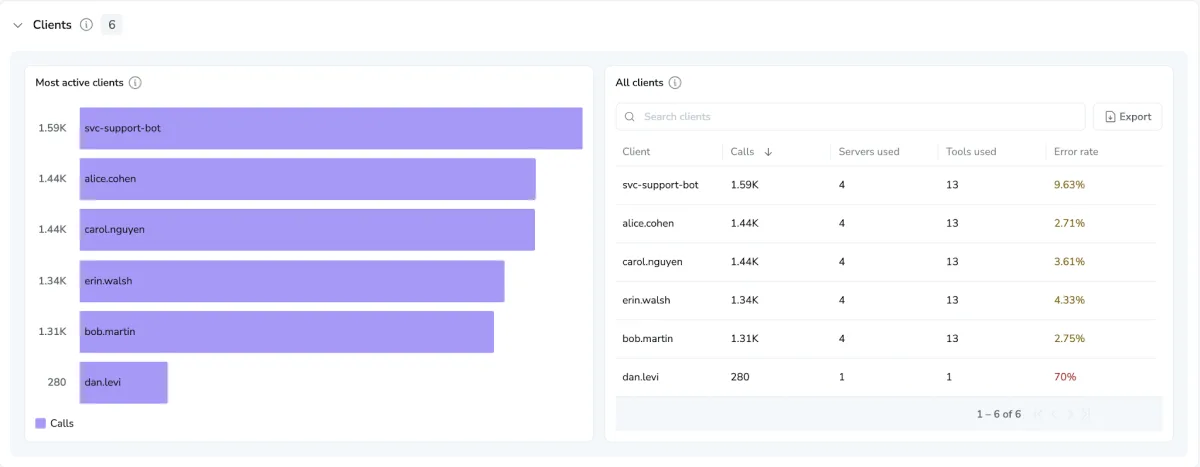
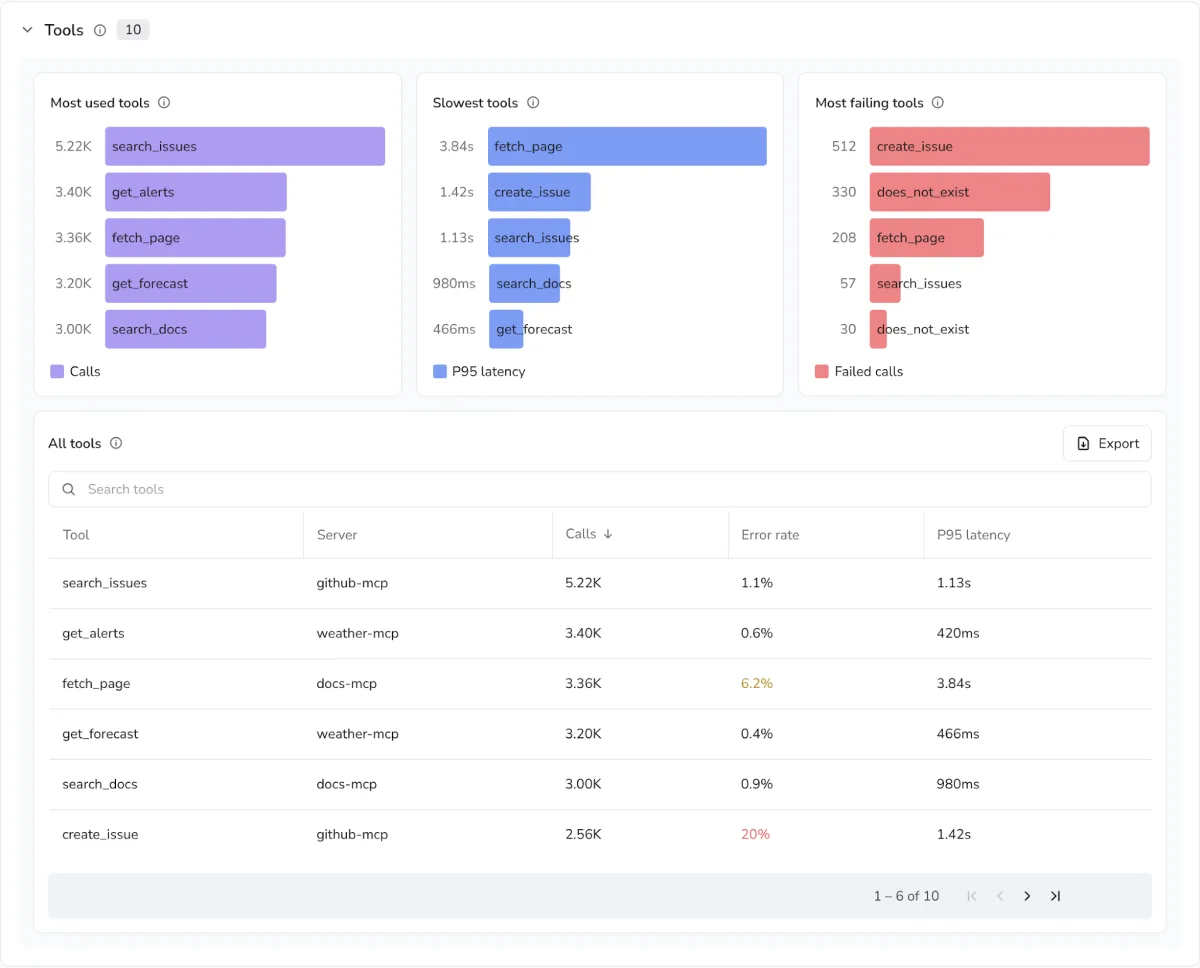
- Servers ranks the busiest, slowest and most failing servers, with calls, tool calls, tool count, error rate and latency for each.
- Clients shows who is calling your servers: the users and service accounts behind each call, identified by
enduser.id, and how heavily each one uses which server. Client applications such as Claude Code or Cursor appear in a server's drilldown when that server recordsmcp.client.name. - Tools lists the individual tools behind every server, ranked by use, failures and latency. This is usually where the real problem sits.
- Methods shows how traffic splits between
tools/call,tools/list, discovery and the rest of the protocol.
Above all of it sit Insights, which surface the patterns worth acting on before you go looking. A tool that fails one call in five is called out by name, with the reason it matters: an agent that gets an error back often retries or abandons the task. Slow tools are flagged too: at a multi-second P95, every agent turn that calls one waits that long.
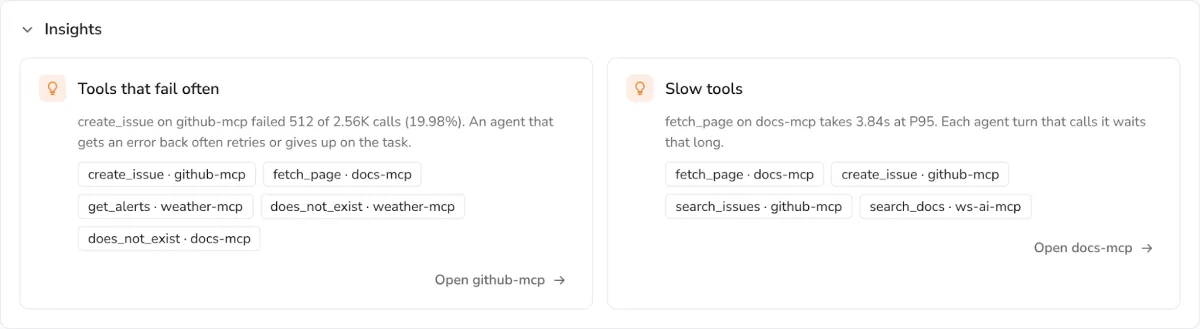
Errors are ranked by failed calls rather than raw rate, so a tool failing 20% of thousands of calls outranks one that failed every one of 30. That is the order an engineer would triage in.
Interrogate it headlessly
Nearly half of all Coralogix sessions are now headless, and many of those are engineers working through an agent rather than agents working alone. MCP telemetry is built for both: the same data is available in the UI and through Olly, the Coralogix MCP server, the CLI or the API, so every user, at the keyboard or through an agent, can work with it straight away.
An agent connected to Coralogix over MCP can now ask which of your MCP servers is degrading, which tool is behind it, and which callers are affected, then pull the traces to see why. Ask Olly why your support bot got slower this week, and it can work from the same spans the page is built on, rather than piecing it together from proprietary, per-server formats.
Because every compliant span names its method, tool, session and protocol version the same way, an agent does not have to learn the shape of each server's telemetry before it can reason about it. With one format to read, the agent spends its effort on the investigation instead of on decoding the data.
Alert on it, then follow the trace
Visibility you have to remember to check is not monitoring. Alerts can be created from the MCP Servers page, so you can watch the measures that matter for agents, such as error rate, P95 latency or a sudden drop in calls. When a tool starts failing, you hear about it before your agents start routing around it.
The bigger shift is correlation. Because the conventions propagate trace context through the MCP request, an MCP call no longer has to be an island. When the agent that makes the call is instrumented too, the call sits in the same trace as the agent span and the database queries, HTTP calls and downstream services the server touched to answer it. In Coralogix, that trace connects to the logs, metrics and APM data you already send.
Take a support bot whose answers have slowed down. With the agent instrumented as well, its trace shows the agent turn waiting almost four seconds on fetch_page, the docs-mcp server span under that call, and inside it the HTTP request to an upstream site that was timing out. One trace can run from the user's question to the cause.
MCP monitoring is one more signal in the same platform, with no separate product or data store: it is queryable with DataPrime and kept in your own cloud object storage, like everything else you send to Coralogix.
Do I need to change how I integrate?
If your MCP servers already emit OpenTelemetry spans, probably not. Send the spans over the OpenTelemetry Protocol (OTLP) as you do today, and any MCP server spans that follow the conventions populate the MCP Servers page automatically. There is no proprietary agent and no Coralogix-specific SDK.
Instrument a server with one prompt
The MCP Python SDK 2.x and FastMCP emit these spans out of the box. For servers built on anything else, it takes one prompt to your coding agent: it installs the Coralogix instrumentation skill for the Python, TypeScript and Go MCP SDKs, instruments the server, and checks that the data landed in Coralogix. Paste this in from your MCP server's project:
Read https://coralogix.com/docs/ai-center, install the ai-app-instrumentation skill
(npx -y skills add coralogix/cx-skills --skill ai-app-instrumentation -y), then run it to
instrument this MCP server and verify the data in Coralogix AI Center.
The MCP servers docs walk through it step by step.
Either way, your servers end up emitting the standard conventions. Instrument against them once, and the same telemetry works in Coralogix and anywhere else that reads the standard. That is why we built on the convention rather than around it.
Built on the open standard
OpenTelemetry gave the industry a common language for MCP. We think the right response to a new standard is to make it useful immediately, rather than wait for it to settle. The MCP Servers page is available in AI Center today. If you already run agents on Coralogix, open AI Center and look at your MCP traffic. If you are new to Coralogix, start a free trial or talk to an expert.
Keep reading
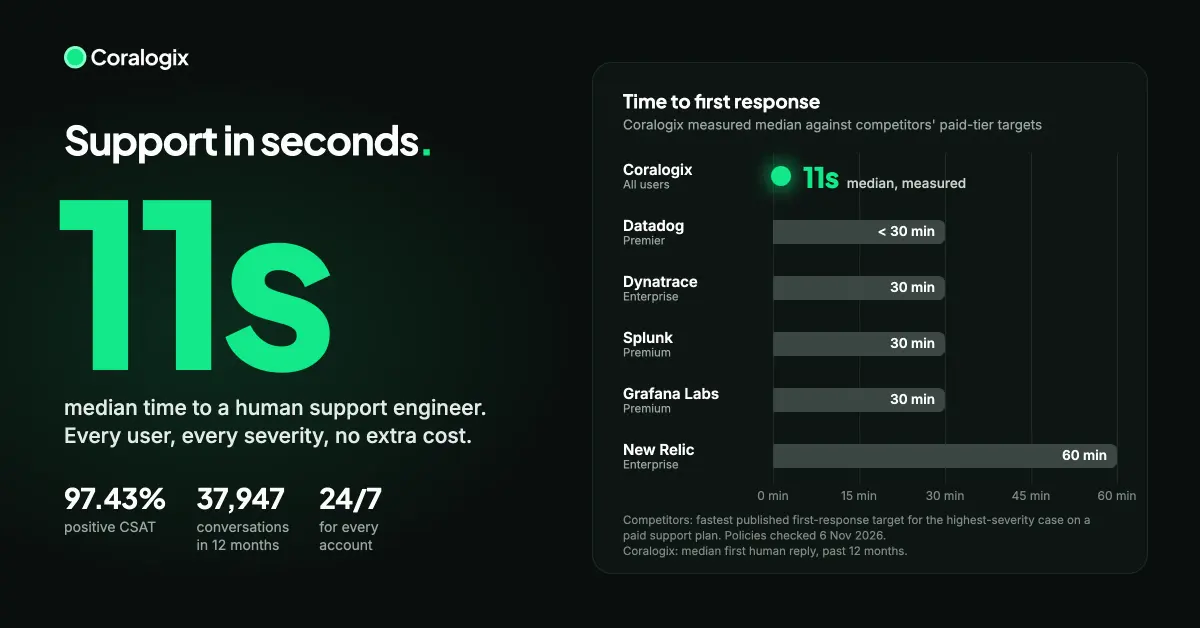 Company newsA Coralogix support engineer replies in 11 secondsCoralogix support reaches a human engineer in a median 11 seconds, with 97.43% positive CSAT across 37,947 conversations. See the live monthly benchmark.
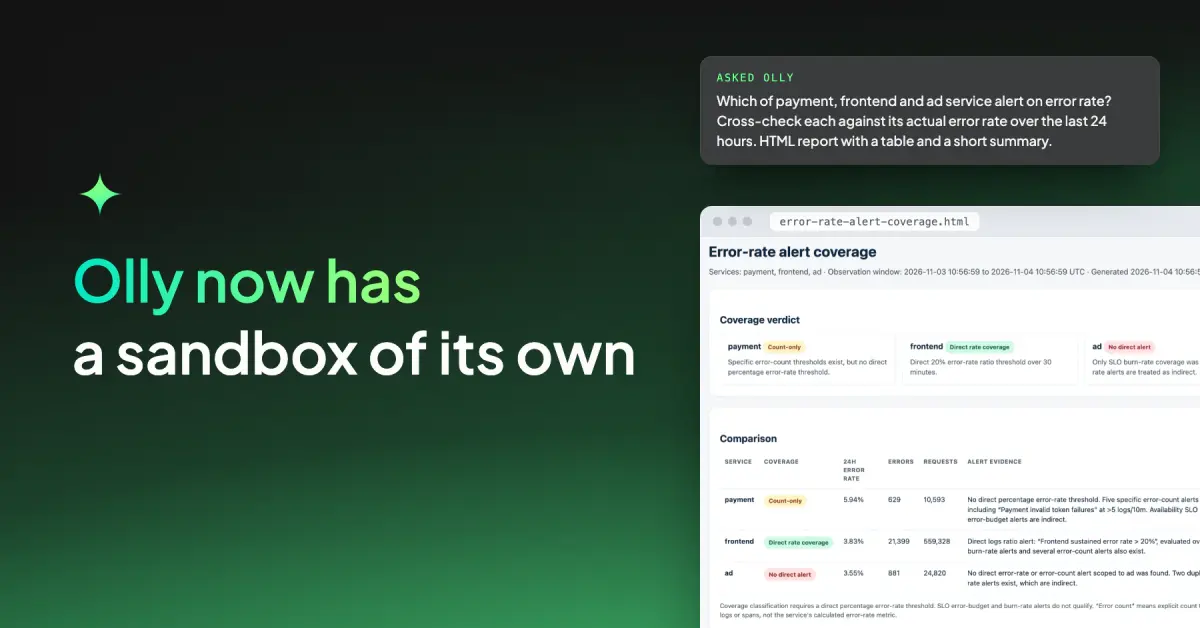 AIWith a sandbox workspace of its own, Olly answers bigger questionsOlly now runs every conversation in its own sandbox with Python, jq and awk, so it can audit alerts, correlate PromQL and DataPrime, and write reports.
 Security advisoryThreat Advisory - Trojanized Claude Code Extension: SSH BackdoorSnowbit advisory on the trojanized Claude Code extension 2.1.313 on Open VSX: how the SSH backdoor works, IOCs, hunting queries and remediation steps.