With a sandbox workspace of its own, Olly answers bigger questions


Ask Olly to audit your alert coverage and it pulls the whole set through the API, works through it with a script, and hands back the gaps as a report you can send to the team.
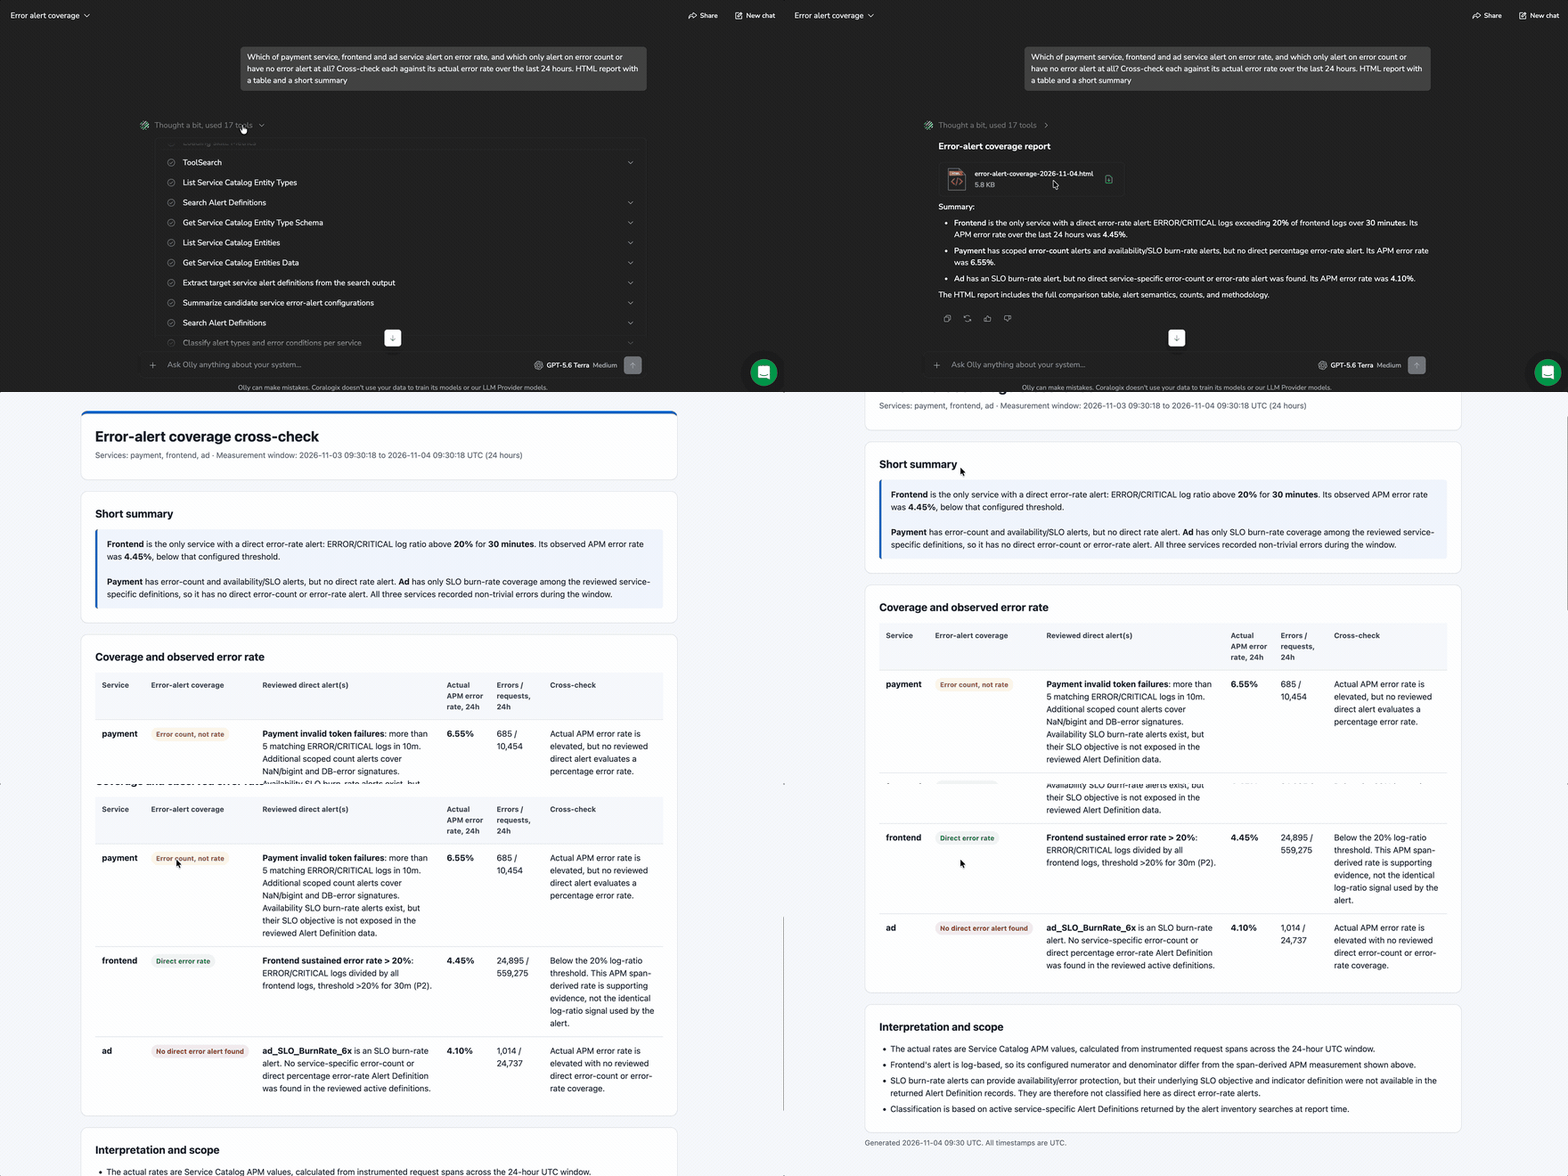
DataPrime and PromQL already answer the questions that fit a query language, and Olly has been answering those for a long time. The sandbox is for everything else: the sources that have no query language of their own, the correlations that span two languages at once, and the analysis that needs a script rather than a filter. Every Olly conversation now runs in a sandbox workspace of its own, an isolated Linux environment with Python, grep, jq, awk, and other bash commands, where Olly writes results to a file and works through them the way you would at a terminal.
What you can ask for
| Capability | What it does | Try asking |
| Analyze what has no query language | Alerts, configuration, and anything else reached through an API rather than a query, pulled in full and analyzed on disk. | Audit my alert coverage and tell me where the gaps are |
| Correlate across sources | Metrics on one side, spans or logs on the other, lined up in the sandbox rather than by eye. | Match this metric spike to the spans from the same window |
| Build an HTML report | A table and a written summary in a file you download, open in a browser, and send on. | Write up last night’s incident as a postmortem |
| Export the data | CSV, JSON, and Markdown files, attached to the reply as a download. | Give me every affected session as a CSV |
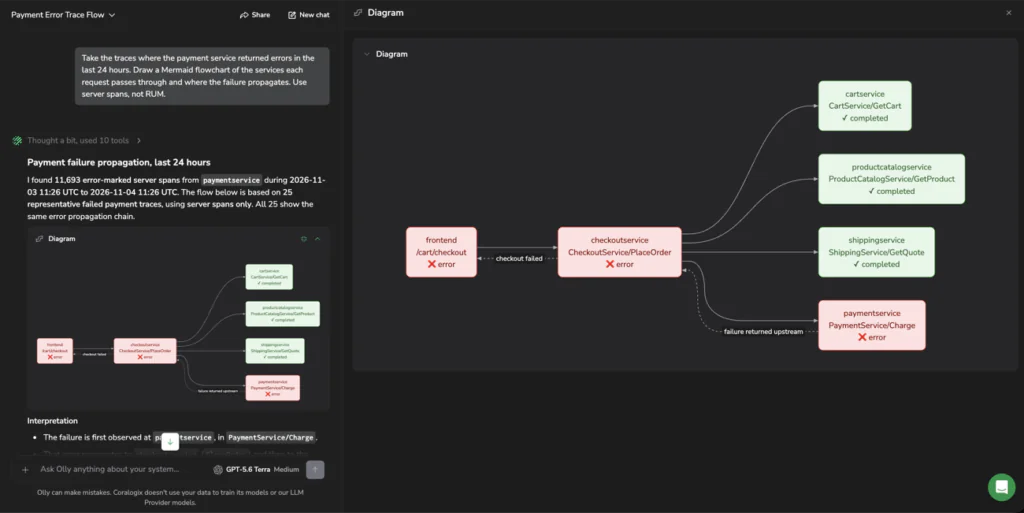
| Draw the system | Mermaid diagrams rendered in the conversation, for flows that read better as a picture. | Draw the request path through the services that failed |
| Read a page on the web | Turn it on in the AI settings and Olly reads a page you point it at, such as a vendor’s status page or release notes. | Check the provider’s status page for this window |
| Use your connected apps | The MCP servers your team connects on the Connectors page, available to Olly inside the same investigation. | Pull the linked ticket and compare it to what we saw |
| Bring in the code | With the GitHub integration connected, the repository can be read alongside the telemetry. | Show me what changed in this service before the spike |
| Put it on a schedule | The same work, run on an interval and delivered to Microsoft Teams, Slack, or email. | Send me this reliability digest every Monday |
The questions a query could not reach
Sources that were never queryable
Your alert definitions are not log lines. They live behind an API that hands back a sample rather than a result set, which is fine for looking one up and useless for asking how good your coverage is. So ask the harder version: which services have no alert on error rate, which alerts have never fired in ninety days, where the routing sends nothing to anyone.
Olly pulls the full set of definitions through the API, writes them to a file, and works through them with a script. What comes back is the posture of your alerting rather than a handful of examples, because the analysis happened over all of it. The same applies to any source you reach through an API instead of a query, and most of your configuration is reached that way.
Correlations that span two query languages
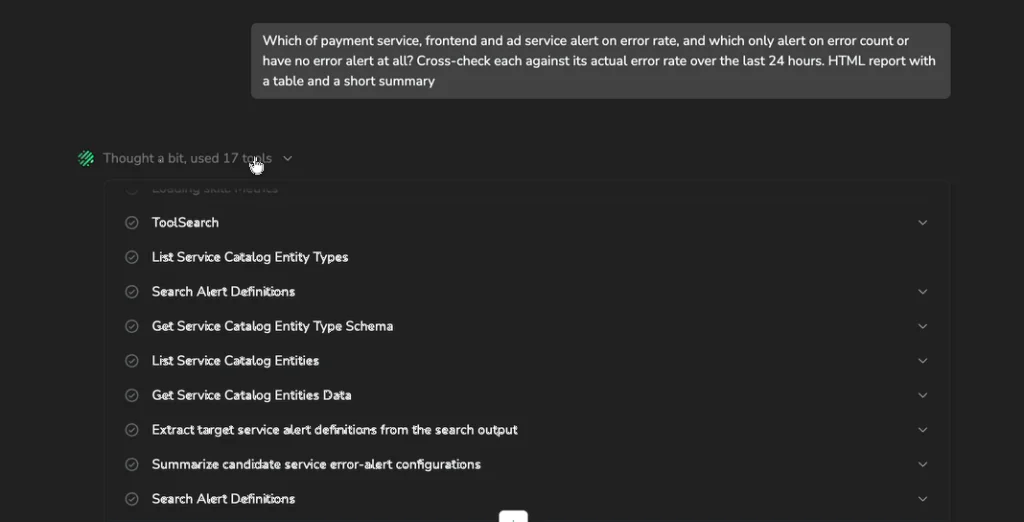
Metrics answer to PromQL, spans and logs to DataPrime. Each is good at its own side and neither reaches across the gap, so lining up a metric spike against the spans underneath it has meant running two queries and comparing them by eye.
In the sandbox both results land as files and the comparison becomes a script. Olly can align them on time, join on a service or a trace, and tell you whether the spike and the errors are the same event or two unrelated ones. The output is a single answer drawn from both sources rather than two charts side by side.
| Step | What happens |
| 01. Data comes back | From a query or an API, in whatever shape the source returns. |
| 02. It lands in a file | The full set is written to the sandbox rather than into the reply. |
| 03. Olly works the file | grep, jq, awk, and Python filter, join, and compute across the whole set. |
| 04. Only the answer returns | The lines that matter and what it computed, plus any artifact. |
Keeping the data in the sandbox is also what makes this affordable. Anthropic published figures on the same pattern for agents working through a code environment: a workflow that consumed 150,000 tokens when every intermediate result crossed the context window dropped to 2,000 tokens when those results stayed in the execution environment, a reduction of 98.7 percent.
Turning the answer into something you can send
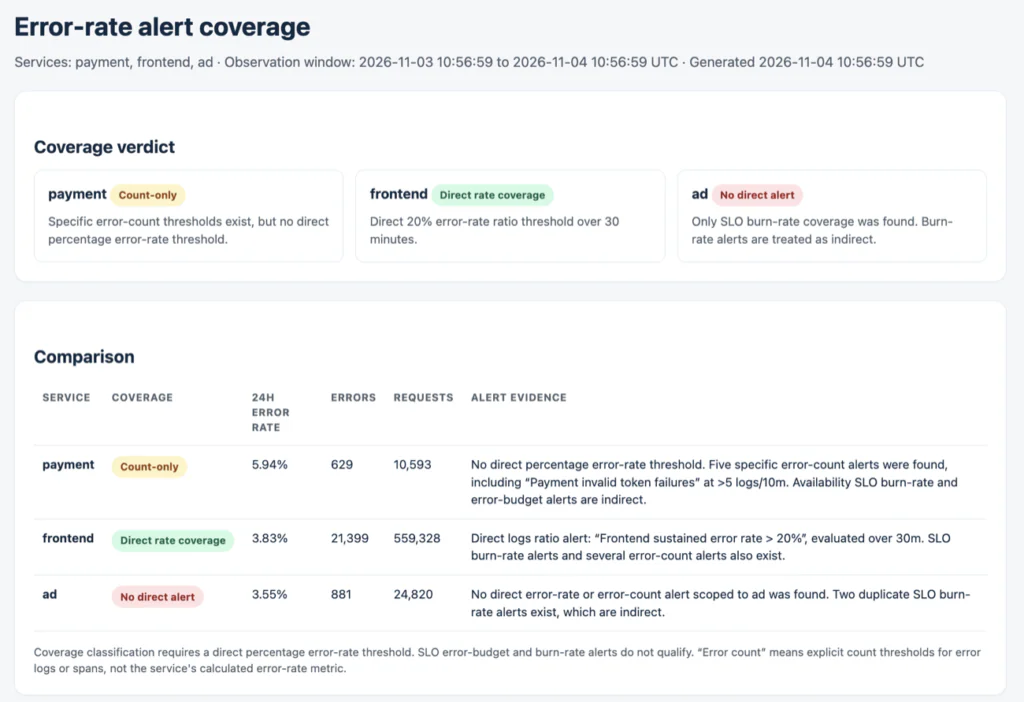
HTML reports, for the write-up you owe by lunchtime
The incident is closed and the postmortem is yours. You ask Olly for an HTML write-up covering the four hours it ran, with a table of what failed, the evidence behind each row, and a summary of what the data shows. It arrives as a file in the reply, and opening it gives you a document whose figures were computed across the full window.
What makes this worth using twice is that Olly revises the same file when you want a section changed, rather than producing a second copy you then have to tell apart from the first. Postmortems, weekly digests, and cost reviews all arrive as a document you read, correct once, and forward.
Exports, for the people who ask you for a spreadsheet
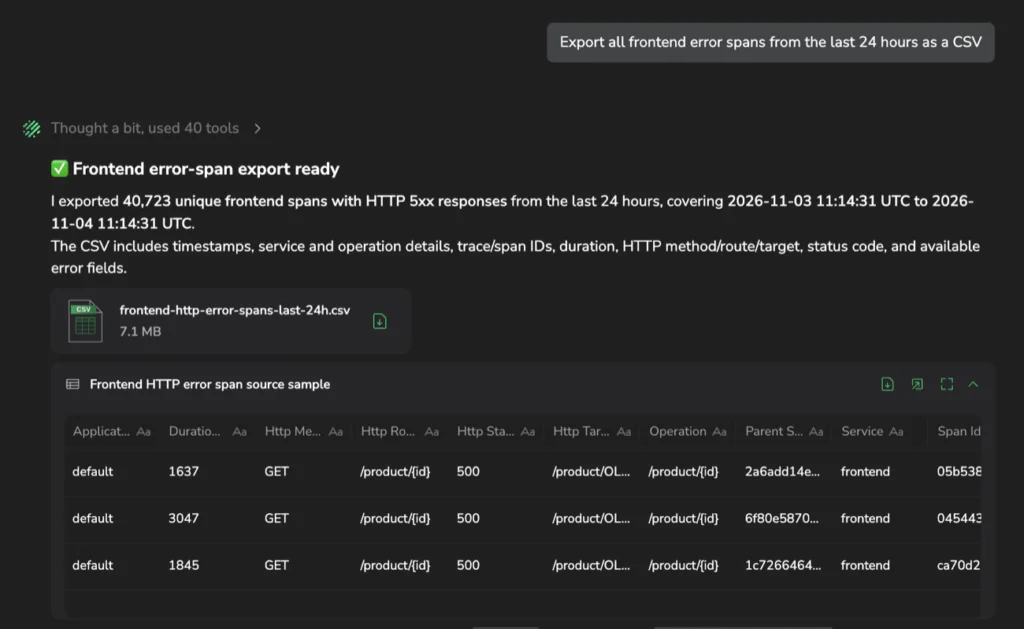
Support wants the list of customers who hit the 5xx. Finance wants last month’s spend broken out by service. Both requests normally cost an engineer a query and an export, and both are now a sentence: ask for the sessions as a CSV and the file comes back attached to the reply, in CSV, JSON, or Markdown. Files travel the other way too, so you can attach a vendor’s incident PDF and ask Olly whether it matches what your traces show.
Diagrams, for the failure that takes four paragraphs to describe
Some findings are shaped like a picture. A request crossing six services before it fails, a retry storm feeding itself, an incident whose order of events is the whole point. Ask Olly to draw the request path through the services involved and it renders a Mermaid diagram in the conversation, which you can expand. Charts and tables appear inline the same way, each opening to a larger view with its own download.
Reaching past your own telemetry
A page on the web, once your team turns it on
Plenty of investigations end at a question your telemetry cannot answer, like whether the provider was having an incident at the same time, or what a vendor changed in the release you just picked up. With network access turned on by your administrator, Olly reads the page you point it at, or one a tool handed back, and folds what it finds into the same investigation.
The apps your team already connected
Connections your team sets up on the Connectors page are available to Olly during an investigation, so the ticket or document that explains what you are seeing can be pulled in rather than described from memory. Olly sees only the connections that are enabled and the tools selected on them.
The code behind the service
When your team connects the GitHub integration, Olly can read the repository alongside the telemetry, which turns a spike in a service into a question about what changed in its code. Access follows the permissions of the account that authorized the connection, the repository is read inside the same conversation-scoped sandbox as everything else, and nothing is kept once the conversation ends.

Running it again without being asked
A report worth writing once is usually worth writing weekly, and that recurring job is the one that consumes an engineer’s Monday morning. Olly’s scheduled tasks run a saved prompt hourly, daily, weekly, or monthly and deliver through the Coralogix Notification Center to Microsoft Teams, Slack, or email.
With the sandbox doing the work, what lands in the channel is a report whose week-over-week figures were already calculated rather than a written summary of what somebody would have to go and check. An investigation your team repeats can also be saved as a custom skill, so the next person on call starts from your method instead of rebuilding it from the alert.
Why the answers hold up
An agent that runs code is only worth handing work to if you can check what it did. Observability data reaches Olly through its Coralogix tools, under the permissions of the person asking, so someone who cannot see data in the interface cannot reach it through Olly either. The sandbox belongs to a single conversation and is destroyed along with it.
Every claim Olly makes about your systems traces back to your telemetry and your permissions, and every number traces back to a calculation you can ask to see.
Pick the question your team gave up on because no query would answer it, the one that ends with somebody exporting data and working it in a spreadsheet, and give it to Olly as a single question.
Ask for the result as an HTML report, then check the work against what you found the first time. If it holds, the only decision left is which schedule to put it on.
None of this changes how you ask. There is no setting to configure and no syntax to learn, so the same question you would have typed last week comes back with more behind it: analysis run across the full set rather than a reading taken off the top of it, and a file you still have once the conversation is closed. The work that used to sit between a question and an answer somebody else can read is the part Olly picks up.
Where to read more
- Olly chat, including artifacts, charts, and how evidence appears in a reply
- Scheduled tasks, for running a saved prompt on an interval and routing the output
- Custom skills, for saving an investigation your team repeats
- File attachments, covering what you can send into a conversation
- Data processing, privacy, and compliance, covering permissions, tenant isolation, and model providers
- Enable Olly, if your team has not turned it on yet