Introducing Migration Benchmarks: every source we timed now converts in under an hour

The Coralogix migrations team has published what it measured. Since 2023 the team has moved more than 75,000 assets across 300+ migrations and onboardings, including a single migration of about 41,000 alerts.
The new Migration Benchmarks page holds the figures by source, a calculator for your own migration and the causes of delay that post-migration reviews name most. For it, the team timed one 60-widget benchmark dashboard per source: converting and reviewing the Splunk version took 12 hours in January and 45 minutes in October, and every source it timed now converts in under an hour. The page is the work of the engineers who run these migrations.
When I talk to engineers about moving observability platforms, the first thing I hear is resistance to change. People point to deadlines, budget, time and the politics of who owns what. That resistance was a fair response to what a migration used to ask of a team. No tool fixes budget or politics. What the migrations team removed is the conversion itself, which used to cost hours of engineer time for a single dashboard.
Why the people who run the stack resist moving it
I was a site reliability engineer (SRE) in my previous life, and I know where that resistance comes from. The team is carrying technical debt, some of its engineers are new to the company and still learning the systems, and there is a human side to a migration that rarely gets time or attention. A migration used to add a long stretch of hand conversion on top of that, with every dashboard and alert rewritten query by query while production kept running. Faced with that request, "not this quarter" was a reasonable answer when a single dashboard could take hours.
The conversion is the part tooling can change. The other parts, which are understanding what each dashboard and alert is for, agreeing the scope, and deciding when a converted asset is right, depend on people, and they are where a migration succeeds or slips. Resistance is decided before a migration starts, on the estimate. Hours per dashboard made that estimate look impossible, and as the next sections show, they were never the whole story.
Converting a 60-widget dashboard now takes under an hour
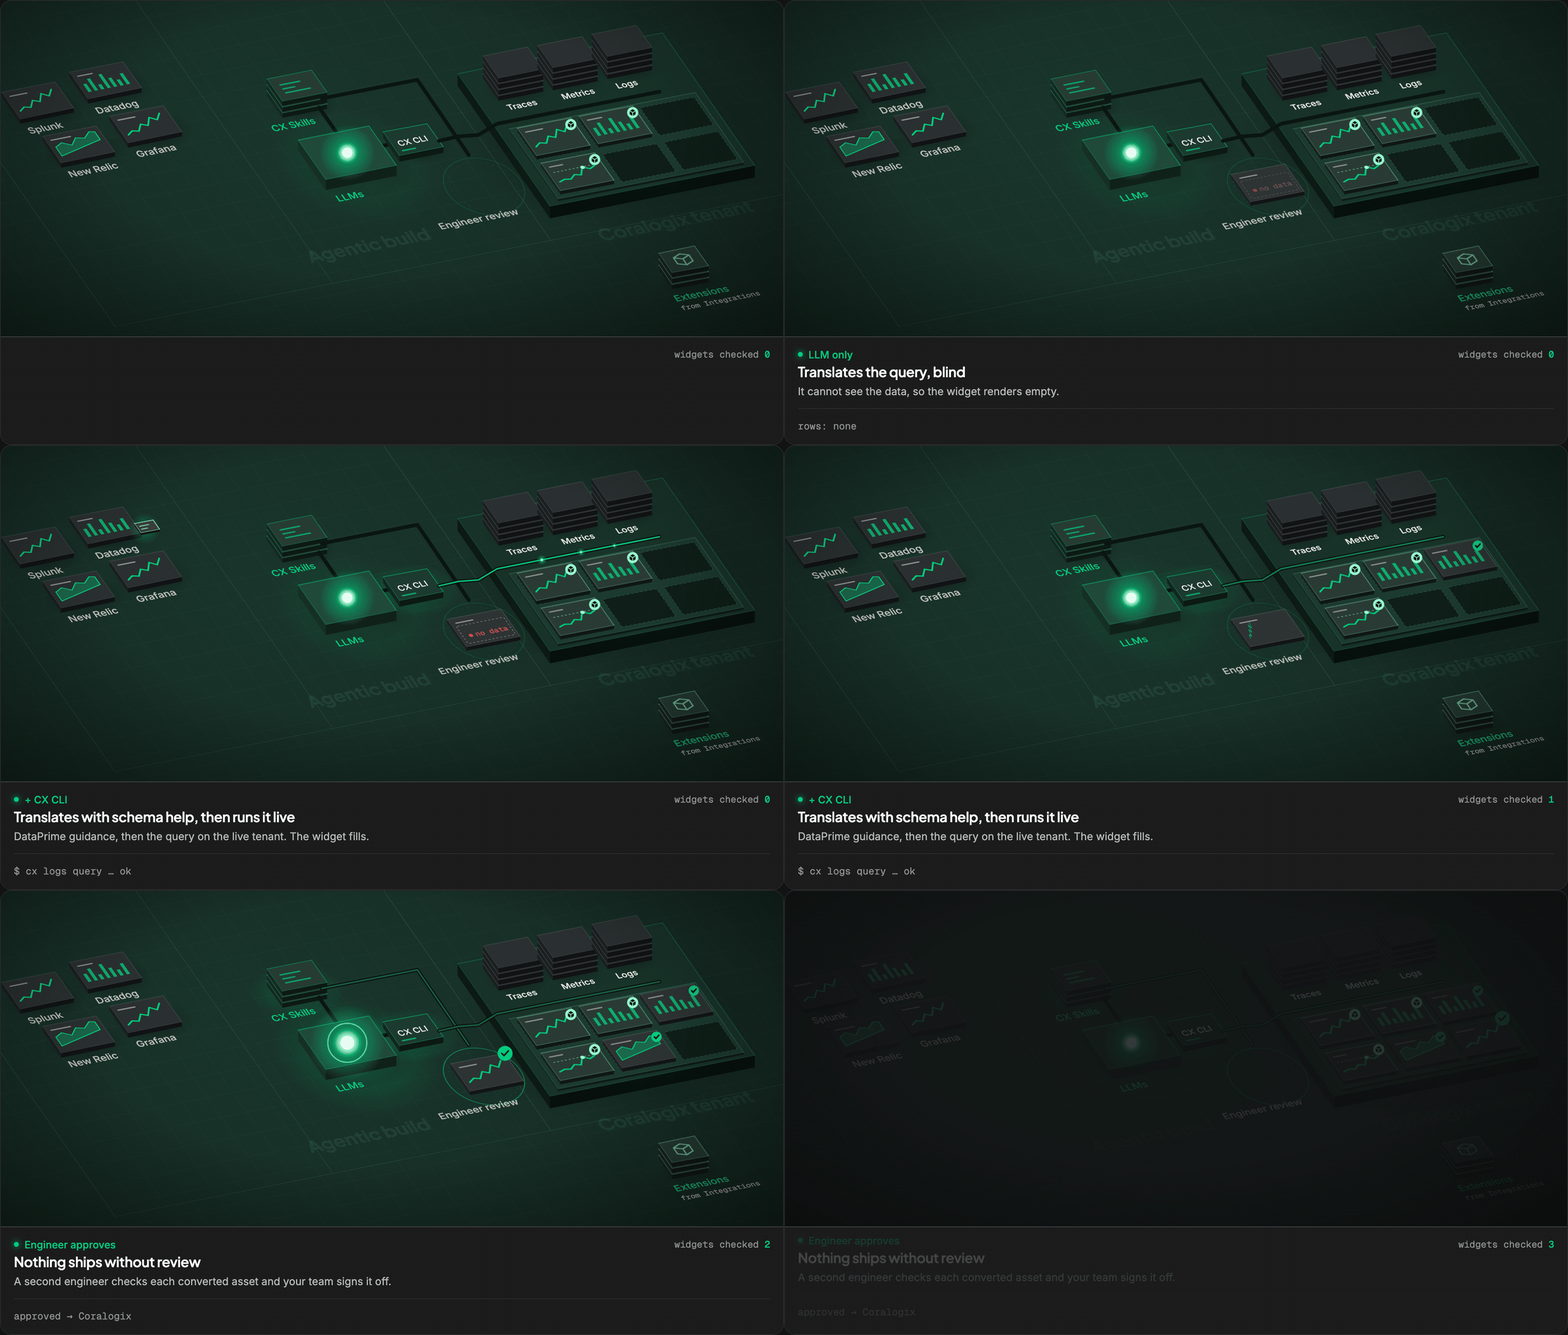
Since April 2026 the team has converted dashboards with what it calls the agentic build: large language models (LLMs) working with the CX command-line interface (CLI) and with CX Skills, which carry what the team has learned across those engagements. The CLI gives the model guidance on DataPrime, Coralogix’s query language, and runs each widget against the customer’s live tenant, so the model sees real data and a widget that would render empty is flagged before an engineer reviews it.
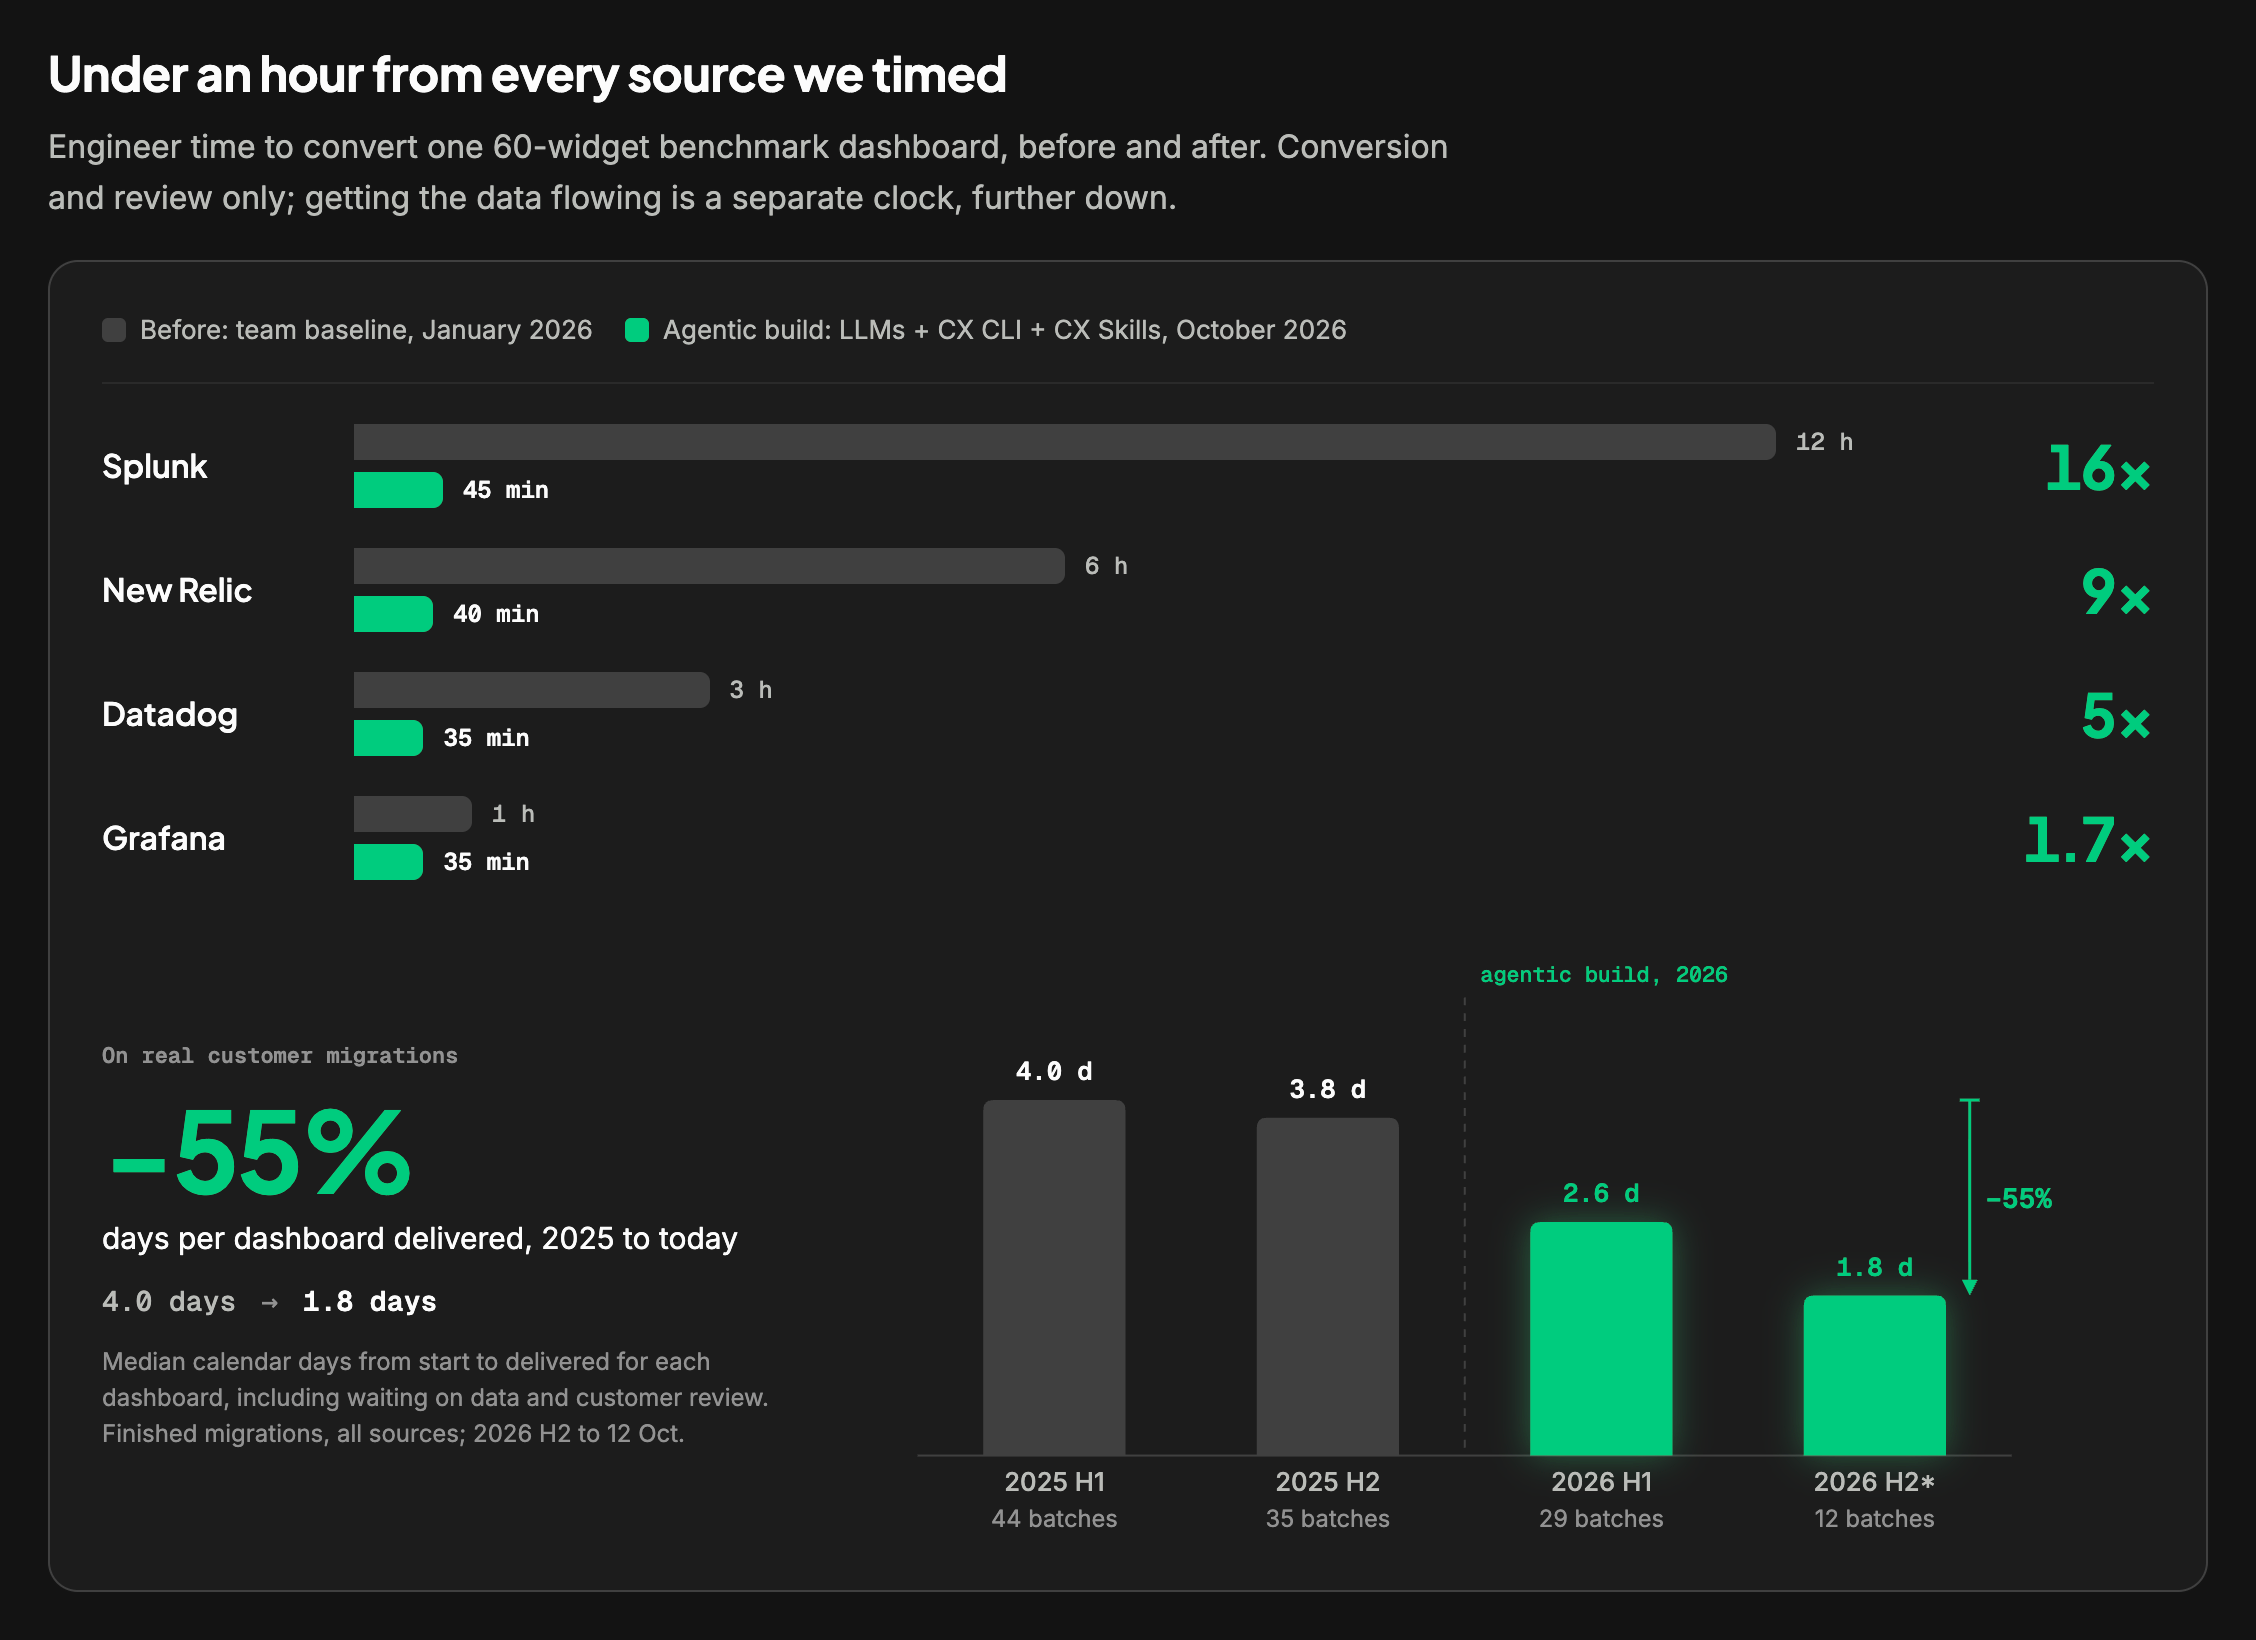
The team compared its January 2026 baseline with a timed October run of the same 60-widget benchmark dashboard, one per source, counting engineer time to convert and review. Converting the Splunk version went from 12 hours to 45 minutes, the New Relic version from 6 hours to 40 minutes, the Datadog version from 3 hours to 35 minutes, and the Grafana version from 1 hour to 35 minutes. The gain is largest where the January baseline was slowest: 16 times faster for Splunk, 1.7 times for Grafana.
Real customer migrations show the same shift. The median calendar time from start to delivery, per dashboard, with waiting on customer review included, fell from 4.0 calendar days in the first half of 2025 to 1.8 in the second half of 2026 so far, across 12 batches; part of that fall reflects batch size, not only the tooling.
Where the time goes
Converting a 60-widget benchmark dashboard takes under an hour of engineer time, but getting data flowing into Coralogix took a median of 3.5 weeks of elapsed time from kickoff in recent migrations. The page’s calculator estimates half a week to a week of build effort for a typical migration of 25 dashboards and 75 alerts once the data is in. Put those side by side and, by the calculator’s estimate, build effort no longer sets the pace. The data, the scope and the validation do.
Most migrations already finish on time: since 2024, three in four finished migrations with a planned end date landed on or before it, in a period that mostly predates the agentic build. The post-migration reviews point the same way as the 3.5 weeks. Of 46 reviews, 27 named at least one cause of delay, and a review could name several. The top three were data not onboarded before the migration began, customer validation that took longer than expected, and scope that changed mid-migration. None of those is the conversion itself.
On engineer-led migrations, the team helps you set the inventory and the scope. Your team decides which services, dashboards, alerts and service level objectives (SLOs) must be ready before the old vendor is switched off, and signs off each converted asset. A second engineer checks every converted asset, and anything that does not convert cleanly is flagged with evidence. Converted alerts are created switched off, so nothing pages your on-call until a person has reviewed the threshold.
A migration is not a lift and shift. It’s a professional engineering service. The agentic build does the conversion now, so our engineers spend their time with yours: deciding what to keep, retire or rebuild, and checking converted assets before your team signs them off. During the migration process, everyone should and must treat this as an opportunity to get more value from your telemetry than your previous observability stack did.
Mayur Moon, Manager of Cloud & Observability Engineering, Coralogix
Data not onboarded was the most common cause of delay, so start there. It is the step your team can take alone. Coralogix integrations connect your sources, and extension packages you deploy yourself bring prebuilt dashboards, alerts and parsing rules. Moving from a vendor agent to OpenTelemetry can rename fields and metrics, so custom dashboards and alerts come after the data is flowing.
What the human part of a migration looks like
A migration is a chance to retire the alerts nobody can explain, and the engineers who carry the old setup know which ones they are. When I was on site with a new customer, their engineers came up to tell me they were looking forward to the migration. They had so much alert fatigue that they wanted to restart and rebuild.
Google’s SRE book treats signals that no dashboard shows and no alert uses as candidates for removal, and a migration is one of the few moments when a team goes through most of them. When conversion takes under an hour of engineer time per dashboard, a team that inherited its dashboards has the hours to find out which ones still matter, and each alert left over can be retired or rewritten with a reason attached.
Run the calculator on the Migration Benchmarks page for your own dashboards and alerts. Before you do, write down which dashboards and alerts must work on the day the old vendor is switched off, because that list is your scope, and everything else is a conversation about what to retire.