A 4-Month Bug Fixed in <10 Minutes with Olly

In today’s highly interconnected systems, the subtle relationships between services are rarely obvious. Modern, complex architectures generate telemetry that functions less as “flashing signs” and more as faint “breadcrumbs” to be followed across a vast network of signals.
In 2025, about two-thirds of outages involved third-party systems like cloud platforms and APIs. AI solutions are uniquely well suited to solving this problem, and assist engineers in finding their way through the maze of signals in their telemetry. Olly, the autonomous observability agent, excels at following these breadcrumbs. Let’s look at an example.
A 4-month old latency spike issue
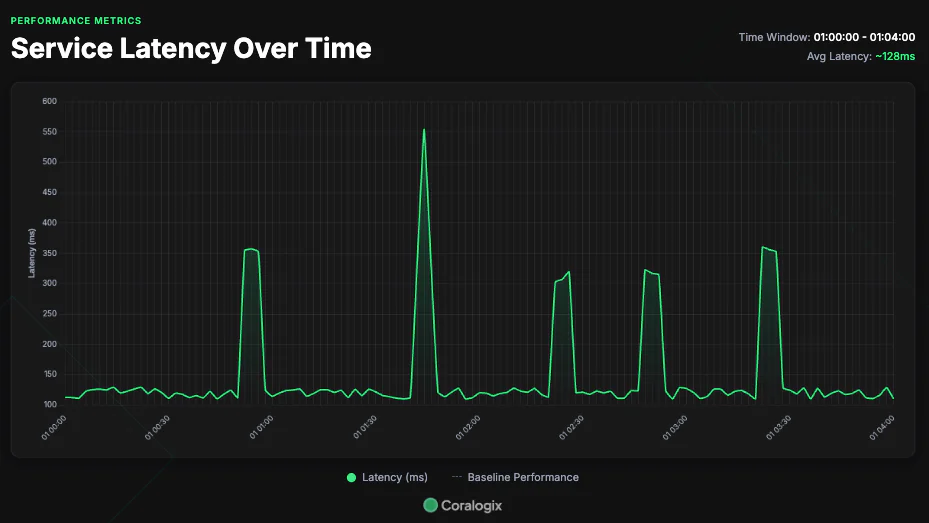
One of our users had a persistent but intermittent problem that resurfaced over and over, but they were struggling to understand the root cause. One of their components, the NotificationService, was seeing sharp, intermittent spikes in latency. These spikes had a meaningful impact on their downstream customer experience, but they were struggling to identify the root cause.
The initial investigation
The team did what any good engineers do when inspecting an issue in a distributed system. They inspected the telemetry for the Notification Service, but they could not see any indication as to why the system continued to spike. This left them confused. Systems don’t malfunction on their own, but the root cause was not there. This gave them some idea that the problem lay elsewhere, but they were not sure how to continue their investigation.
The problem of tribal knowledge
At this stage, the team were relying on their knowledge of the system. This knowledge was spread across their colleagues across the organization, so it was difficult for them to understand the context. Employees spend 1.8 hours / day searching for information, with the average organization losing around $47m / year to inefficient knowledge sharing. This is the exact challenge that this engineering team faced.
When operating a distributed architecture, full context is absolutely essential. This is when they turned to Olly.
How Olly tackled the problem
Olly is more than a simple assistant, converting or running simple queries. The true power of Olly lies in its ability to run full debugging investigations, from start to finish, powered by the Coralogix data layer, giving it the ability to issue a sequence of crafted queries, designed to identify the true root cause of a problem.
At the heart of this issue is the telemetry “breadcrumb” problem. Rather than an obvious smoking gun, sitting in a neatly packaged trace, this problem sat between traces, across petabytes of telemetry and thousands of engineers. Olly, combined with our data layer, is uniquely able to sift through this information and find the trail between the breadcrumbs, and separate signal from noise.
Identifying the patterns in the telemetry
First, Olly explored the customers telemetry and began sorting through patterns in the inbound data. Olly, backed by the Coralogix data layer, was able to quickly identify patterns that pointed to a clear flow of data. It identified that while at first glance, the NotificationService is only dependent on the EmailService, there is actually a more complex network of transitive dependencies that lead to a Postgres database.
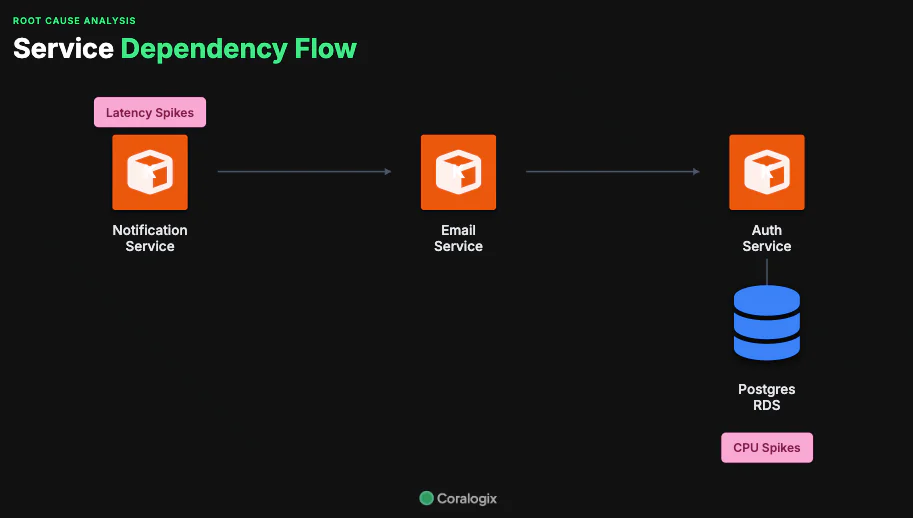
By establishing these patterns and building this service map, Olly gave itself a new avenue to investigate.
Spotting the CPU Spikes in RDS
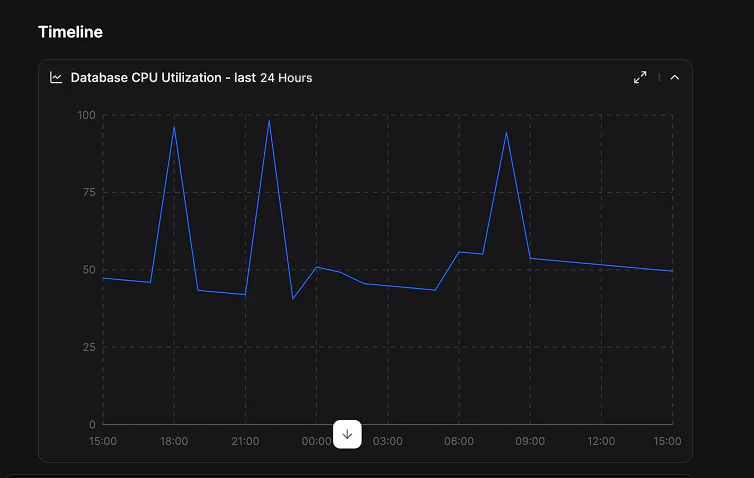
Once Olly determined that the NotificationService had a transitive dependency on the RDS instance, it began the next phase – looking for any performance limitations. These downstream services looked healthy, except for the RDS database. This database was showing CPU spikes, and those CPU spikes clearly correlated with the slowdown in the notification service.
These CPU spikes, with the clear time correlation, are almost certainly a factor in the slowdowns experienced in the NotificationService, but there is more digging to do. Olly was able to understand that while these CPU spikes were important, they were not the true root cause, and that something must be happening to the database.
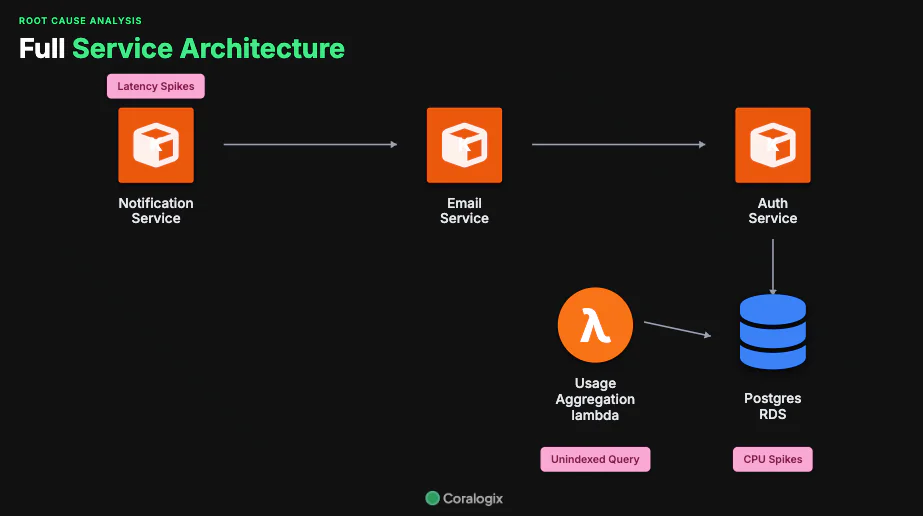
The offending lambda function
Olly sifted through the full set of dependencies reading from and writing to the database, looking beyond the critical path between the NotificationService and the Postgres DB to understand what else could be contributing to the CPU spikes. Instead of relying on a mental map of shared infrastructure, it used the available telemetry to quickly narrow the search to the few interactions that actually mattered.
Within minutes, Olly identified a Lambda function whose read activity consistently coincided with the RDS CPU spikes. This correlation was visible directly in the logs, creating a clear signal in what previously looked like an unpredictable pattern.
Once again, Olly has taken another step through the problem domain, but another question persists. What specifically is this lambda function doing that is slowing down the database so much? This is not business as usual, and any thorough root cause analysis must include the true root cause.
An unoptimized query
Olly dug deeper into the Lambda’s log activity and finally arrived at the real cause. The logs indicated large scan operations on unindexed tables. This is a surefire way to spike CPU and cause a noisy neighbor problem.
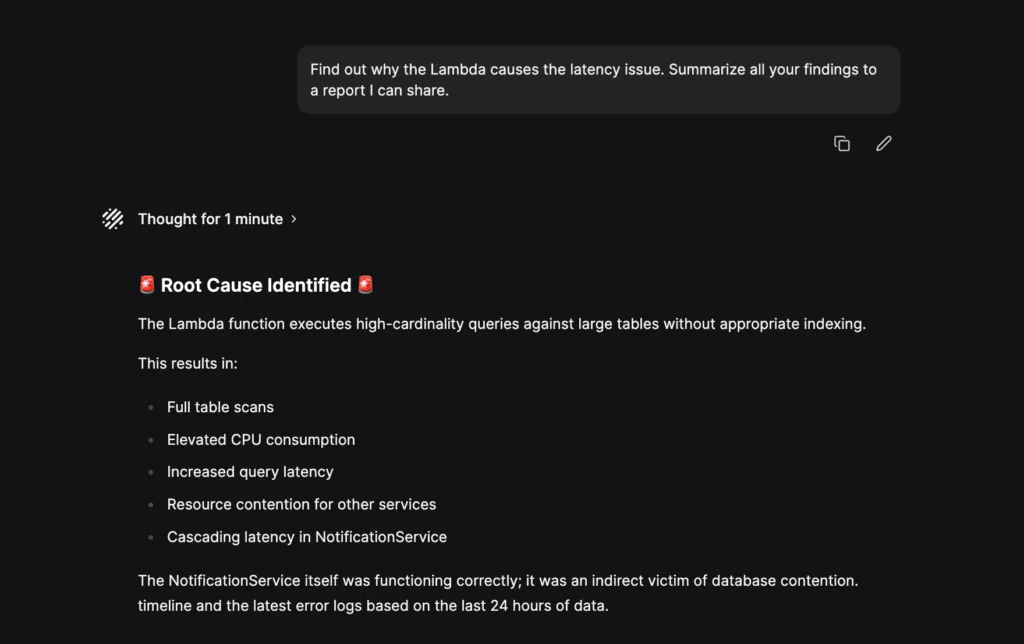
Olly identified the query, rolled everything into a single report, and made clear recommendations to the user for optimizing the queries coming from the lambda function.
Why was this so difficult to detect?
In a sufficiently large system, correlating completely disconnected events across only time is challenging. It can be tough for organizations to sift through the noise, but this is exactly what makes Olly so powerful in this use case. Olly is able to move from breadcrumb to breadcrumb, identifying those time correlated events and identifying the true causal relationship between completely separate processes.
Full, automated root cause analysis
This issue looked like a NotificationService problem, but the real cause sat outside its normal debugging boundary. This gap, between initial problem and true root cause, was significant.
Olly closed that gap. It traced the ripple effect back to an upstream Lambda, confirmed the timing correlation in logs, and pinpointed the exact failure mode: repeated writes to an unindexed table. What had resurfaced for four months was reduced to a clear root cause and a clear fix in under ten minutes.
—
If you are dealing with recurring latency, noisy alerts, or incidents that span too many services to debug manually, Olly can help you identify the root cause faster, even if the knowledge is split across teams, countries, accounts or services.