
Sharper, scalable, deeper investigations
Explore
Correlate logs and distributed traces on a single interface to isolate production system anomalies instantly without tool context switching.
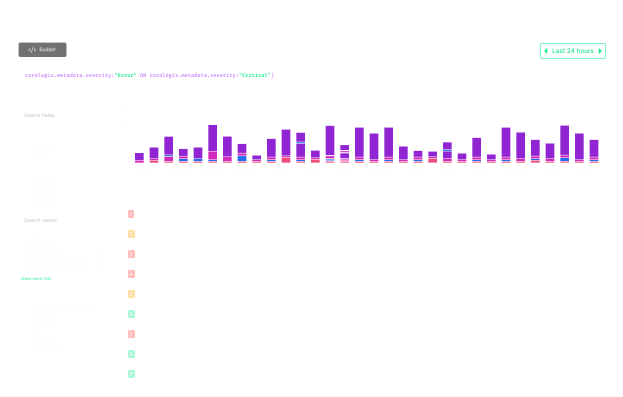
Make unstructured data explorable

Unified Querying
Toggle from Visual Builder to DataPrime code mode in one click without losing your query context for full analytical control.

Intelligent Field Discovery
Track evolving schemas automatically to deliver context-aware autocompletion based on exactly when fields existed, eliminating investigative guesswork.

Relational Filters
Filter spans by trace hierarchy with zero complex syntax required. Isolate parent-child structural failures in just two clicks.
Investigate without context switching
Multi-mode Querying
Query natively via three distinct modes
Investigate logs and traces using visual menus, rapid Lucene text searches, or advanced DataPrime pipelines without ever losing context.
Structural Analytics
Analyze millions of telemetry events
Group high-cardinality records instantly within the Overview tab to calculate counts and percentiles without writing any query syntax.
Log grouping
Cluster repetitive logs into templates
Leverage automated log aggregation algorithms to surface critical pattern shifts and isolate rare errors instead of scanning endless lines.
Performance Analytics
Surface root causes without raw traces
Leverage the Highlights tab to auto-analyze field distributions, then use Compare Mode to isolate system variations between distinct timeframes instantly.
Telemetry metrics
Track system health at a glance
Monitor real-time RED metrics inside the Signals tab, switching to Outliers view to map latency percentiles alongside error distributions.
Interactive Visualizations
Spot hidden system performance shifts
Turn telemetry volume into dynamic timelines, then click any data point to open the drill-down drawer directly to view raw records.
Scoped datasets
Isolate the right data scope
Switch datasets instantly without losing filters. Save your configuration as a view or copy the URL to share your workspace.
Scalable observability for your systems
Scalable observability for your systems
In-stream telemetry intelligence
Continuously analyzes incoming logs and spans to surface latency and error drivers as they emerge, without waiting for users to report an incident.
Index-free data search
Enables lightning-fast querying of your telemetry datasets without the overhead of massive indexing, keeping investigation speed high and storage costs completely predictable.
High cardinality without tradeoffs
Preserves every single log and span attribute that matters for root cause analysis across endpoints, regions, and versions so you can slice investigations precisely without preplanning.
Historical context analysis
Keeps your long-term historical data accessible for regressions, seasonality trends, and post-incident learning so you can pinpoint exactly when an issue started.
Read More About Real User Monitoring
Real User Monitoring Tools: Key Features and 10 Tools You Should Know
Key Features of Real User Monitoring Tools RUM tools typically offer the following features: Notable...
What Is Real User Monitoring (RUM)? Metrics and Best Practices
How Real User Monitoring Works RUM tools typically function by integrating a small piece of...

What Is Page Load Time and How to Make Your Pages Blazing Fast
Why Is Page Load Time Important? User Engagement and Customer Satisfaction Page load time is...
