Introducing the new Coralogix Metrics Engine


Coralogix has spent years building metrics infrastructure that handles high cardinality and high dimensionality without flinching, with governance, usage visibility, and cost optimization built into the platform, and recognized industry delivery to show for it. Today that infrastructure takes its biggest step yet. We have rebuilt the metrics engine from the ground up, with a new pricing model, a set of new capabilities, and a tripled fair usage allowance to enjoy them in. The goal is simple: the best possible metric data for human and agentic users, without constraints that punish you for wanting it.
What has changed?
At the core of this release is an engineering rebuild. The query engine has been rewritten in Rust to run highly parallelized, distributed queries: wide time ranges are split into windows and run concurrently, high-cardinality scans are fanned out across shards and aggregated at the source. What has not changed is where your data lives. Metrics remain at rest in your own cloud object storage, in an open, machine readable format, the same ownership commitment Coralogix makes across the platform.
The engineering goal was to extend the platform’s existing support for high-cardinality metrics and to introduce governance features that handle genuinely stale series automatically. There is a second motivation running underneath it. As Coralogix becomes the context platform for agents, the gaps in metric data start to matter differently. An engineer looking at a dashboard can intuit around a missing label or a coarse sample interval. An agent cannot. It either has the data or it hallucinates the gap. Much of what follows is designed to close those gaps, and all of it arrives with a pricing model built to make richness affordable rather than punishable.
The active time series
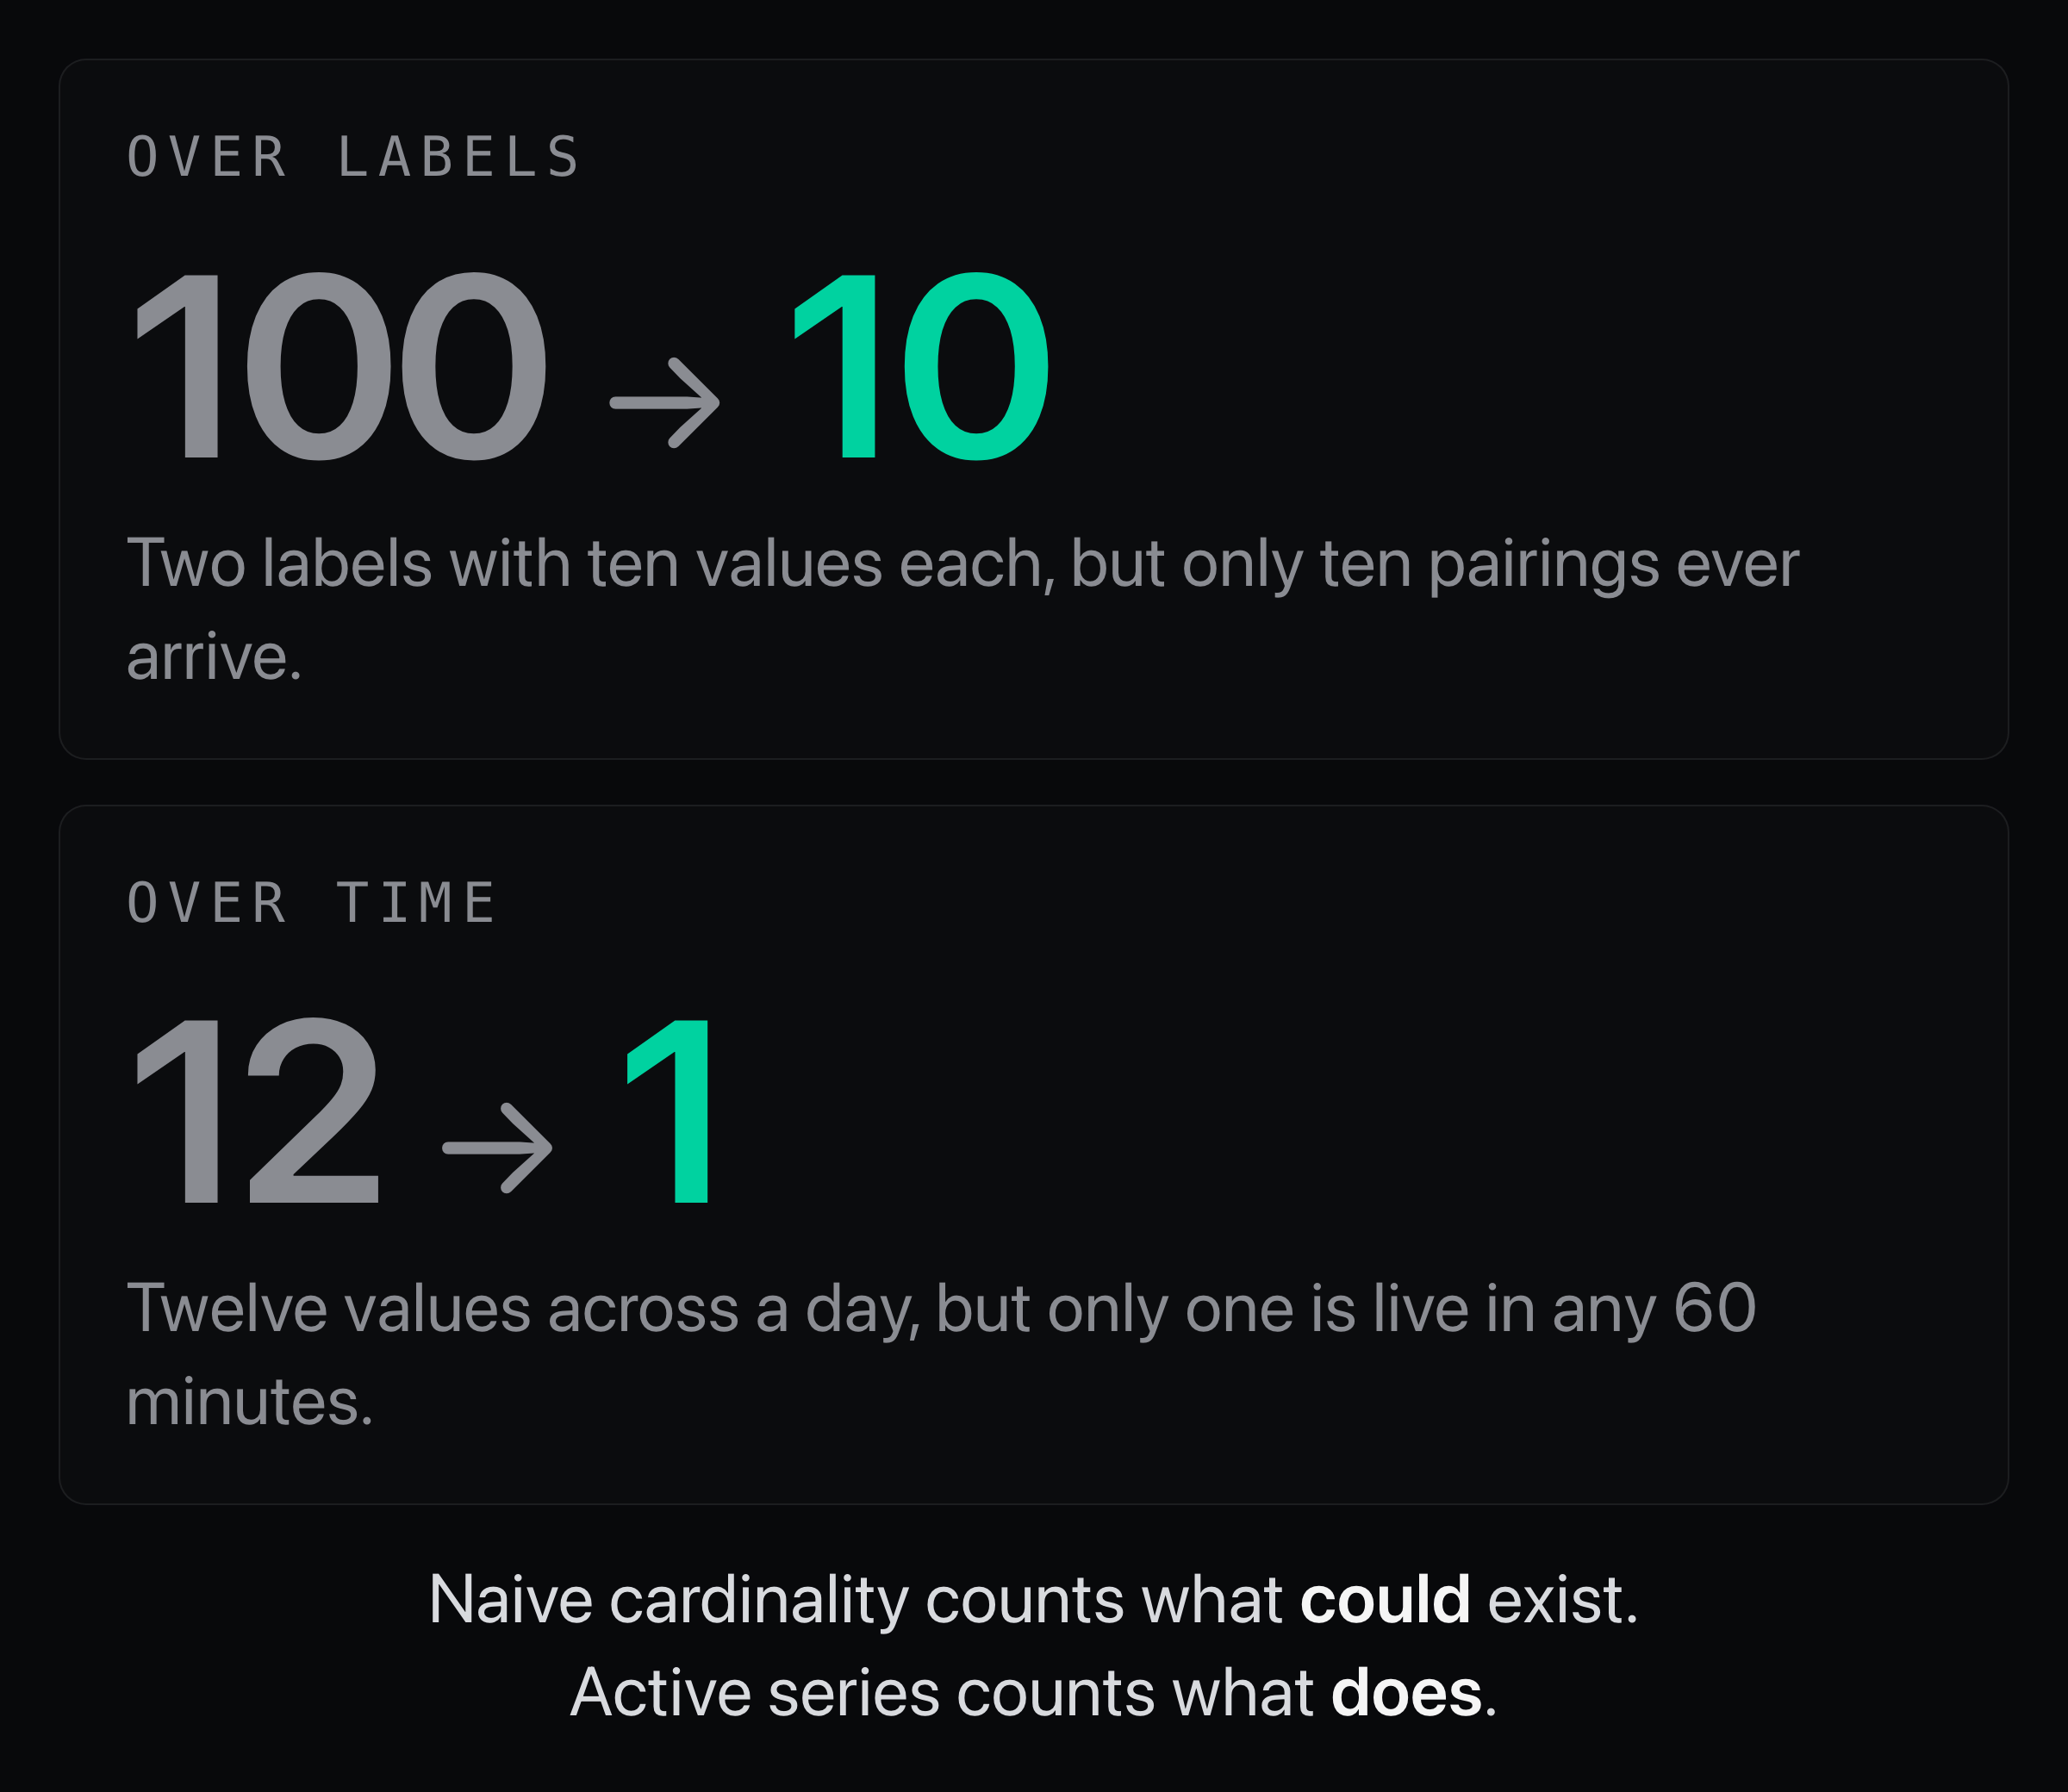
The new engine tracks one thing: the active time series, a series that has received data in the last 60 minutes. Traditional cardinality counting treats every distinct combination of label values as a separate billable series, which means the bill grows with every accident of how your labels happen to be shaped. Counting active series counts what genuinely exists, along two axes.
The first axis is time. Cardinality is usually counted as every value a label has ever taken. If a label cycles through twelve values over a day but only one of them is live in any rolling 60 minute window, the old way of counting sees twelve series. The new engine sees one active series, because at any moment that is all that actually exists, and that is what you are billed for.
The second axis is redundancy between labels. Take two labels with ten values each. Naive cardinality multiplies them: ten times ten, a hundred possible series. If the values map one-to-one, each value of the first label always arriving with the same value of the second, there are only ten real streams, and ten is what you pay for. A label that restates something already unique adds context, not cost.
Resolution and dimensionality, at no extra cost
Because the engine bills the active time series, two things that used to cost money no longer do: resolution and dimensionality. Resolution is your sampling rate, how often a value is recorded. Dimensionality is the number of label values riding on each series. Neither changes which series are active, so neither changes the bill.
Resolution matters most during an investigation. A 60-second sample interval hides anything that begins and ends between two scrapes, and a person reading the graph at least knows the flat line might be lying to them. An agent does not. It reads two healthy samples and concludes nothing happened in between, then builds the rest of its investigation on that conclusion. This is why we actively encourage higher resolution on the new engine: 15-second metrics expose the variance that 60-second metrics smooth away, and that variance is the base context an agent needs when it is reasoning about a production outage.
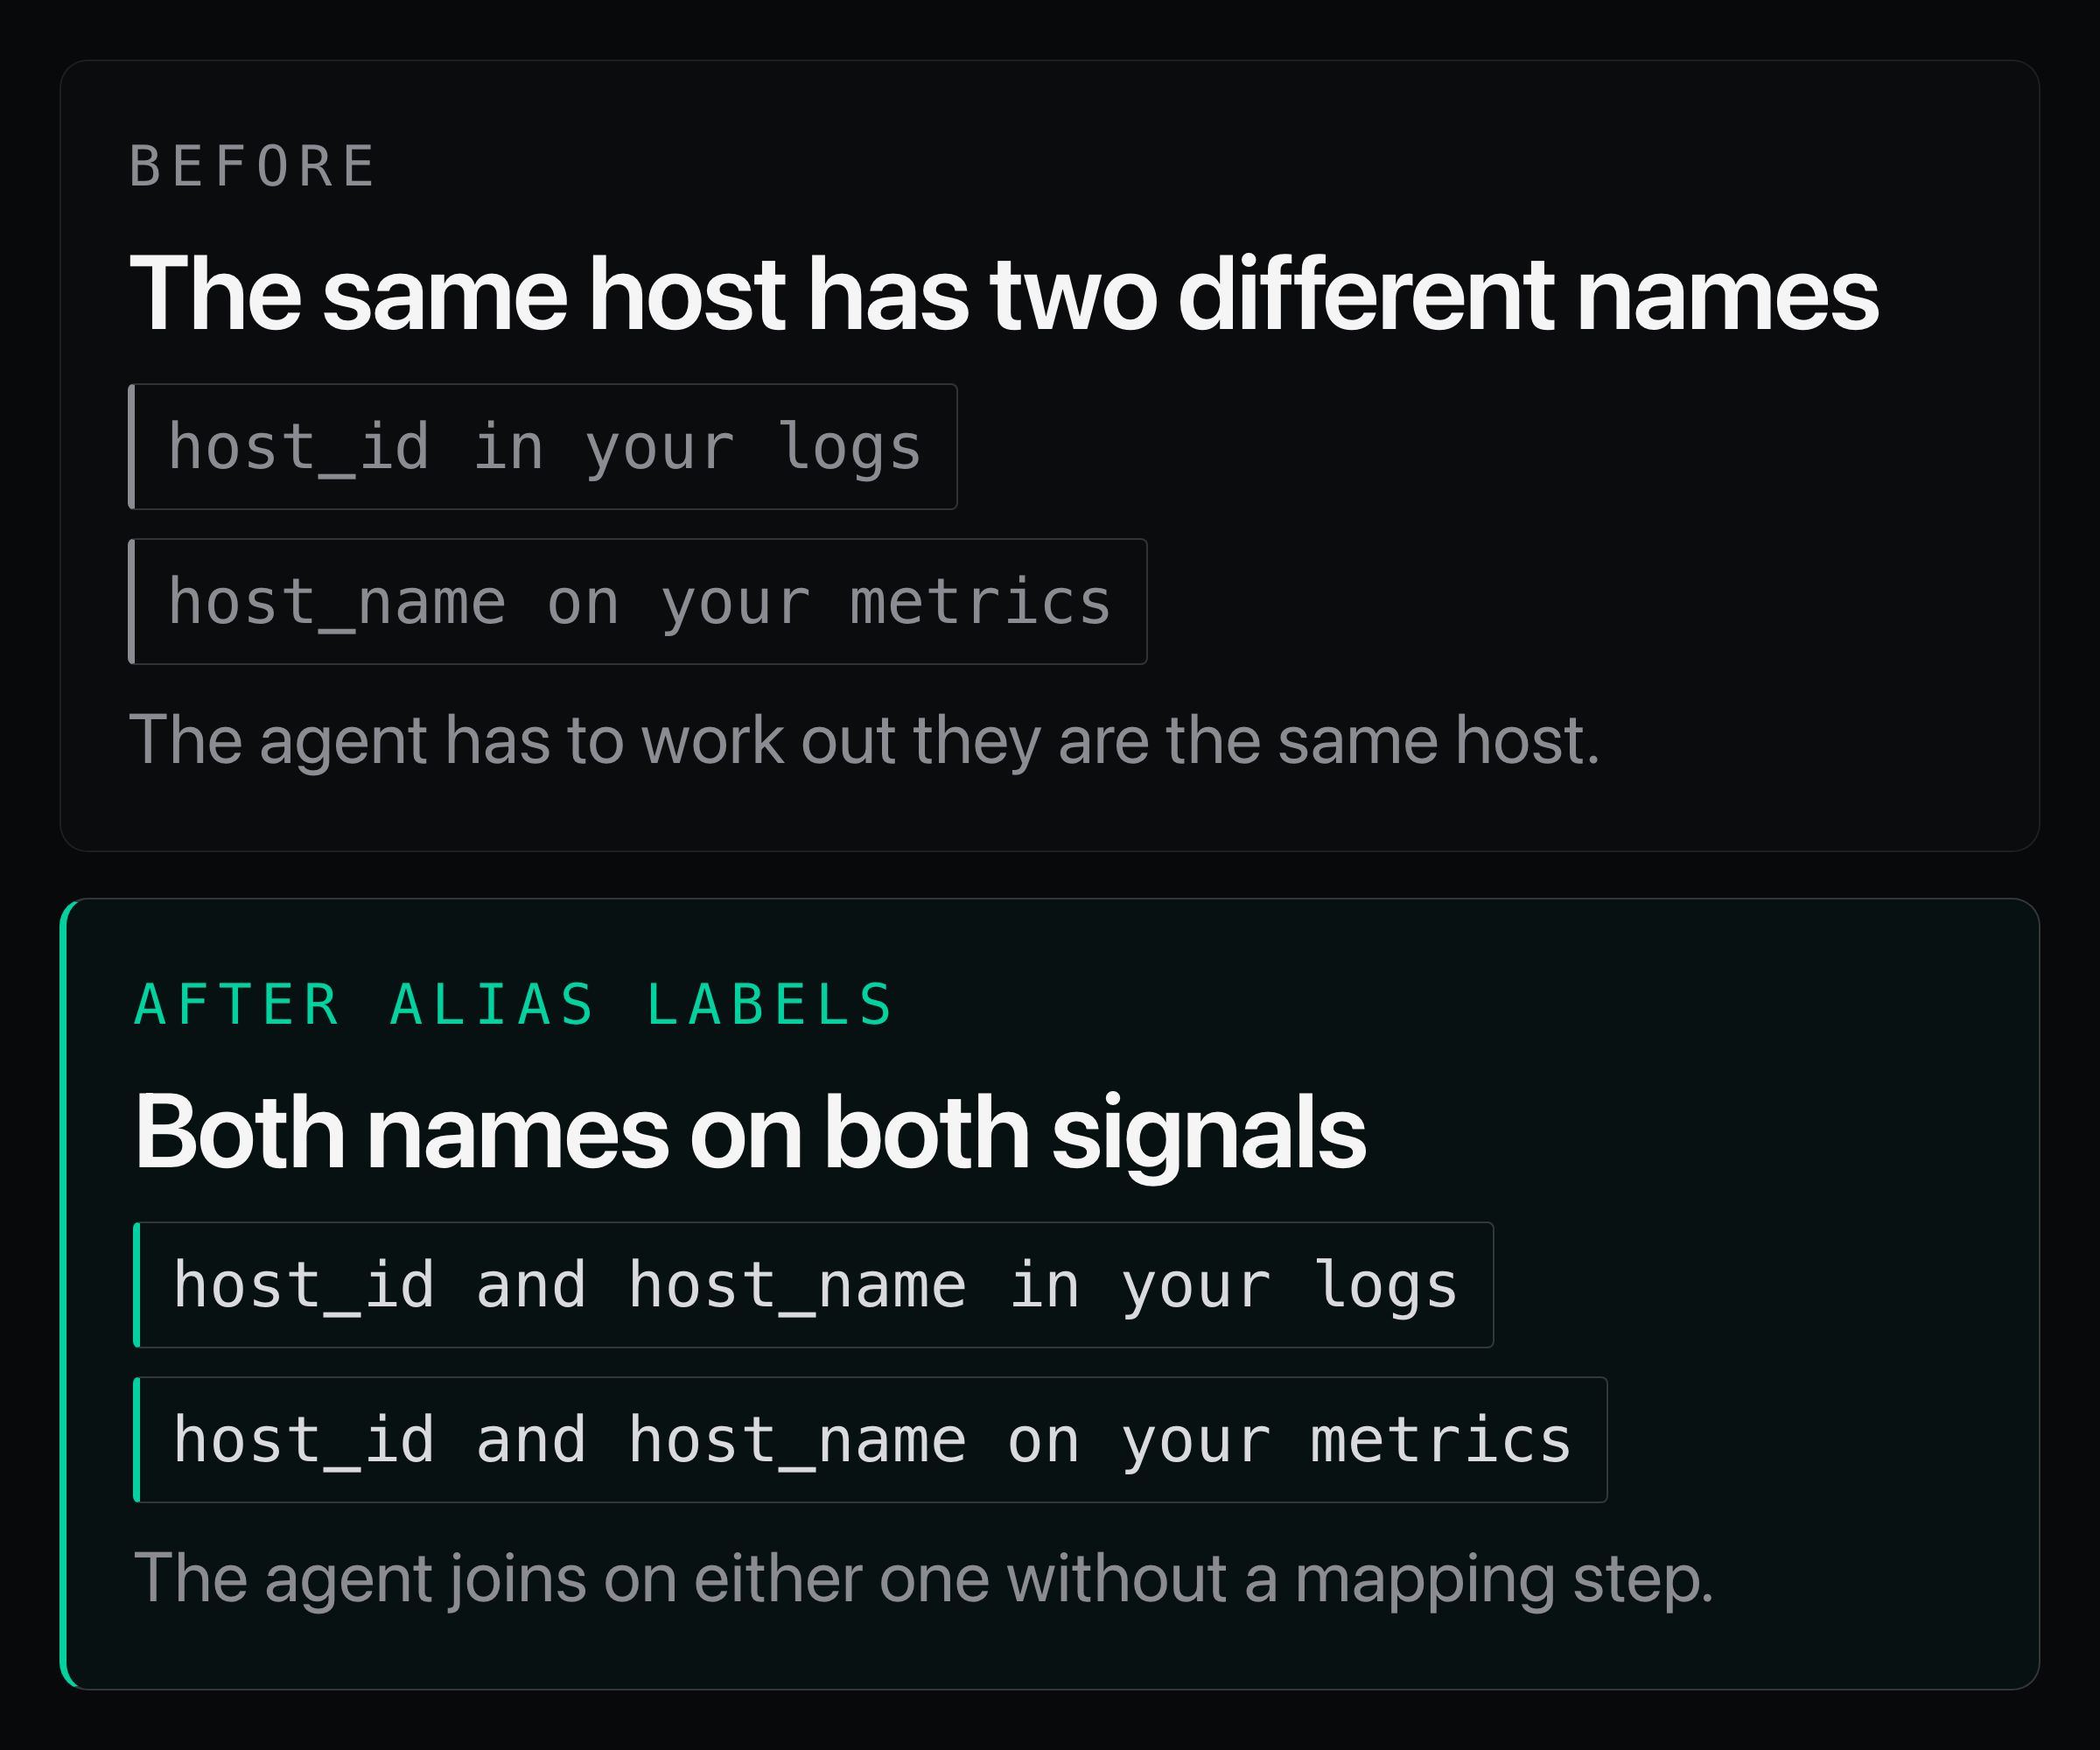
Free dimensionality changes how you label. A host can carry its hostname alongside a host ID, a server ID, and a node ID, all mapping one-to-one, all billed as the single series they truly are. Under a naive cardinality model that labeling scheme is expensive enough that teams strip it back to one identifier and hope it is the right one. On the new engine the aliases stay attached, which means an agent that pulls a host ID out of a log line can query metrics on the host ID directly, rather than first working out that two differently named labels describe the same machine. Every alias is another angle an agent can approach the data from without doing mapping work first.
Never delete a metric again
The prevailing pattern for controlling metric cost is binary: accept a metric and pay full price for it, or block it at the door and lose it. There is rarely a concept of tiering. The new engine introduces Total Cost of Ownership (TCO) routing for metrics instead, with two tiers: operational metrics and historical metrics. Operational metrics are for understanding what is happening in your system right now. Historical metrics are for long-term trend analysis, retained for very long periods and always accessible to query. The only difference between the two is that the historical tier does not retain the first 24 hours of data. Nothing in either tier is ever deleted to save money.
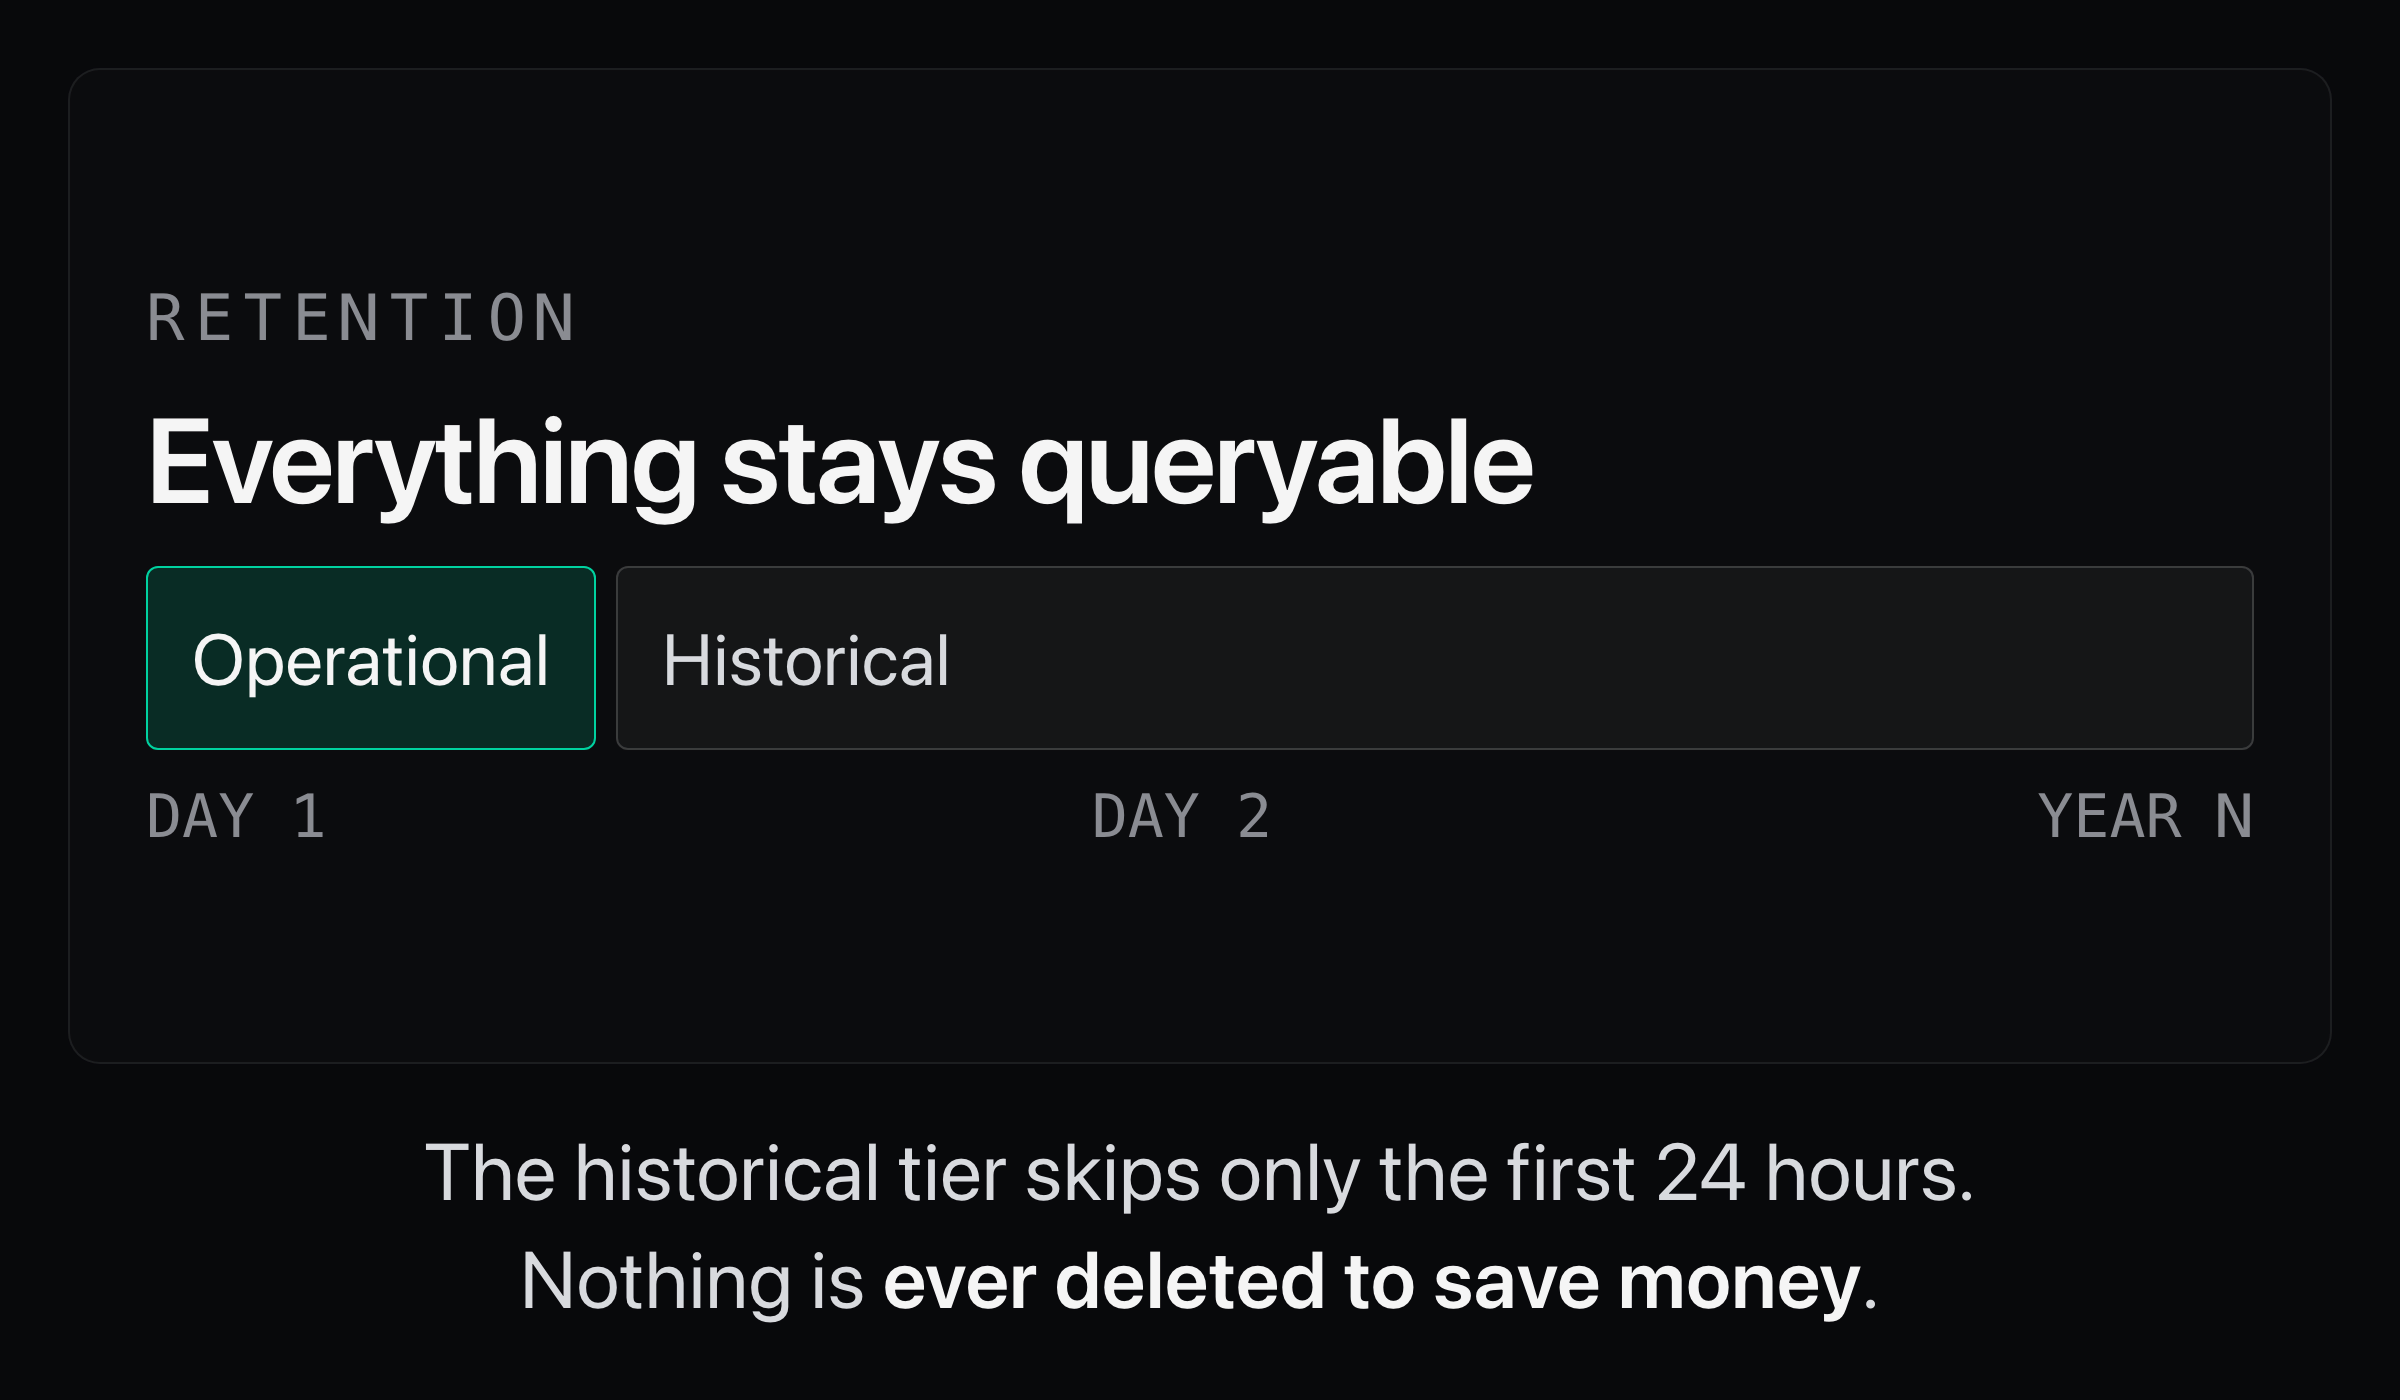
Metrics can, of course, still be blocked to prevent them being retained in any way, but this new engine opens up new options for retention and querying, to bring metrics inline with events based data ingestion in the Coralogix platform.
Dynamic routing of metrics
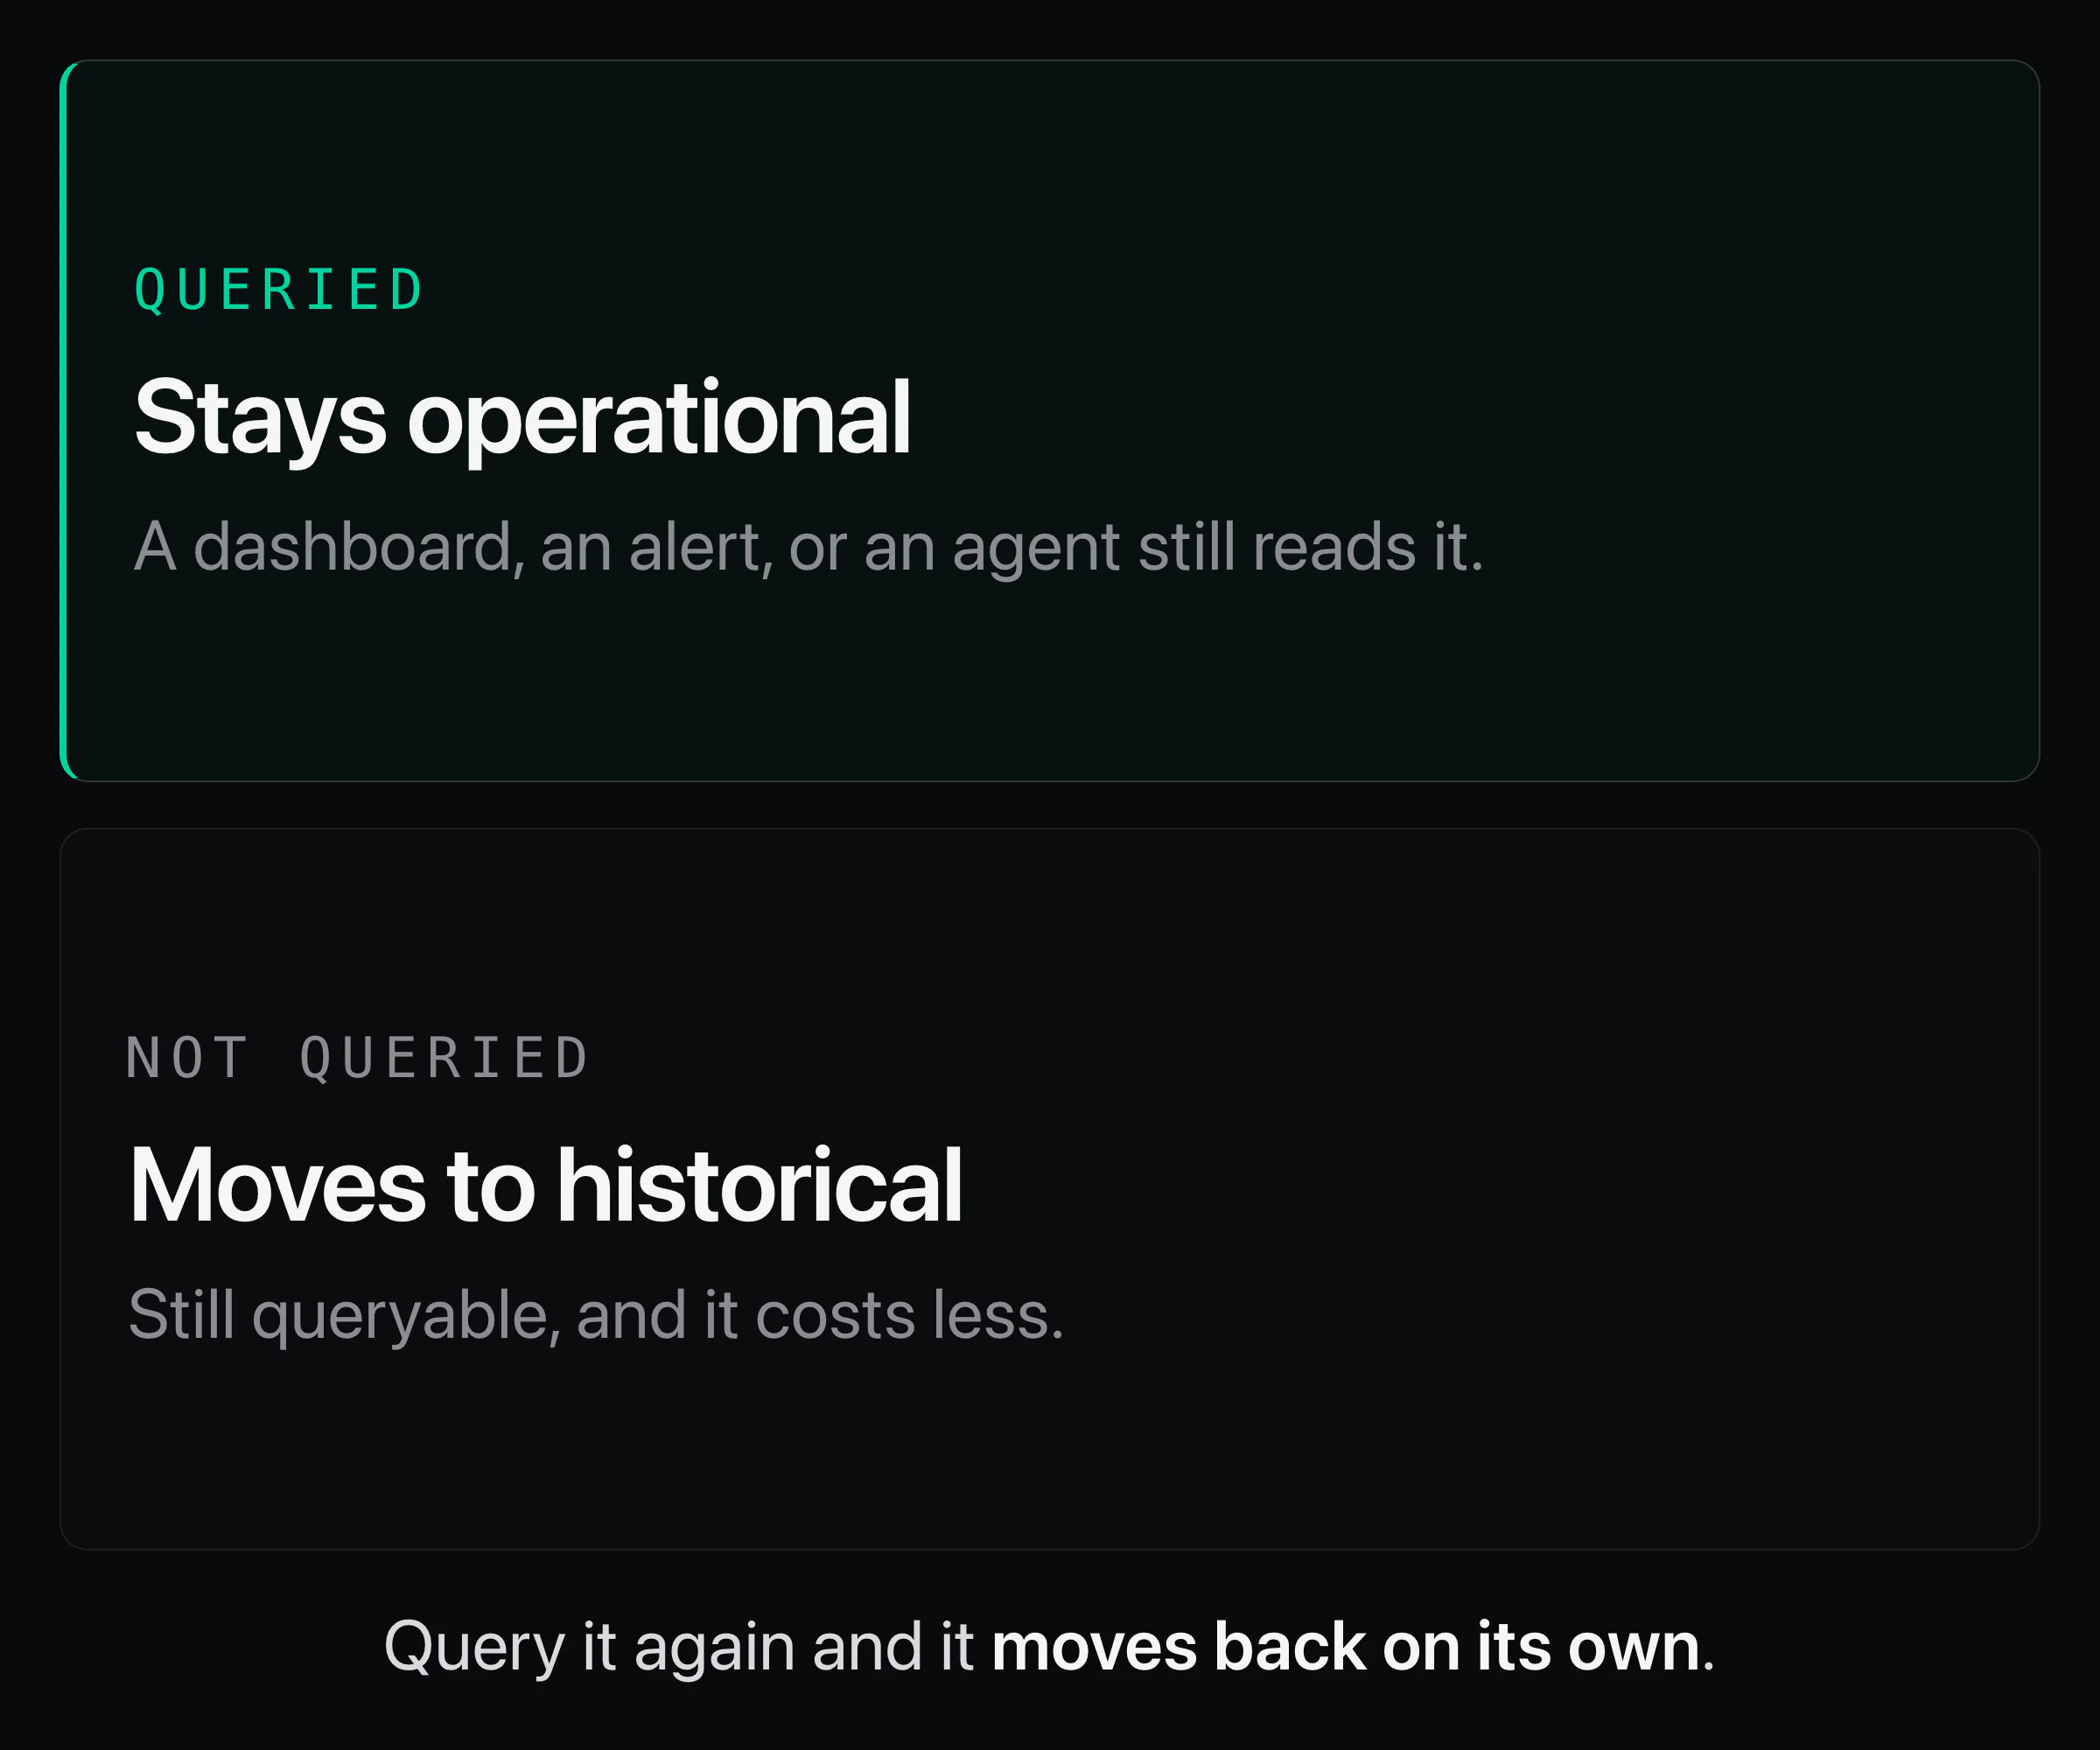
Routing between those tiers does not have to be a static rule you write and maintain. Dynamic TCO classifies metrics by how they are actually used: how often a series is queried, whether it is queried only intermittently, whether it is only ever read as part of a dashboard, whether its queries come back empty, whether it is only touched when something errors. Several of these use cases ship today and more are being added over time.
Because compliance with a rule is derived from your own usage, the routing corrects itself. If you start querying a series regularly, it stops complying with the rule that routed it to the historical tier and graduates back to operational automatically. You enable the rules you want, use the system as you normally would, and watch it optimize its own storage. Across early migrations we have seen this reduce metric footprint and spend by around 40 percent, with the exact figure scaling with how much of a team’s series population is genuinely unqueried.
Server-side deduplication is finally here
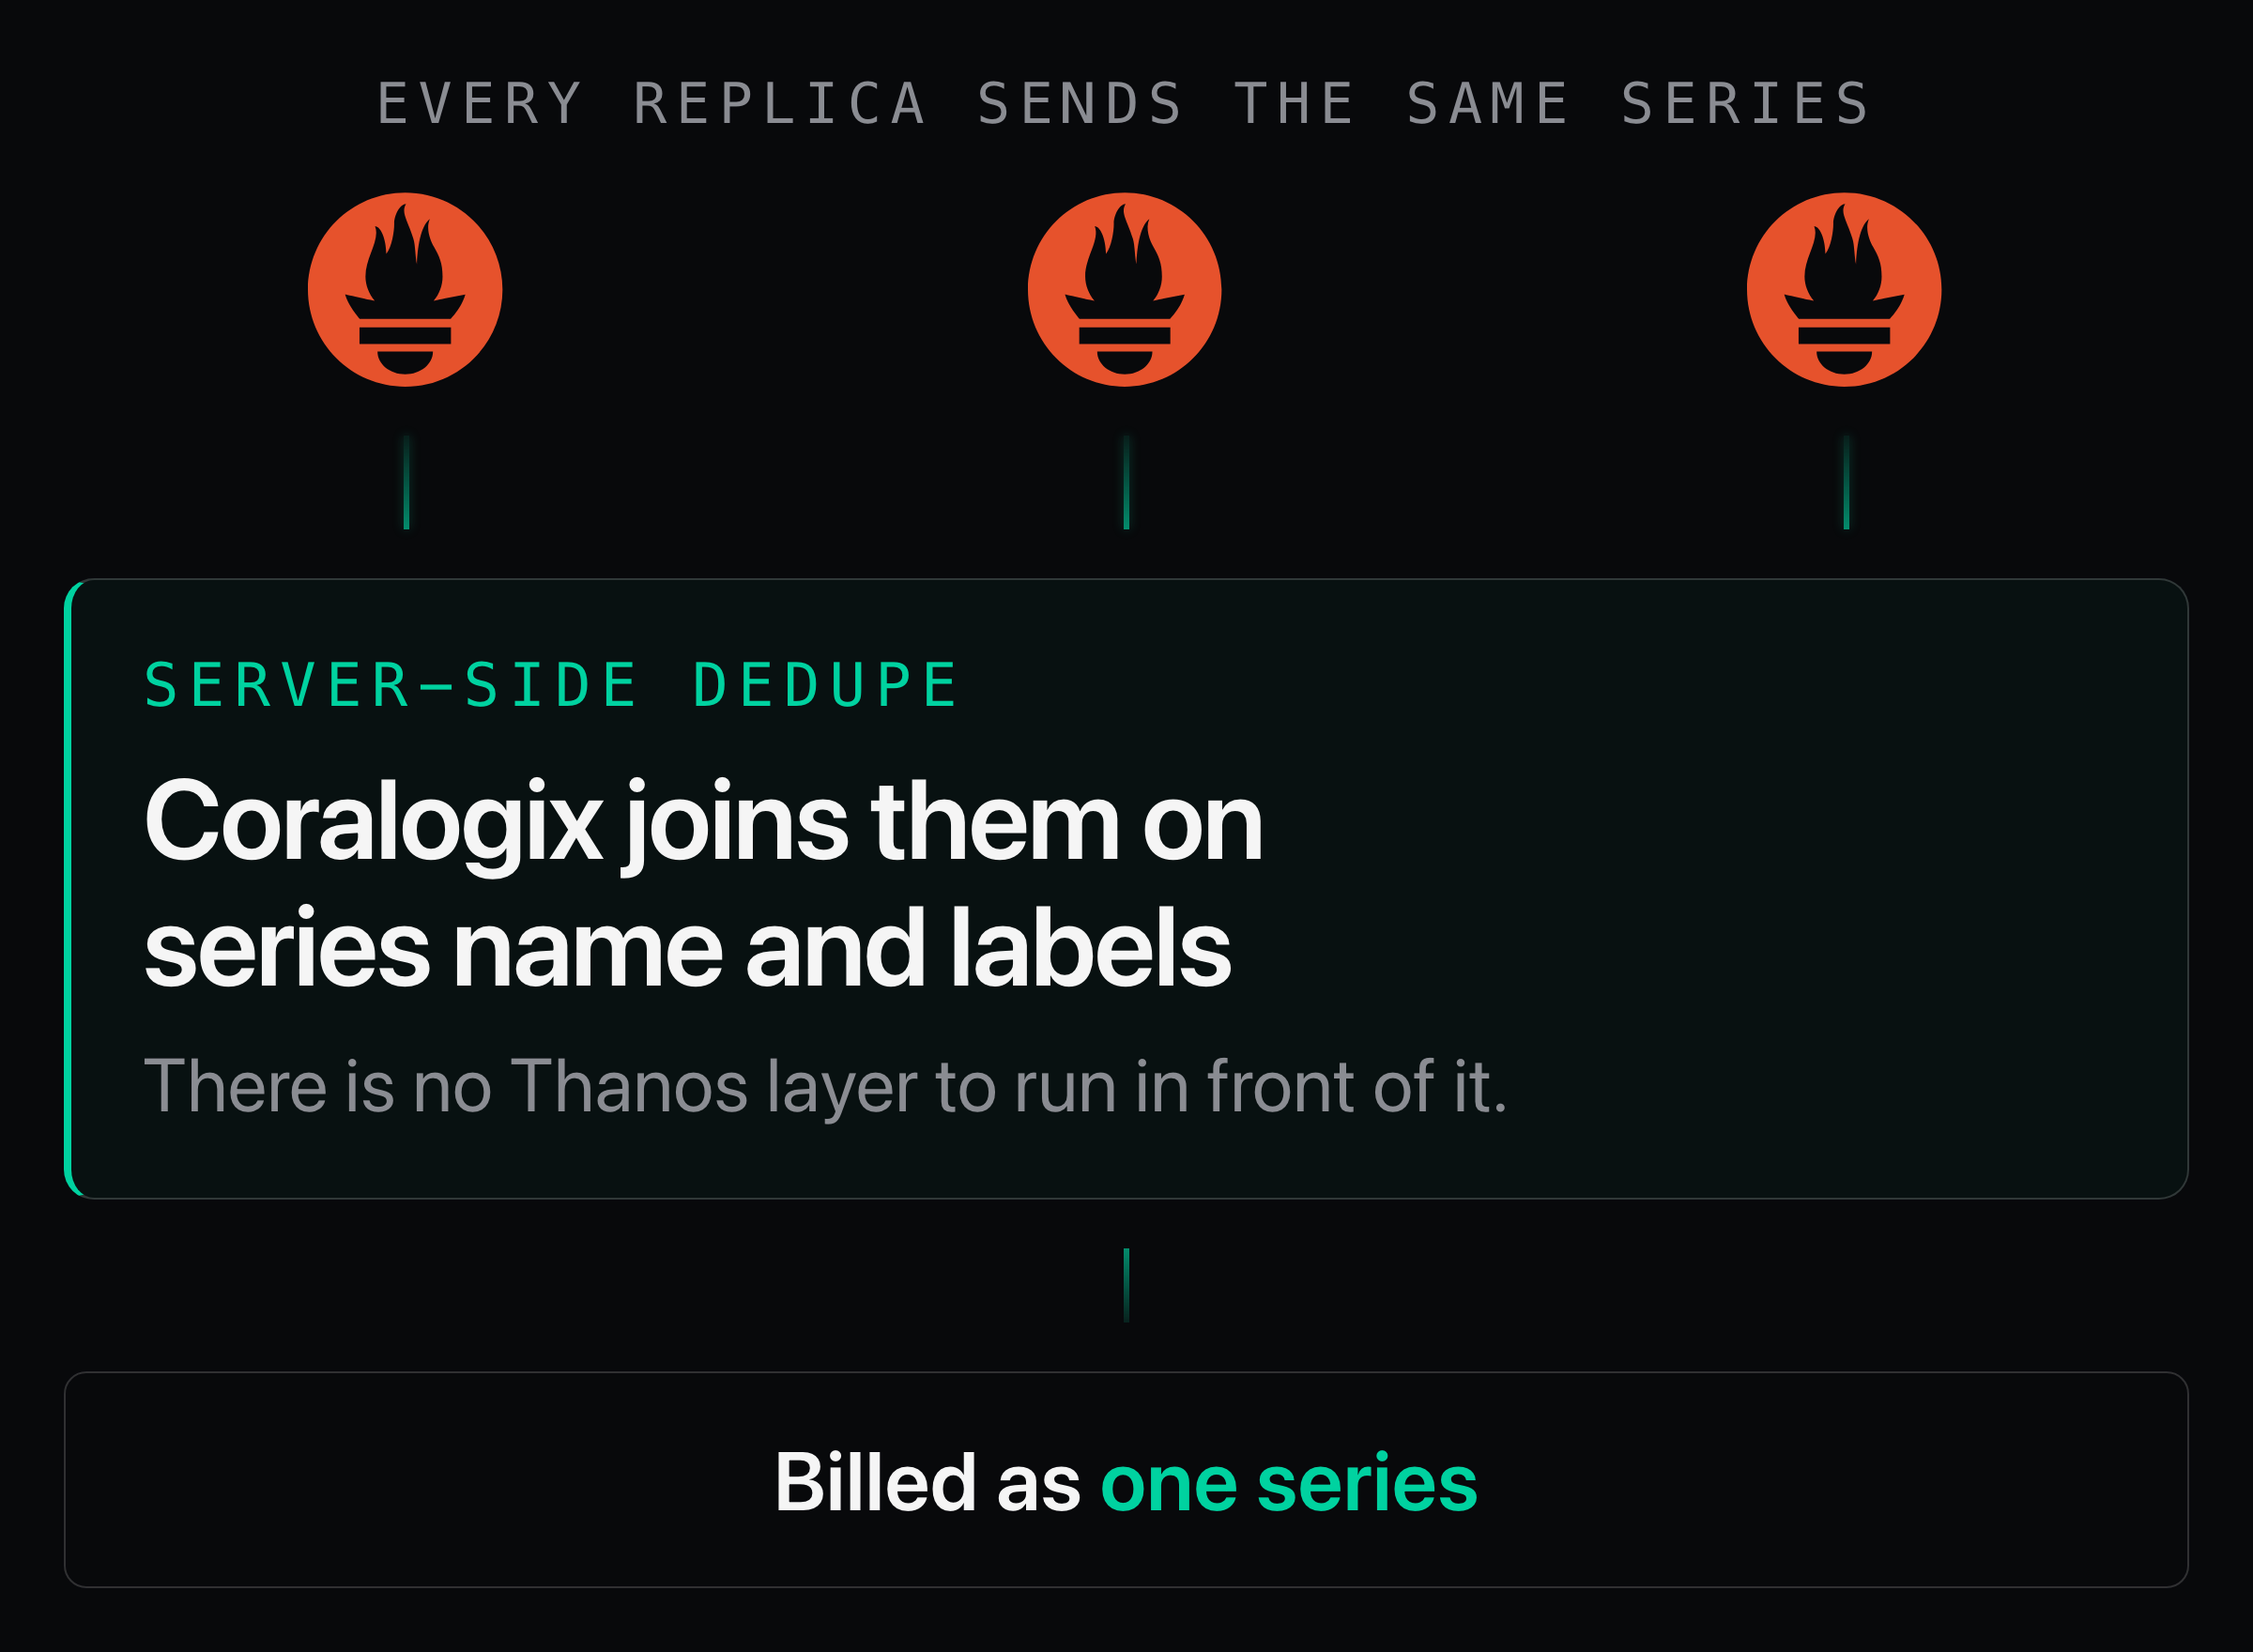
High availability in metrics collection has always carried a tax. You run two or more Prometheus instances so that a scrape failure never blinds you, and every replica sends the same series. So you have a dual collector, a diskless Thanos, or a lightweight forwarder. And suddenly you have 2x the cost or 2x the HA risk to choose from.
We have eliminated this pain. Send it twice; we count it as one.
Triple the fair usage limits
Everything above is an invitation to send more: more labels, higher resolution, every replica, every series you were previously talked into dropping. To make sure the platform meets that volume, every team on the new engine gets triple the fair usage limits out of the box. The published default today is 24 million unique series per metric per day; on the new engine that becomes 72 million. The query-side allowances rise with the same multiplier, which means more compute behind each scan, more series analyzed per query, and wider time ranges before you hit a wall. The high-cardinality use cases that used to require a negotiated exception now fit inside the defaults.
Do I need to change how I integrate?
No. Ingestion is untouched: Prometheus remote-write and the OpenTelemetry Protocol (OTLP) both work exactly as they do today, and existing metrics integrations port over as they are. Dashboards, alerts, and recording rules keep working on the same PromQL. Everything described in this post happens in how the backend processes and meters your data, so the switch is a configuration conversation with your account manager or technical account manager, not an engineering project.
How will this impact my bill?
For typical dimensionality, the new engine costs less than the legacy engine at every resolution, and far less at the resolutions most teams actually want. The comparison below assumes 1,000,000 daily active series at list price, every figure is a daily cost, and the new engine prices assume a 25% Dynamic TCO optimization.
| Resolution | Legacy engine | New engine | Difference |
|---|---|---|---|
| 15s (4 samples/min) | $198 / 132 units | $45 / 30 units | 77% cheaper |
| 30s (2 samples/min) | $99 / 66 units | $45 / 30 units | 55% cheaper |
| 60s (1 sample/min) | $49.50 / 33 units | $45 / 30 units | 9% cheaper |
The new engine does not charge for resolution, so the same bill covers a 60-second scrape and a 15-second one. That is why the saving grows as resolution rises, and why 60 seconds is the narrowest margin in the table. At one sample a minute you are not yet using the headroom the new price is built around.
The 25% in those figures comes from Dynamic TCO, and it is the reason the 60-second row still lands in your favor. It meters on what your data is worth to you rather than on how much of it arrived, moving series nobody queries to the historical tier and leaving the series your dashboards and alerts read at full fidelity. Pricing that keys on data sent penalizes you for sending. Pricing that keys on usage value does not.
These figures are list price at $1.50 per unit, with the legacy engine calculated at 1,000 time series per GB. The 25% Dynamic TCO optimization is illustrative rather than guaranteed, because it scales with your usage pattern.
Send it all
For most teams the migration starts as a pricing story, and the table above is reason enough. The longer arc is about who reads your metrics next. Agents investigating production issues need the labels you used to strip, the resolution you used to coarsen, and the history you used to delete, and this engine makes all three the default rather than the exception. Talk to your account manager or technical account manager about migrating, and if you are new to Coralogix, the documentation is the place to start.
The richest metric data you can produce is now the cheapest it has ever been to keep.