
The Coralogix blog
Expert insights, bold ideas, and company news
All Articles
- All
- Alerts
- OpenTelemetry
- Olly
- Uncategorized
- Software development
- AI
- Cases
- AWS
- Product
- CDN monitoring
- CloudWatch
- Logging
- Real user monitoring
- SIEM
- Data
- Gaming
- APM
- Explore
- Cloud
- Fintech
- FinOps
- Data Engine
- Kubernetes
- Microservices
- Compliance
- Dataspaces & Datasets
- Observability
- Metrics
- Security advisory
- Tracing
- CI/CD
- Java
- IaC
- Elasticsearch
- Migrations
- DevOps & IT operations
- Troubleshooting
- Service Management
- Company news
- Case studies
- MDR
- Security
- Performance
- Extensions
- Tutorials
- Audit logs
- Infrastructure monitoring
- Logs
- Application performance monitoring
- SRE
- Monitoring
- Log analytics
- DataPrime

The cost of knowledge
In the world of observability, “cardinality” has become a heavy word. It is a ghost used to justify skyrocketing bills or degraded query performance. When cardinality rises, the...
How Kotak811 Revolutionized Digital Banking Observability with Coralogix
Kotak811, the digital-first engine of Kotak Mahindra Bank, is a banking platform serving over 23...
Mastering the Diagnostic pivot from Health Policy to Pod
In the world of modern microservices, scale is a necessary challenge. Enterprise service inventories start...

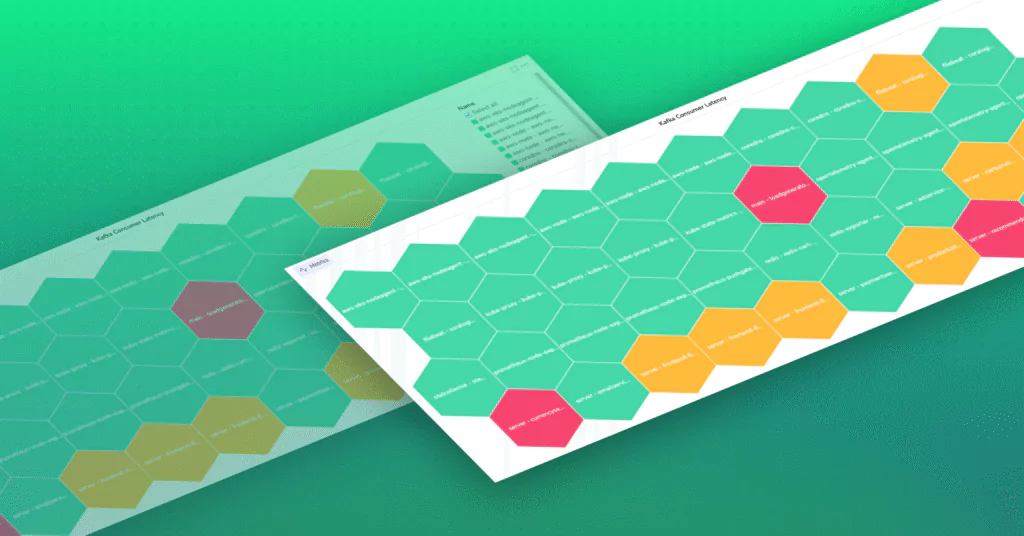
New features: Introducing Metrics Usage and Query Usage analyzers
As teams grow and telemetry scales, it becomes harder to keep track of which metrics...
Finding Your Way: Using Metrics to Explore Organizational Architecture
Imagine being the new developer in a bustling tech company. Everyone is rushing to meet...
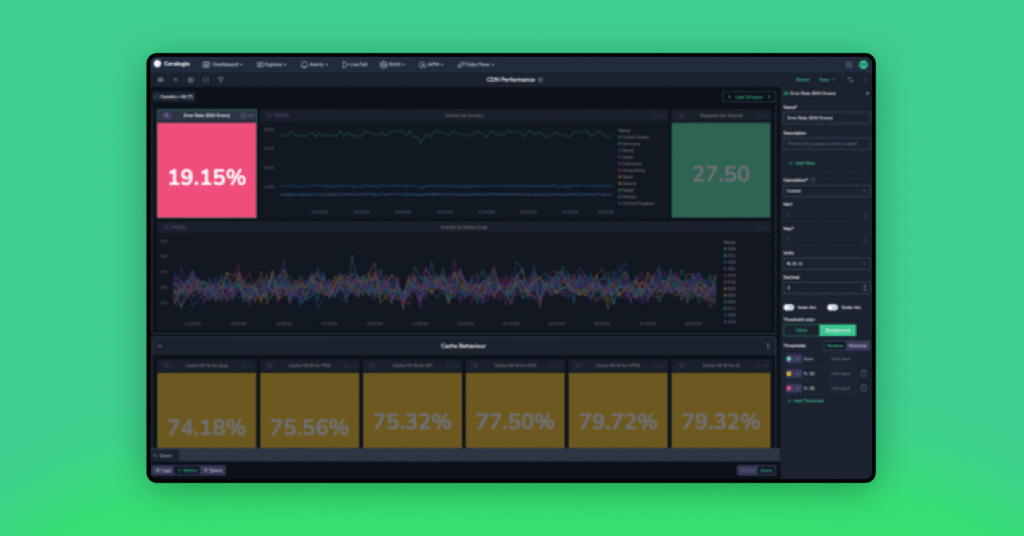
Is your CDN really at the edge?
tldr: This post discusses how to measure CDN request locality without indexing a single log. The function of a CDN is to bring cacheable data, like pictures &...
AWS Elemental MediaTailor – measuring transcoding performance with Coralogix
AWS Elemental MediaTailor provides a wealth of information via metrics, but one key feature that...

You don’t need ALL those metrics!
Metrics are key to monitoring system health and performance but you probably are ingesting far more metrics than you will ever need or use. The issue is that...

DORA Metrics for $0.02 a day
There are many solutions on the market that are promising insight into the four key metrics. Alas, these solutions often come with a significant price tag. Coralogix doesn’t...

What If You Could Pull Metrics Out of Your Events?
As data keeps growing at incredible rates, it’s becoming increasingly difficult to store and monitor at a reasonable cost leaving you to cherry-pick which data to store. As...
Data Quality Metrics: 5 Tips to Optimize Yours
Amid a big data boom, more and more information is being generated from various sources at staggering rates. But without the proper metrics for your data, businesses with...
4 Observability Metrics Examples to Overcome Big Challenges
Having a strong full-stack observability has become increasingly crucial in modern IT environments, as organizations...