

Why we're publishing our DORA metrics
For years we've said our engineering team is one of the best in the business. Now the numbers are public, updated daily, with a live log of what we've learned from coding with AI.
Chris Cooney3 min read
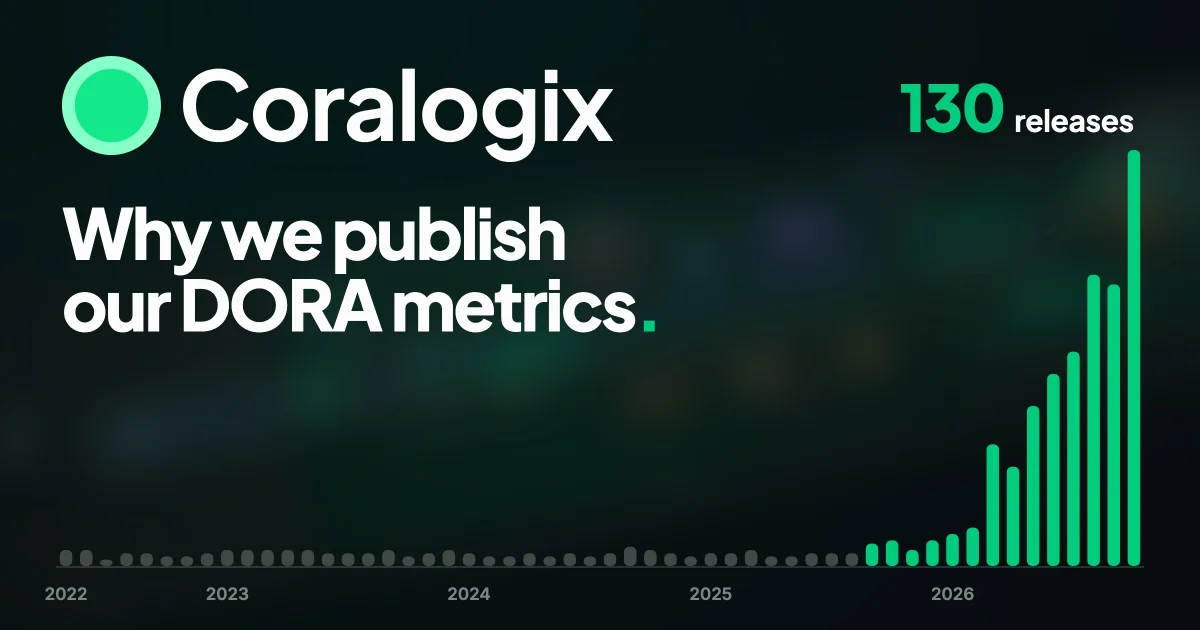
For years we've told customers, analysts and anyone who would listen that the Coralogix engineering team is something special. Saying it is easy, so we stopped saying it and started publishing it. Our Engineering Benchmarks put our live DORA metrics, our release history and what we've learned from coding with AI in public, and they update every day.
Why DORA metrics
Every software company says it ships fast. DORA metrics are how you check: the industry's shared measure of how often a team deploys, how long a change takes to reach production, how often a change fails, how quickly service comes back when one does, and how much work gets redone. We chose them because they are hard to flatter and easy to compare.
Over the 30 days to 16 November 2026, Coralogix deployed to production 125 times a day, with a 32-minute lead time for changes, a 0.1% change failure rate and an 18-minute time to restore.

From 4 feature releases a month to 130
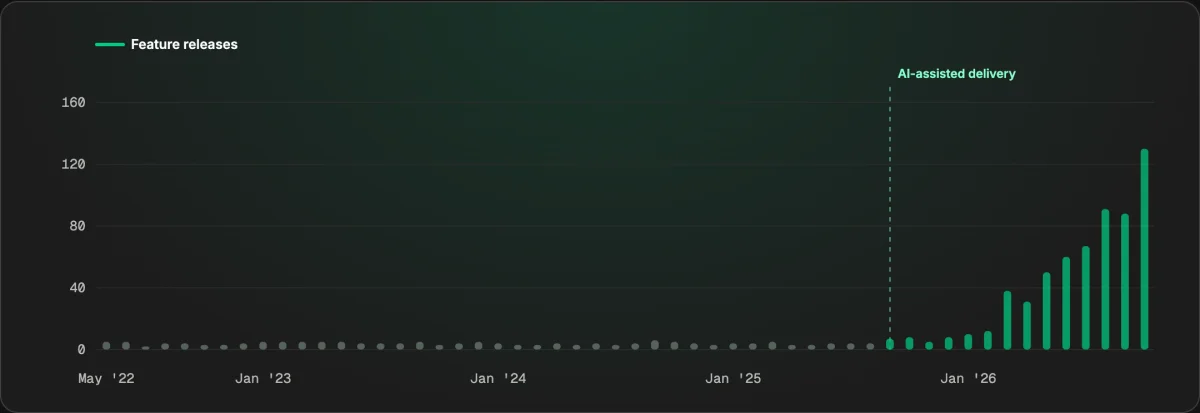
From May 2022 to August 2025, Coralogix shipped about four feature releases a month. AI-assisted delivery began in September 2025, and in October 2026 we shipped 130, 33 times the old rate.
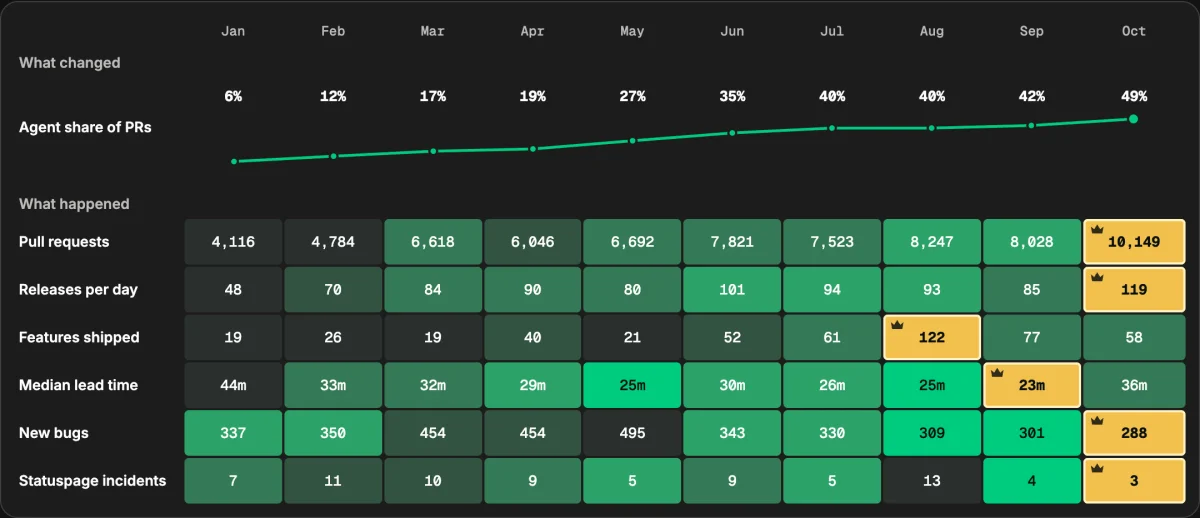
Shipping faster didn't cost us stability. Between January and October 2026, production releases per day rose from 48 to 119, developer pull requests from 4,116 to 10,149 and features shipped from 19 to 58. Over the same months, new bugs fell from 337 to 288, Statuspage incidents from 7 to 3, and median lead time from 44 minutes to 36.
What AI coding taught us, in a live log
Hundreds of people at Coralogix use Claude Code, Cursor, Codex and Copilot every day, and their telemetry lands in Coralogix, so we can measure what every change to our process does. Coding agents now make 49% of our pull requests, up from 6% in January.
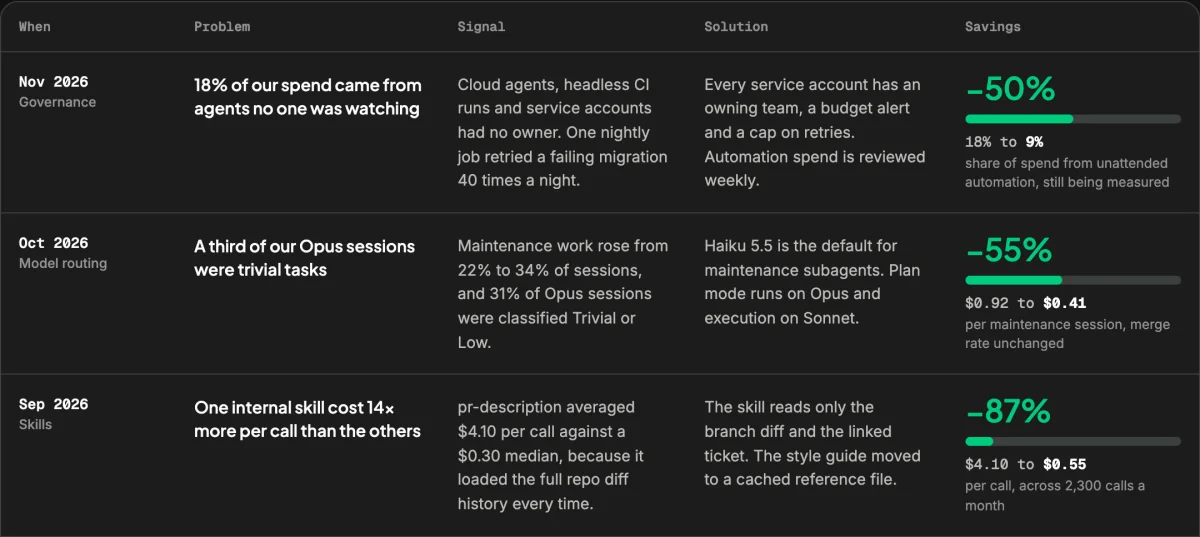
Along the way we found new ways of working that we think other engineering teams can use, so we publish them. The benchmark includes a learnings log that we add to every time we find an approach with a meaningful effect on AI coding. Each entry records the problem, the signal that exposed it, what we changed and what it saved:
- Model routing. Haiku 5.5 became the default for maintenance subagents, with plan mode on Opus and execution on Sonnet. A maintenance session went from $0.92 to $0.41, with the merge rate unchanged.
- Skills. Our pr-description skill read only the branch diff and the linked ticket instead of the full repository history. Each call went from $4.10 to $0.55, across 2,300 calls a month.
- Governance. Every service account got an owning team, a budget alert and a cap on retries. The share of spend from unattended automation fell from 18% to 9%.
AI cost per merged pull request is down 44% since the first month, to $11.80.
Explore the Engineering Benchmarks
The Engineering Benchmarks update daily. Check the DORA panel, see how pull requests, lead time and incidents moved as agent adoption grew, read the full learnings log, and come back next month to see what we've added.
If you want the same view of your own engineering team and coding agents, start a free trial or talk to an expert.
Keep reading
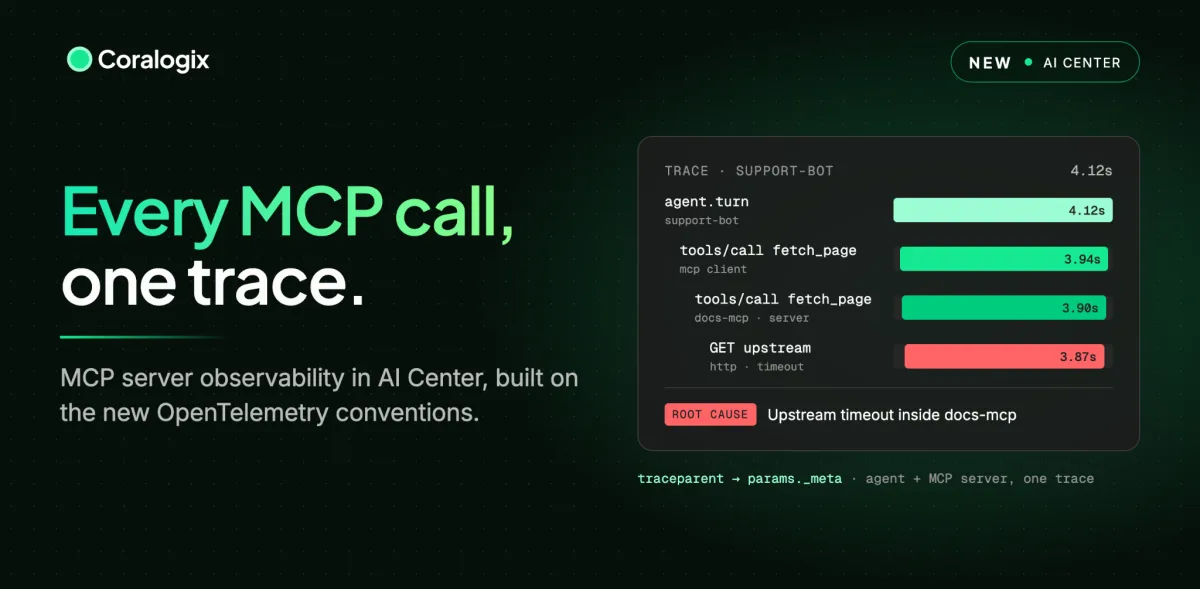 AIIntroducing MCP server observability in CoralogixOpenTelemetry now has semantic conventions for MCP. The new MCP Servers page in Coralogix AI Center turns them into calls, clients, tools, errors and latency you can query, alert on and follow through one trace.
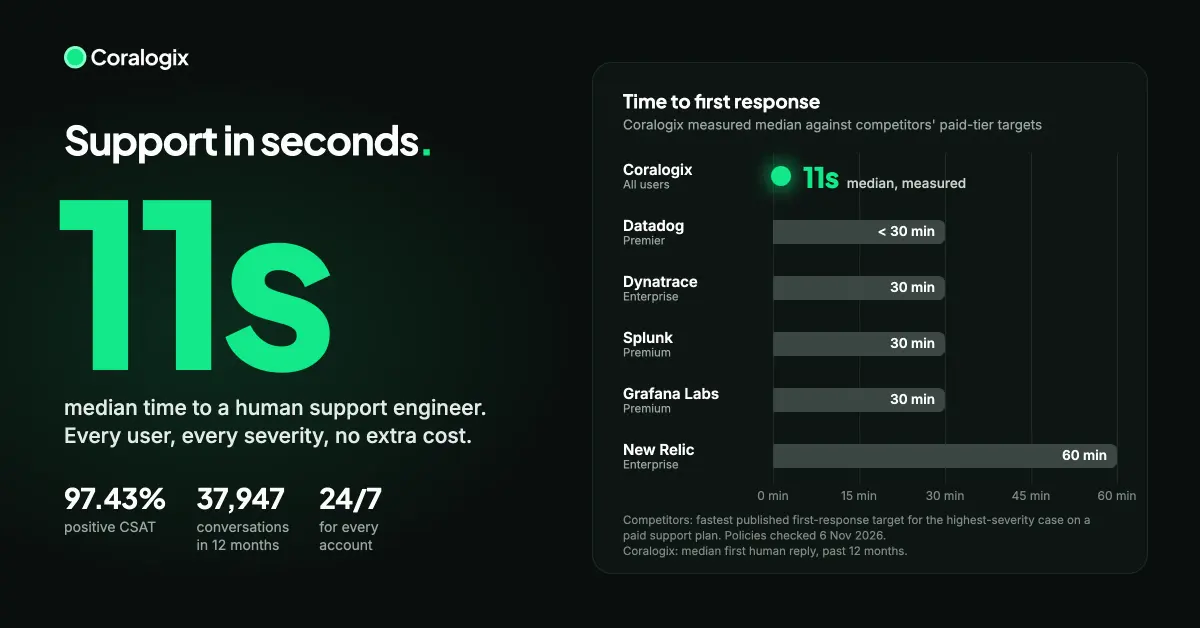 Company newsA Coralogix support engineer replies in 11 secondsCoralogix support reaches a human engineer in a median 11 seconds, with 97.43% positive CSAT across 37,947 conversations. See the live monthly benchmark.
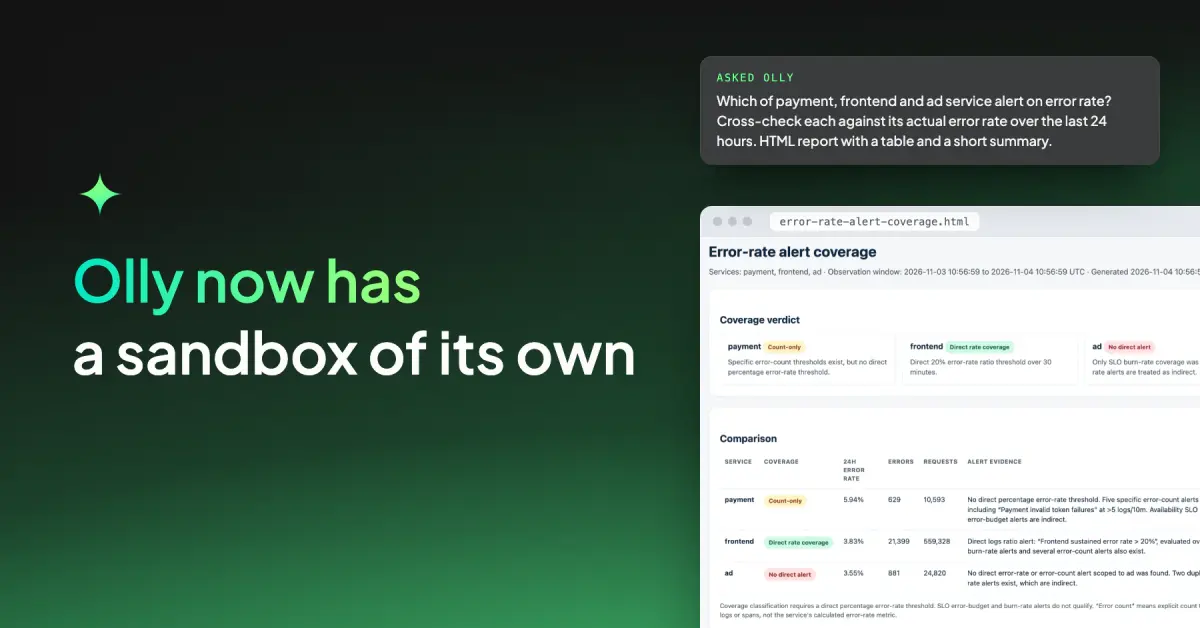 AIWith a sandbox workspace of its own, Olly answers bigger questionsOlly now runs every conversation in its own sandbox with Python, jq and awk, so it can audit alerts, correlate PromQL and DataPrime, and write reports.