Explore for Spans: One View with Infinite Depth

A unified investigation surface designed to end context-switching and reduce MTTR.
I. The Crisis of Investigative Latency
It’s 20 minutes into a P0 incident, and you have already switched between four different tools, re-authenticated twice, and translated queries across three incompatible syntax languages. The root cause you are searching for. Well, that is still out there somewhere.
The reality of investigative latency is that most engineering teams face navigation problems, not data problems. During high-pressure incidents, teams lose cognitive momentum due to context switching between disconnected telemetry silos. This fragmentation forces a mental reset that pushes exhausted engineers toward whichever dataset is easiest to query (usually logs), even when distributed traces contain the fastest path to an answer.
Explore for Spans establishes a single operational plane for distributed tracing. Engineers can filter, inspect, and pivot across spans, traces, flows, and logs within a single interface, eliminating rewritten queries and broken context. Removing this friction becomes an operational priority. To maintain velocity, the environment integrates native Error and Duration filters, instantly stripping away system noise to keep the investigation moving.
II. The Unified Operational Surface
Spans are no longer a specialist dataset. Modern observability requires a unified entry point where spans inherit the same workspace structure, query logic, and multi-tab workflows used for logs. Standardizing the interface eliminates the translation layer previously required to switch between telemetry types. If a team can query a log, they can query a span. This removes the context switch that typically stalls investigative momentum.
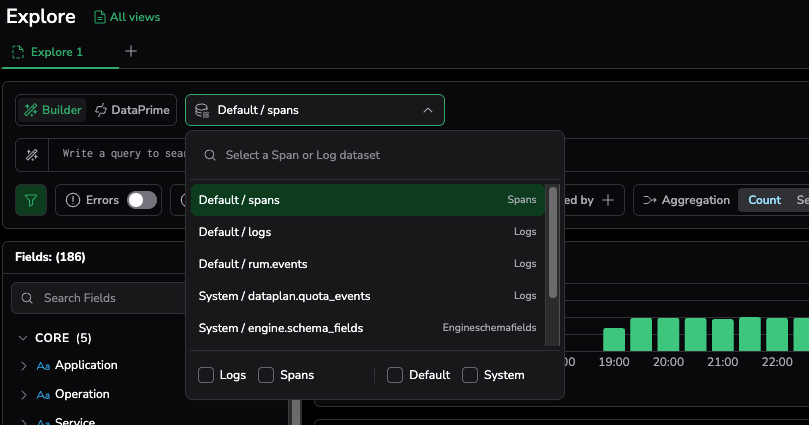
This consistent workspace ensures the learning curve for distributed tracing is a straight line. Engineers discover span metadata via the same search parameters and time pickers used across the platform, helping engineers orient themselves within seconds of an investigation. Instead of translating investigative intent into a foreign UI, teams maintain focus on the problem at hand.
Precision Filtering: Error, Duration, and Trace Relationships
Investigation success relies on narrowing the search space without rewriting queries or switching tools.
- Error Isolation: Click the error toggle to instantly surface only traces containing a failing span, bypassing manual error-string queries to jump straight to the breach.
- Latency Outliers: Filter by explicit millisecond thresholds to isolate performance regressions, outlier operations, and downstream bottlenecks.
- Relational Filters: Filter spans by their exact placement and dependency within a trace rather than static field values. Instead of writing complex query logic, engineers instantly isolate root spans or identify entry-point traffic to pinpoint exactly which parent service triggered a downstream failure.
III. The Persistence of Investigative Context
True observability requires fluid movement between system-wide patterns and granular request instances. Traditionally, zooming in or out of data forces an “investigative reset,” which means engineers must rebuild filters, reselect services, and re-interpret results in a disconnected layout. This fragmentation breaks the state of flow. Explore reduces these boundaries, helping keep query context, time ranges, and filters consistent as you navigate between telemetry layers.
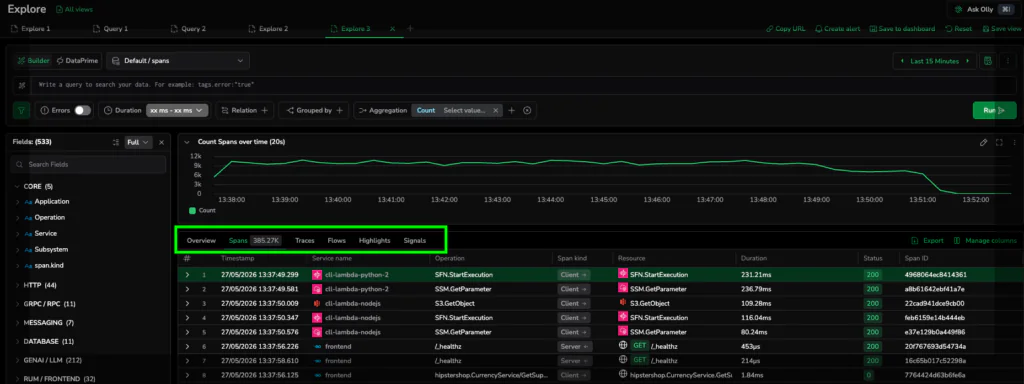
- Overview Tab: Visualize query results using Group By and Aggregation to quickly spot architectural outliers and performance shifts.
- Spans Tab: Inspect individual operations, mapping specific services, endpoints, and high-cardinality attributes.
- Traces Tab: Group filtered spans into request-level summaries to provide an end-to-end trace-centric layout.
- Flows Tab: Visualize service-to-service topology paths for the selected request or trace execution.
- Highlights Tab: Automatically analyze anomalous field distributions to identify the structural drivers of performance regressions.
- Signals Tab: Pivot into multi-dimensional performance tracking via nested Outliers and RED Metrics dashboards to monitor systemic health alongside raw data distributions.
Granularity as a Dial, Not a Doorway
Investigations typically begin with a pattern like a volume spike, failure increase, or latency regression. In Explore, granularity is a dial rather than a doorway, allowing for seamless transitions without a context switch:
- Pattern Isolation: Start with a broad system scan, then tighten the query using native Request, Error, and Duration filters to isolate relevant operations.
- Derived Trace Summaries: Switch from the individual Spans to Traces tab to see a request-level summary of the filtered data. Since query context is preserved, you can move from millions of spans to a manageable set of explainable requests instantly.
- Connected Execution Paths: Switch to the Flows tab to follow a request’s journey across services, and maintain continuity on a single surface.
Keeping your filters and context intact as you switch views means you never have to rebuild your query or restart an investigation from scratch.
IV. Telemetry Convergence: Moving from Evidence to Resolution
Resolution occurs when logs and spans converge into a single investigative language. Traditionally, searching for evidence across different datasets is a tedious, manual process that inflates MTTR. Explore makes this connection native, transforming the drill-down from a data-gathering exercise into a definitive path to root cause.
Two-Way Correlation: The End of copy/paste
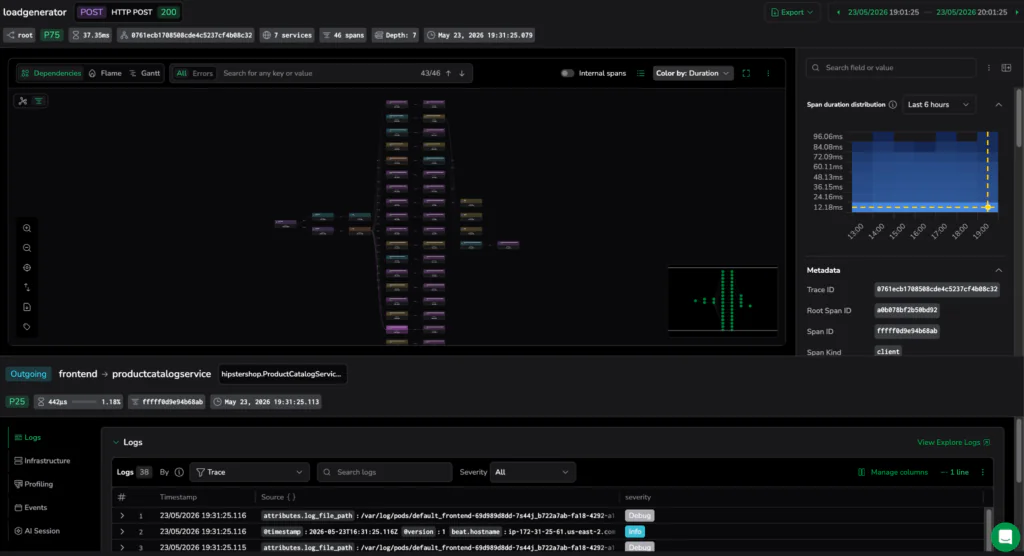
Investigative friction often stems from the manual join that engineers must perform between traces and logs. Embedding logs directly beneath the trace map inside the drill-down drawer, enables a seamless, bidirectional workflow:
- Bidirectional Discovery: Jump from a suspicious span to its relevant log lines, or pivot from a log entry back into the exact location within the distributed trace.
- In-Context Resolution: Confirm the root cause without leaving the investigative workspace, eliminating the copy-pasting of Trace IDs that typically stalls incident response.
- Unified Precision: Whether utilizing the guided UI Query Builder or executing complex relational logic via DataPrime, the workflow remains identical. In this environment, “expert mode” is a deeper layer of the same infrastructure, not a different universe.
The Complete Context Plane
The investigative capacity of the drill-down drawer goes beyond basic logs. The workspace automatically aggregates and scopes related telemetry types to the exact context and time window of your selected span.
Without leaving the interface, teams instantly:
- Isolate underlying host resource constraints or CPU/memory bottlenecks driving application latency.
- Correlate specific execution exceptions with AI-assisted diagnostics to trace internal state changes instantly.
Instead of hunting across five separate tools, the evidence is localized automatically, removing the manual data gathering that prolongs high-pressure incidents.
V. Adaptive Visualization: Intent-Based Monitoring
Investigative momentum relies on a UI that adapts to the depth of the inquiry. During a live incident, building custom dashboards to interpret data is an operational failure. Explore automatically reconfigures its visualization layer based on your active query parameters, moving from static charts to dynamic analytics instantly.
To deliver on this, the Explore interface introduces three dedicated workspace tabs tailored to the velocity of your inquiry:
The Highlights Tab: Automatically surfaces critical anomalies, structural outliers, and high-signal trace variants the moment you execute a search, giving you an immediate starting point without manual hunting.
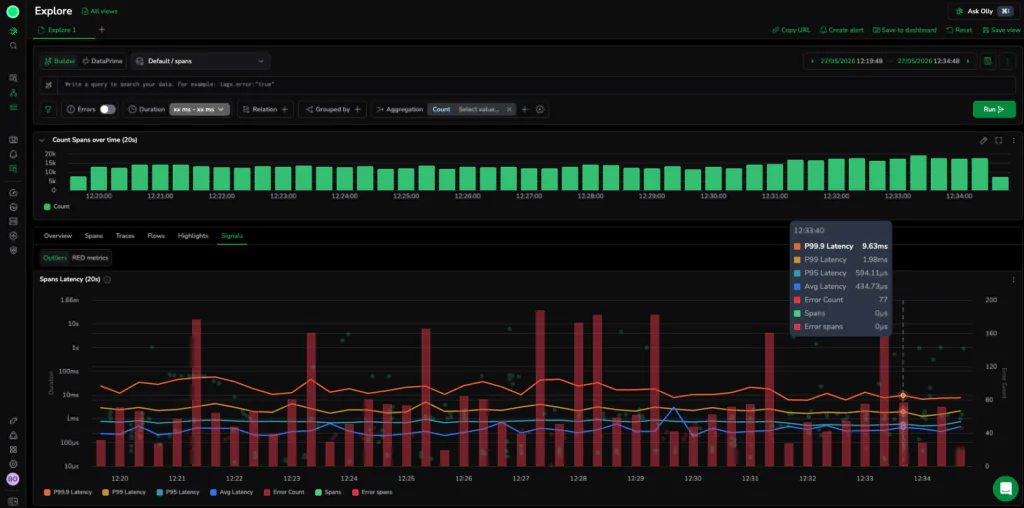
The Signals Tab: Consolidates advanced operational telemetry into an adaptive analytics pane, allowing teams to toggle instantly between two high-signal sub-views:
RED Metrics View: Standardizes on Request rate, Errors, and Duration (RED) to instantly identify systemic latency shifts and volume spikes across your services.
Outliers View: Plots critical latency percentiles ($P_{99.9}$, $P_{99}$, $P_{95}$, and Average) alongside real-time error count histogram distributions on a single coordinate system, ensuring teams never lose sight of macro-architectural trends while diving deep into micro span details.
The Strategic Shift: A Span-First Architecture
Moving to a unified investigation surface is an architectural foundation for the future of telemetry. Establishing a span-first workflow ensures that as system complexity grows, the investigation remains continuous. Utilizing derived modes like Traces and Flows enables execution paths through a request’s entire journey without the friction of a tool-based context switch.
The industry has moved beyond the era of collecting telemetry silos. The requirement now is an investigative plan that preserves the shape of the question from the first pattern to the final root cause.
Stop acting as human middleware between your logs and traces. 20 minutes into your next critical incident, you shouldn’t be fighting your tooling or copying trace IDs across disconnected surfaces. Standardize your debugging workflow on an infrastructure that keeps your context locked and your momentum intact.
Eliminate Investigative Latency — Sign Up for a Free Trial
For a deep dive into distributed trace investigation with Explore Spans, read our New Explore blog here.