Pushing metric concurrency, cardinality, compute and retention limits with $1000 of infrastructure
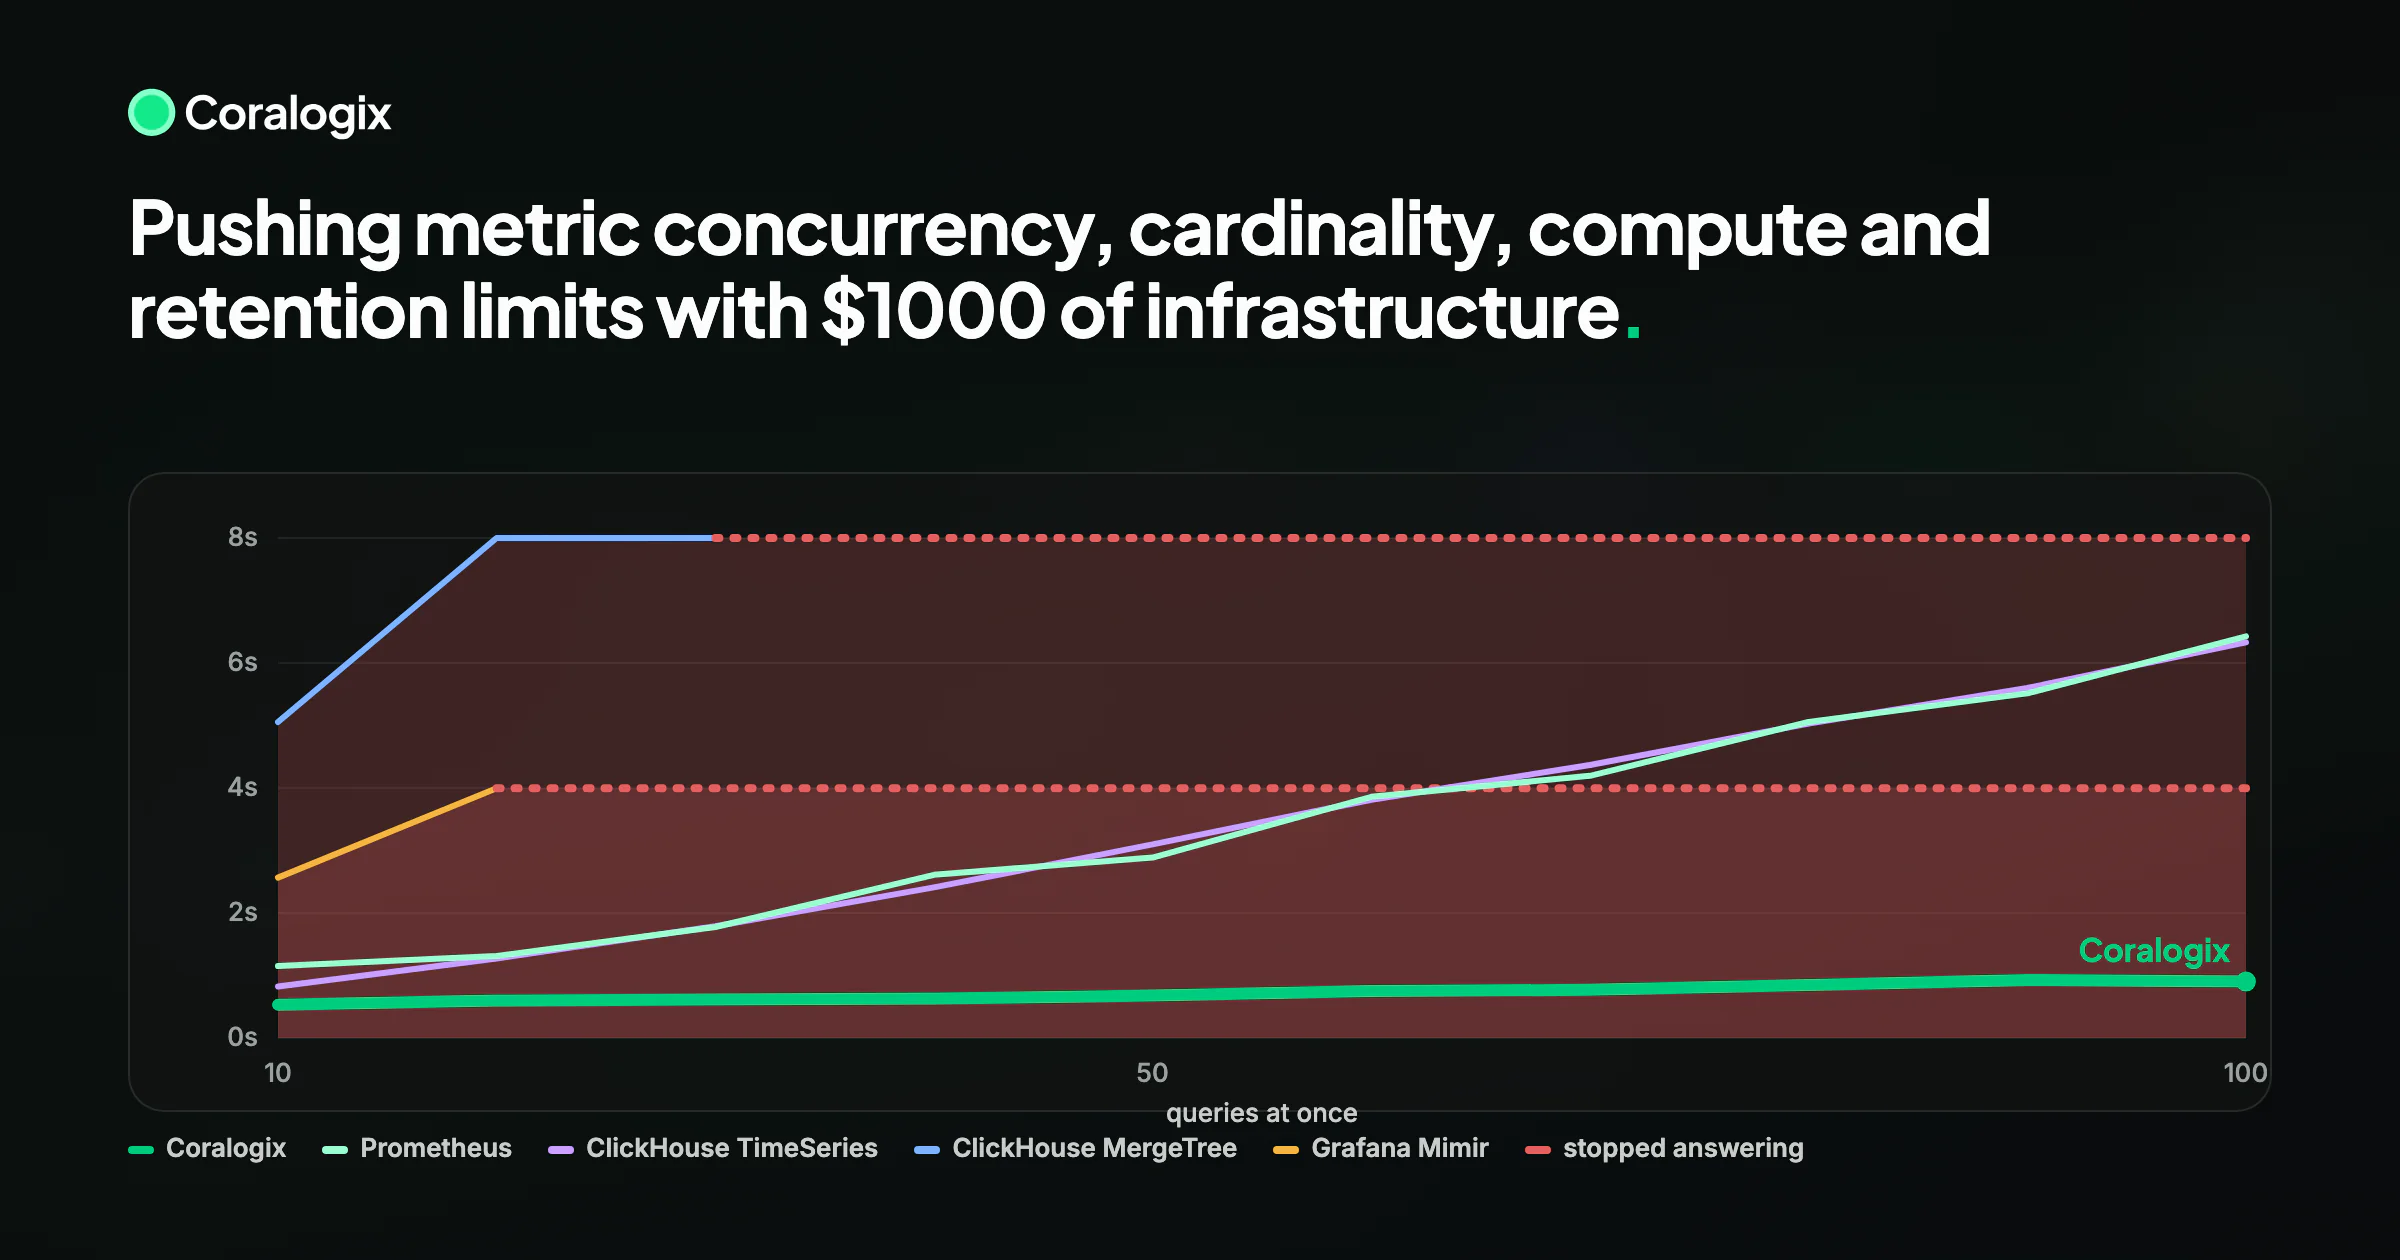

We gave five metrics backends the same budget, the same week of data and the same ten queries, then ran those queries at rising concurrency. At one query at a time, the open source engines looked strong. Under concurrency, two of them stopped answering, and the rest slowed down by an order of magnitude.
The setup
We tested Coralogix, Prometheus, Grafana Mimir and ClickHouse. ClickHouse ran twice, once on its MergeTree engine and once on its native TimeSeries engine. Every platform used stock, out of the box configuration.
Every backend held the same data: 1.8 million active series at one minute resolution, one week of history, about 18.1 billion samples. We ran a ten query PromQL ladder against it, from a single pinned series read to a multi window burn rate alert, at cardinalities from 100,000 to 1 million series and concurrencies from 10 to 100 queries at once. For each combination we recorded median latency and error rate.
How we ensured parity across SaaS and open source
Coralogix is billed on ingestion. The open source tools are billed on the infrastructure you run them on. To compare them on even terms, both sides need the same budget.
We priced, at list price, what it costs to ingest this volume of metrics into Coralogix: about $1,180 a month. That figure became the infrastructure budget for each open source tool. Prometheus and ClickHouse each ran on a single node within it, and Grafana Mimir on a nine node cluster. So every deployment cost roughly the same, which is the comparison a team actually faces: a SaaS ingestion bill against an infrastructure bill.
The open source engines started strong
At low concurrency, Prometheus performed well. Its latency was low and changed little between low and high cardinality. ClickHouse on MergeTree was faster still on the heavier aggregations, returning rate by service at a million series in about a quarter of a second. A benchmark that stopped there would have put the open source engines ahead.
They looked strong because one query at a time is the easiest case. Nothing else competes for CPU, cache or disk. Production does not run that way.
The impact of concurrency
A production backend answers many queries at once. One dashboard load fires dozens, a fleet of dashboards keeps the backend busy, and alerting rules and coding agents add more.
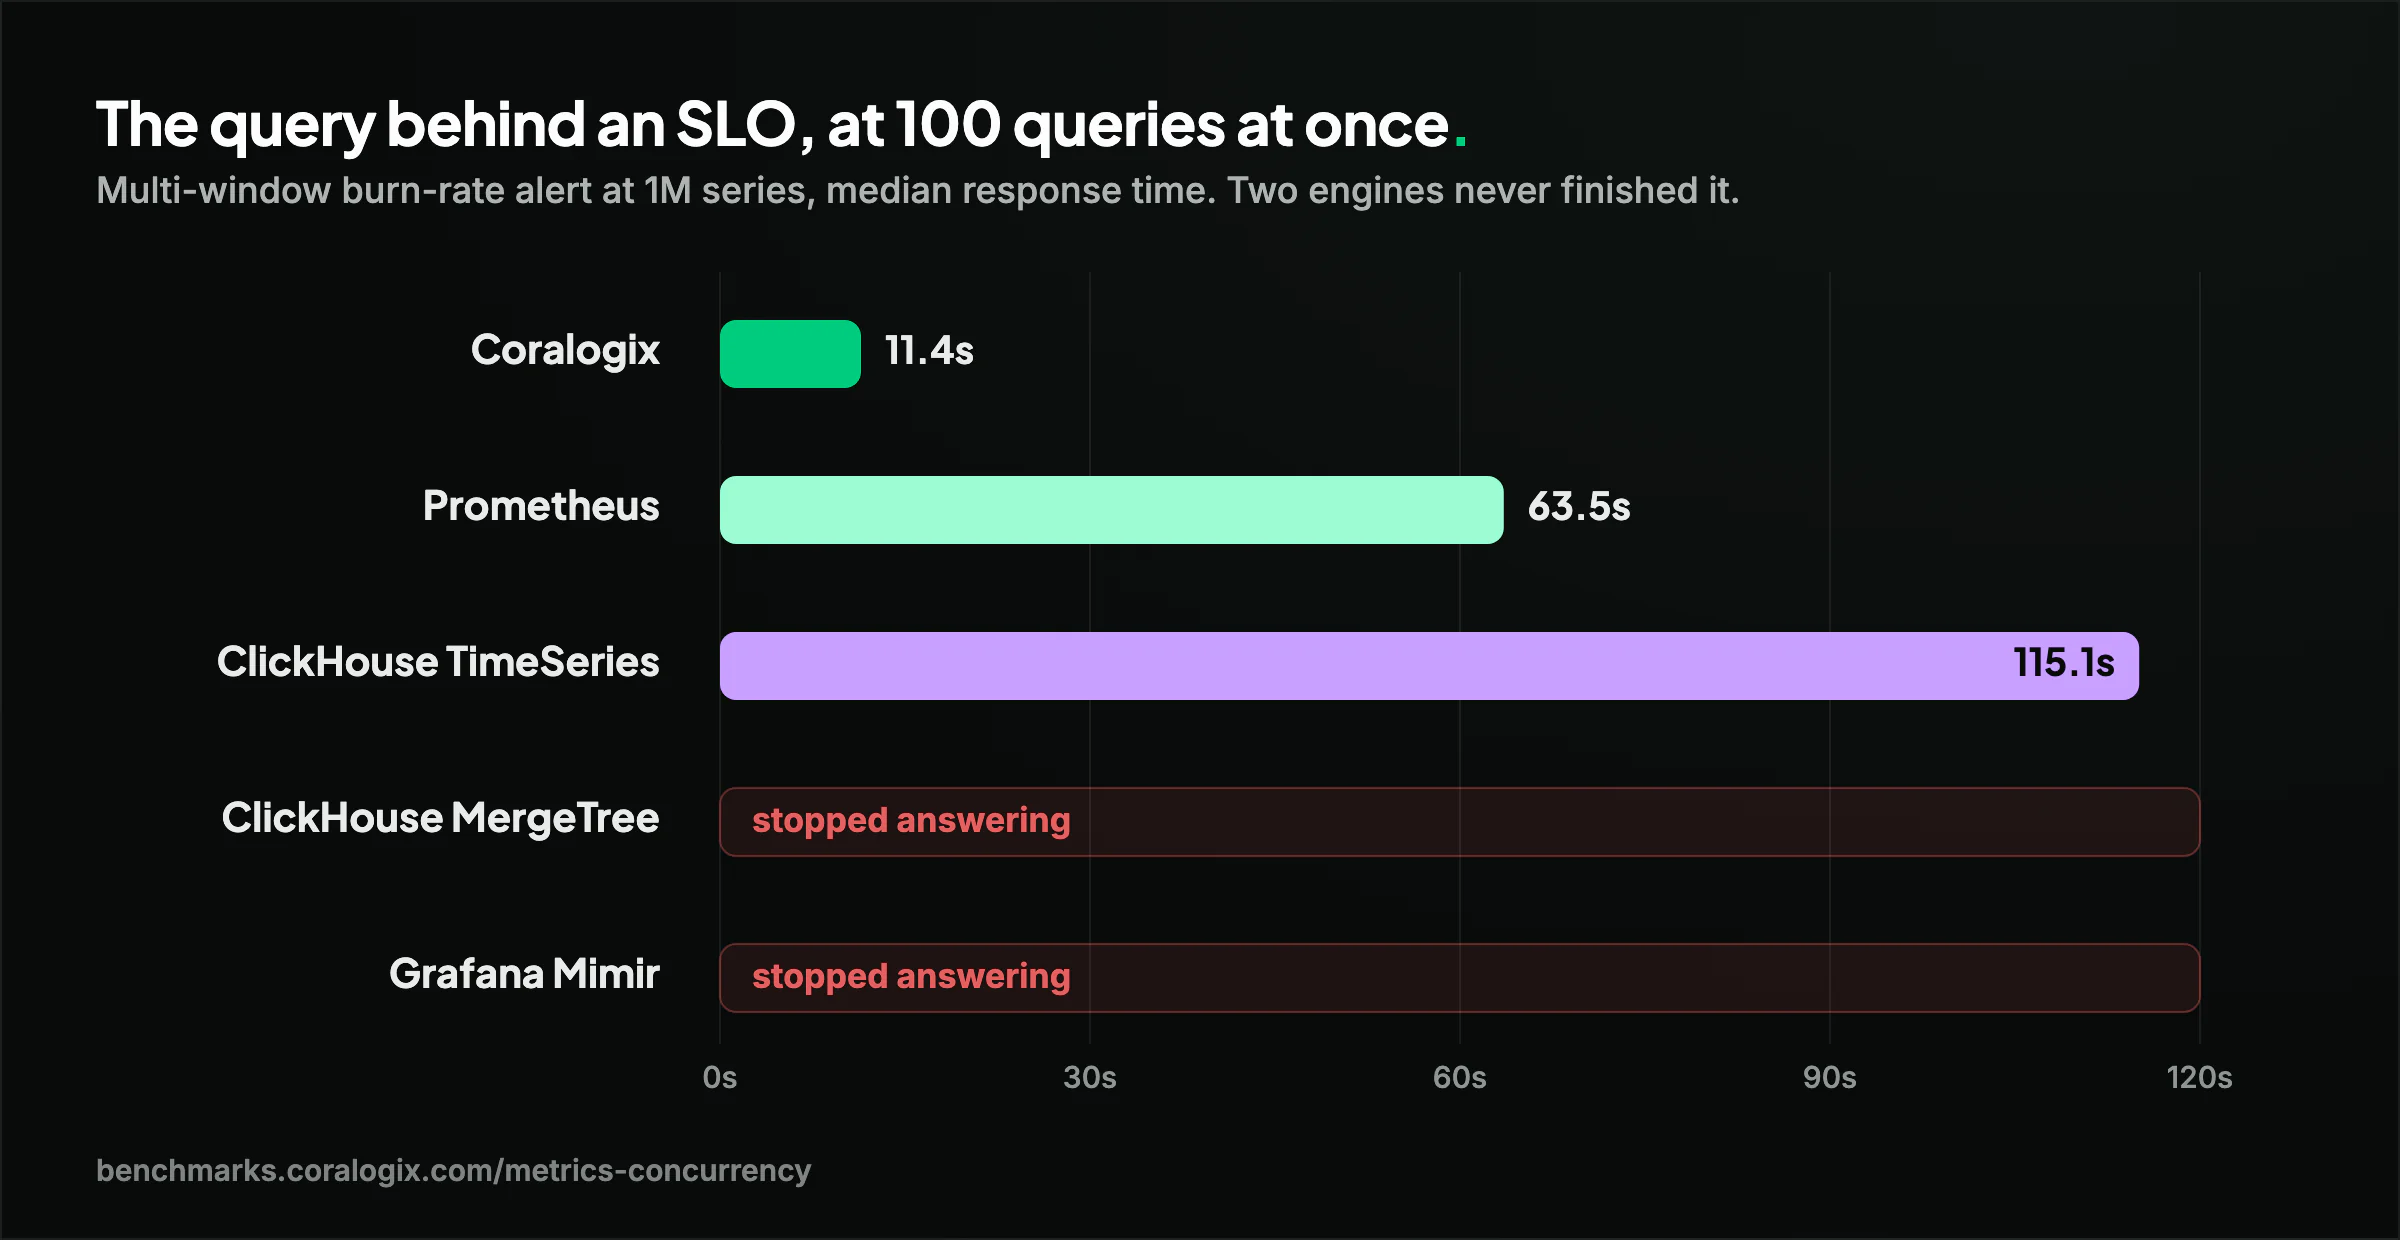
As concurrency rose, the result changed. Grafana Mimir collapsed at 30 queries at once and returned errors above that. ClickHouse on MergeTree saturated its CPU at 40 and returned nothing above it. The engine that was fastest on its own could not share the machine.
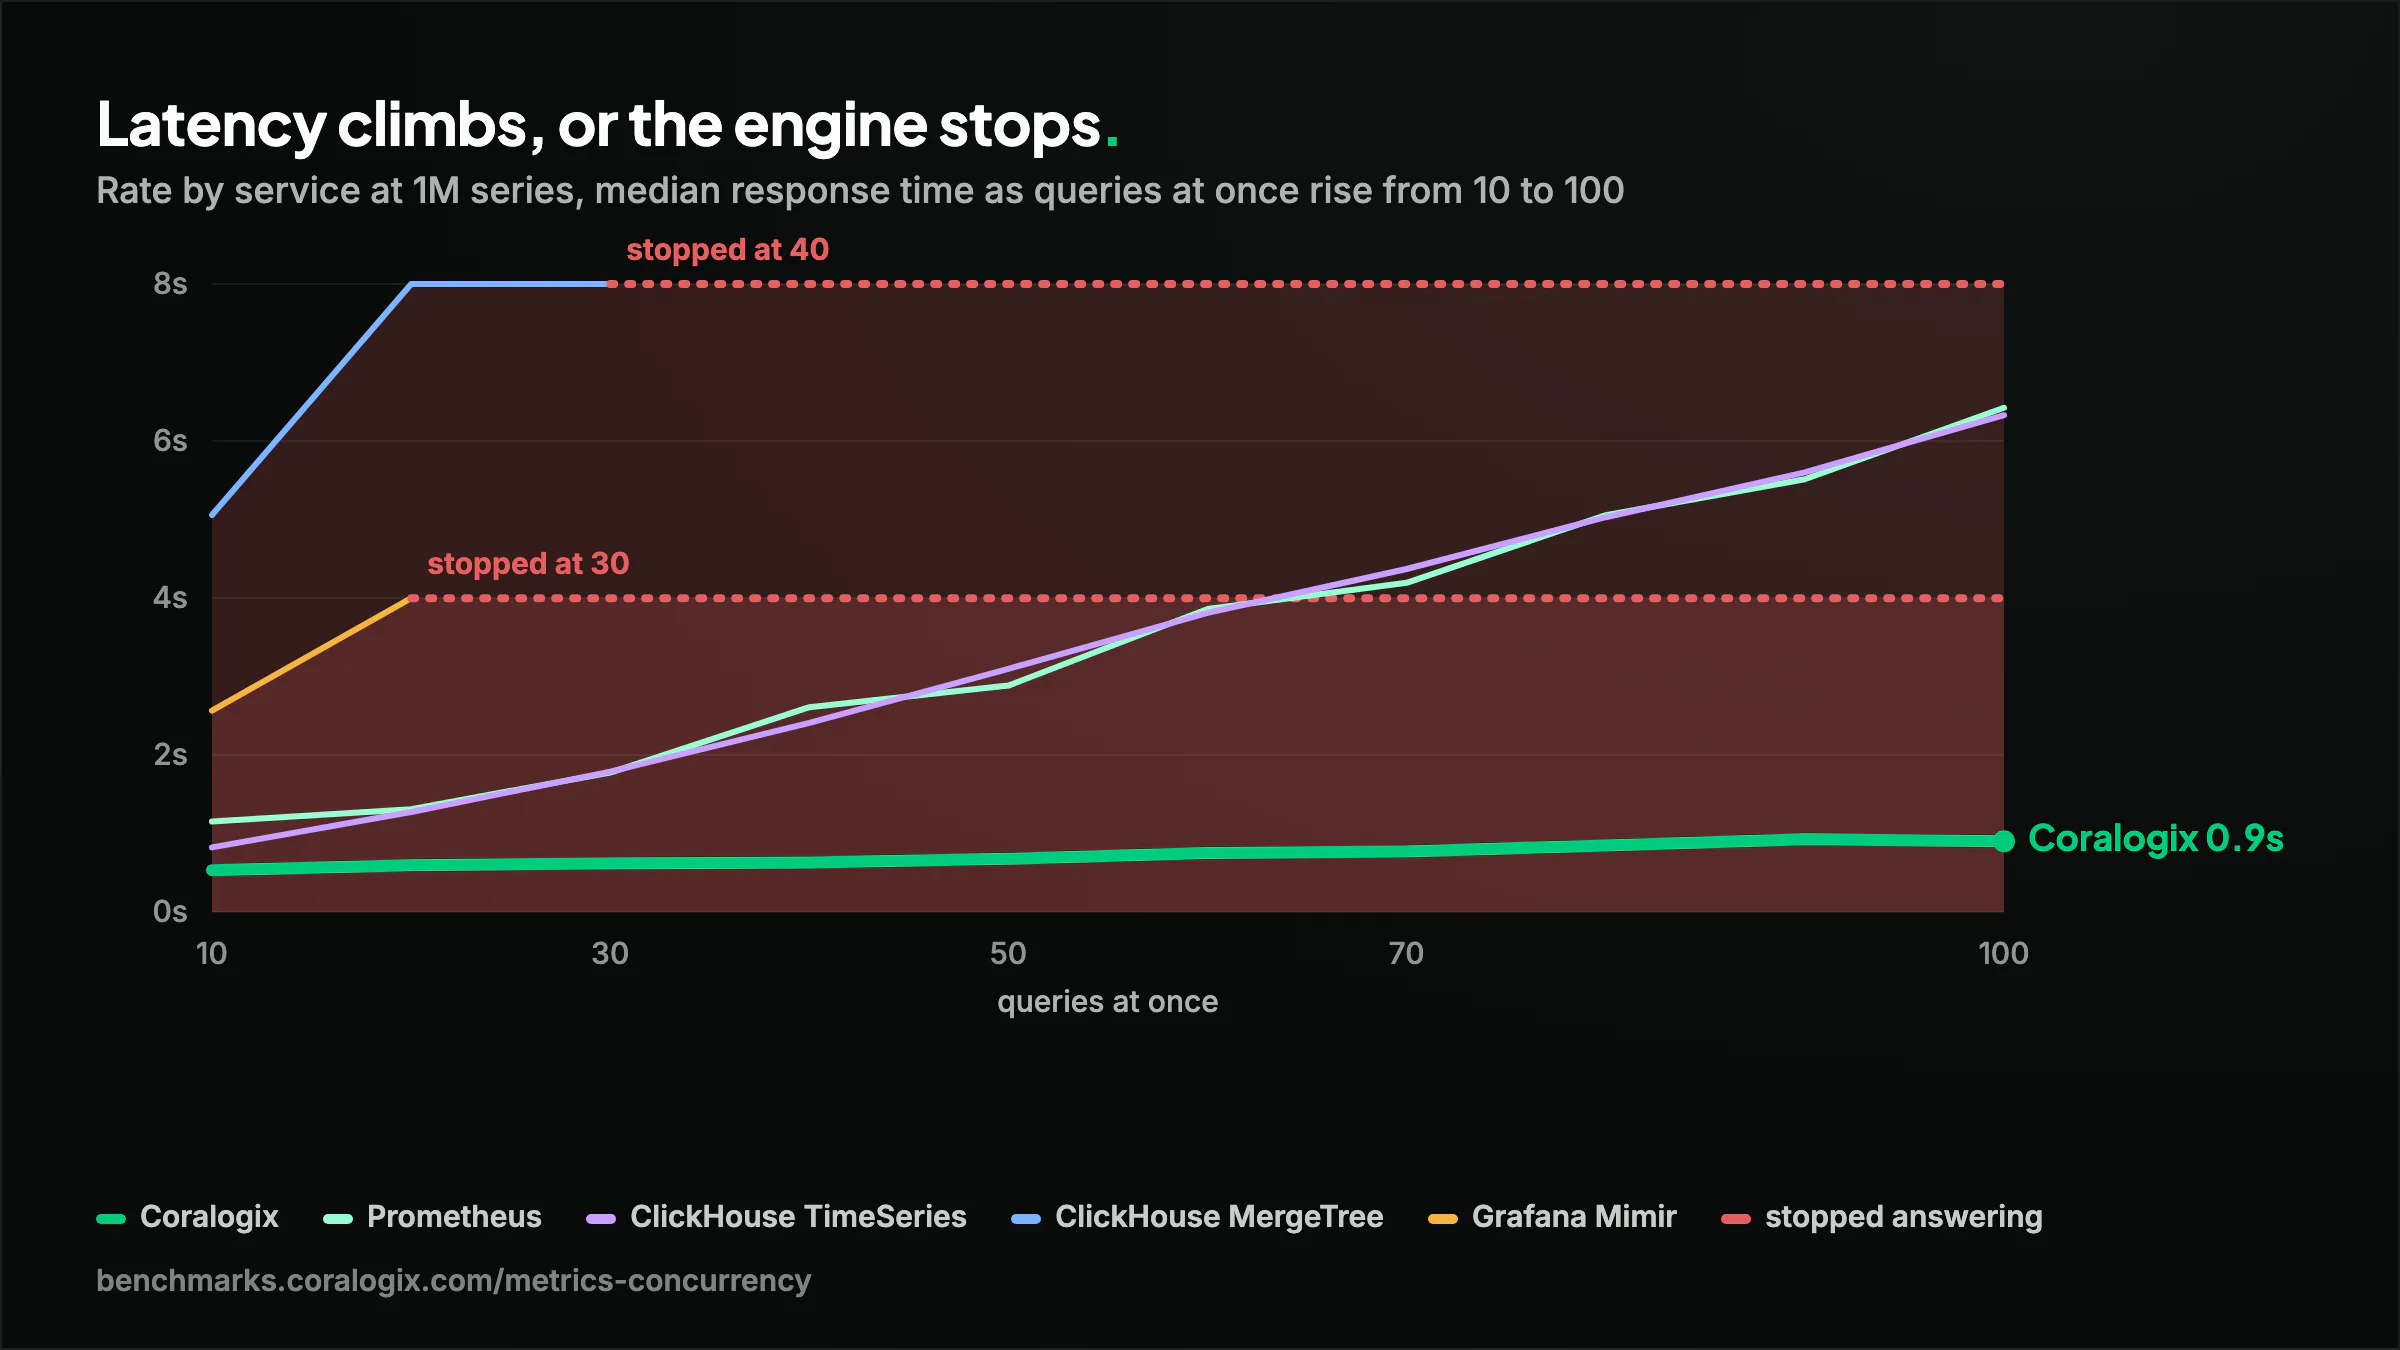
Prometheus and ClickHouse TimeSeries kept answering, but slowed down. Rate by service at a million series went from 1.2 to 6.4 seconds on Prometheus between 10 and 100 queries at once, and from 0.8 to 6.3 seconds on TimeSeries. The burn rate alert, the kind that sits behind an SLO, took Prometheus 63.5 seconds at the hardest setting and TimeSeries close to two minutes.
Coralogix went from 0.5 to 0.9 seconds on rate by service, held the burn rate alert to 11.4 seconds, and returned no errors in any of the sixteen settings.
Why they break under load
Mimir spreads a query across a ring of nodes. Under concurrent load at high cardinality, the coordination between those nodes saturates, and the cluster reports unhealthy members instead of results. Prometheus runs on a single node by design, so it stays up but has one machine’s CPU to share across every query. ClickHouse on MergeTree scans columns across many threads per query, which is why it is fast alone and why 40 queries at once leave nothing for the next.
Coralogix runs metrics through the Coralogix Metrics Engine, built for high cardinality, with aggregation done server side and data held in open formats in object storage you own. That is why its line stays flat while the others climb or stop.
ClickHouse is worth a second look. The MergeTree engine is what most teams run, and it is the one that collapsed. The native TimeSeries engine survived the full range but was the slowest of the engines that finished. Same company, same box, two engines, two outcomes.
Reading a metrics benchmark
A metrics backend tells you little at one query at a time, and most benchmarks stop there.
To learn what a backend will do for you, test it under your own load: the cardinality your labels produce, the concurrency your dashboards, alerts and agents generate, and the full query range rather than cheap point reads. Leave the configuration alone. A benchmark that tunes each engine into its best case measures the tuning, not the engine.
The full grid is on a live page, with the prompt that reproduces the run. The figures are there to check, and the method is there to repeat against your own stack.
What to do with this
The numbers that matter are the ones your traffic produces. Put the backend you run today under the concurrency your dashboards and agents already generate, and find the point where it stops answering.