The cost of knowledge


In the world of observability, “cardinality” has become a heavy word. It is a ghost used to justify skyrocketing bills or degraded query performance. When cardinality rises, the advice is almost always the same: reduce it. Drop your labels, or reduce the dimensions.
It is usually framed as “optimization.”
Every label you add to a metric is a dimension of knowledge. Each one gives you a way to slice, compare, and explain the chaos of production. Every time you remove a label, you are limiting the depth or width of your knowledge.
And then there is the cost of knowledge. It’s not merely about storage, but also the price of your ability to ask questions over time.
The two faces of the bill
To understand why observability feels so expensive, we have to look at how knowledge is taxed.
- The write cost: This is the overhead of storing knowledge. It is what platforms charge you to keep metrics with the dimensions that actually matter, such as merchant_id or pod_id.
- The read cost: This is the tax on curiosity. Sometimes it appears as a per-query charge. More often, it is hidden behind timeouts, forced rollups, or degraded resolution.
Most observability architectures are forced into a trade-off: they either prioritize high-volume ingestion at the expense of long-range query performance, or they protect query stability by making high-cardinality ingestion prohibitively expensive. This creates a ceiling for engineering teams, where they must choose between seeing the full picture today or being able to analyze trends over the last month.
Why high cardinality is inevitable: The churn factor
You do not need to be Netflix to hit billion-scale cardinality. You just need to use modern infrastructure.
Systems today are built on Kubernetes, autoscaling, and ephemeral pods. These behaviors create constant identity churn. Even if you only have 200 pods running right now, a rolling deployment or a busy week of autoscaling can easily result in 2,000 unique pod identities over a 90-day window.
When you multiply that infrastructure churn by business dimensions, such as 10,000 unique merchants or 100,000 content IDs, your cumulative cardinality explodes.
Scenario 1: A payments platform
Imagine a mid-market payments company. They are not global giants, but they have 10,000 merchants and deploy code weekly. Their metric for a successful payment looks like this: payment_success_total {service, region, merchant_id, pod}
At first glance, the team only sees the “active series,” which represents the pods running right now. That is not what breaks a system. What breaks the system is the union of every series that needs to be scanned for the query window.
This happens because a query is a search through history, not just a look at the present. While only 200 pods might be active today, a 30-day window captures every ephemeral pod created and destroyed during dozens of deployments. The database must scan the union of all those unique identities to calculate a trend. This cumulative “identity debt” is what causes queries to slow down or fail, even when your real-time dashboards look perfectly healthy.
When an incident hits and you ask which merchants had a p95 latency spike over the last 30 days, your system has to scan every merchant ID multiplied by every pod that has existed for a month. If your platform taxes you based on these combinations, you are faced with a brutal choice. You must drop the merchant_id to save money and lose the ability to tell which customers are hurting.
Scenario 2: A streaming platform
In a streaming environment, the killer is content ID accumulation. A few thousand shows might be live, but over a quarter, you might track over 100,000 unique pieces of content.
Combined with pod churn, the system is not just reading more data points. It is reading a massive web of unique identities. This changes the difficulty class of your queries. If your observability tool cannot handle the interaction between business IDs and infrastructure IDs, your long-range dashboards will simply stop loading right when you need them for a post-mortem.
The label you cannot drop
When cardinality explodes, the first instinct is to drop the pod or instance label. This is often a mistake.
In Prometheus-style metrics, the label set is the identity of the time series. If three different pods emit counters into a single series because you dropped the pod label, those writes collide. At best, you get a “last writer wins” scenario. At worst, you get interleaving counter values that break functions like rate().
Dropping the pod label does not just lose debugging detail. It can literally corrupt your data, leading to false alerts and unreliable metrics.
Cardinality is the shadow of reality
High cardinality is not a user mistake or a misconfiguration. It is the natural result of measuring a real, complex system with enough fidelity to actually fix it.
The real question is not whether you can reduce cardinality. The real question is whether your observability platform forces you to trade away knowledge to stay within a budget.
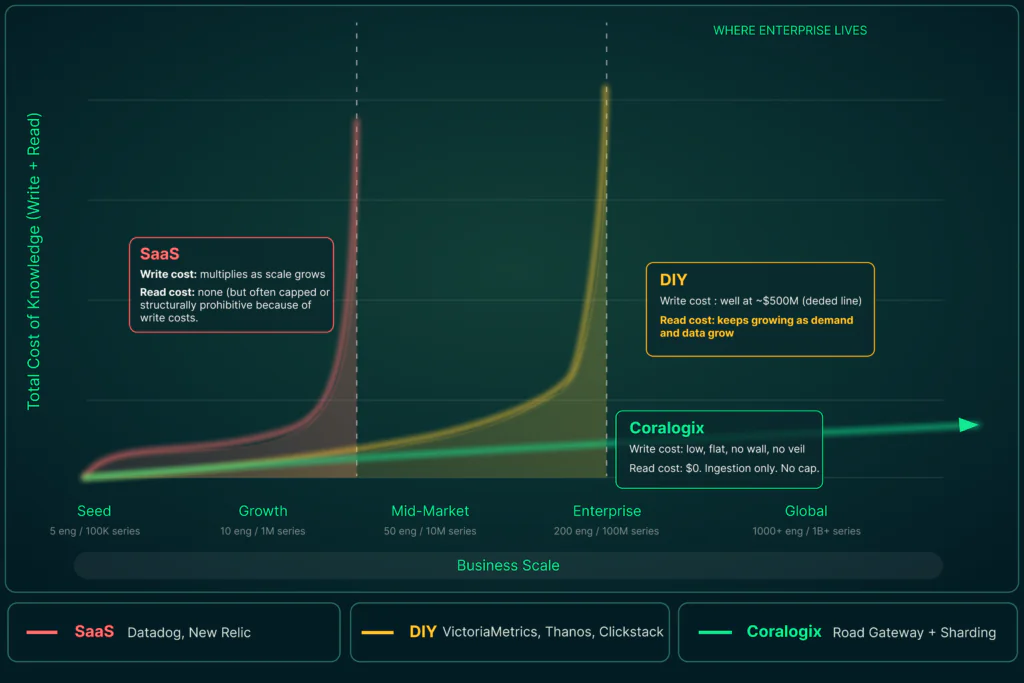
- In traditional SaaS: You pay a cardinality tax where every new label combination bends the pricing curve until it breaks.
- In DIY systems: You pay in operational rent, constantly scaling your own compute just to keep your head above water.
- In Coralogix: We focus on ingestion volume. Cardinality does not bend the pricing curve because the marginal cost of knowing “one more thing” should not be an existential threat to your budget.
Dropping labels is a choice not to know. When the next incident hits, the bill you pay is not just in dollars. It is the time and confidence you lost because you chose to be blind.
Scale without the blind spots
Coralogix removes the forced choice between your budget and your visibility. We act as partners in your growth, ensuring that as your infrastructure and cardinality scale, your ability to ask questions scales with it. Stop dropping labels and start measuring reality. Ready to learn more? Sign up here now.