Where did all my Claude Code tokens go?

Most teams judge their AI coding agent on two things: the monthly bill and a feeling. The bill tells you what you spent and the feeling tells you whether it seems to be helping, but neither one tells you what the agent actually did. As these tools move into the critical path of how software ships, that gap is starting to matter. I wanted to replace the feeling with something I could measure and understand what shapes of work affects this bill, so I decided to run an experiment on myself. Using the same brief, I coded an app in three different ways, and then explored the telemetry to see what insights I could unearth.
Right now, most teams are guessing
This is not a niche problem. In the LeadDev State of AI-Driven Software Releases 2026 report, 52 percent of engineers named a lack of clear metrics to evaluate AI’s impact on productivity or quality as their single biggest challenge with AI-generated code. Only 29 percent said they measure that impact at all, and of the teams that do, most fall back on employee sentiment. That is the industry measuring its most expensive new dependency on a feeling.
The spend is not waiting for the measurement to catch up. Uber burned through its entire 2026 AI budget in four months on Claude Code, according to Forbes, and Microsoft cancelled most of its internal Claude Code licenses over runaway token costs, per The Verge. The bills are real and climbing, but the productivity question is mostly unanswered. The gap between those two facts is exactly where a feeling ends up doing the work that data should.
The signal is already there
The convenient part is that you do not have to instrument anything. Claude Code, Codex, Gemini, and the other agentic coding tools already emit OpenTelemetry data: every API call, every tool call, every accept or reject, every token. The data is sitting there whether you look at it or not, and all you need to do is point it at an observability backend.
To do that, you enable telemetry in the Claude settings file, set the exporters, add a team name, and give it an endpoint to an observability backend. I pointed mine at Coralogix, and used these settings:
{
  "env": {
    "CLAUDE_CODE_ENABLE_TELEMETRY": "1",
    "OTEL_METRICS_EXPORTER": "otlp",
    "OTEL_LOGS_EXPORTER": "otlp",
    "OTEL_EXPORTER_OTLP_PROTOCOL": "http/protobuf",
    "OTEL_EXPORTER_OTLP_ENDPOINT": "<YOUR_CX_OTLP_ENDPOINT>",
    "OTEL_EXPORTER_OTLP_HEADERS": "Authorization=Bearer <YOUR_CX_API_KEY>",
    "OTEL_RESOURCE_ATTRIBUTES": "cx.application.name=claude-code,cx.subsystem.name=<TEAM_NAME>",
    "OTEL_EXPORTER_OTLP_METRICS_TEMPORALITY_PREFERENCE": "delta"
  }
}
That is the whole setup. From there the question stops being “does this feel faster” and becomes “how do different usage patterns affect software delivery”?
I tried three approaches to building the same app
I gave Claude the same brief three times: build something like ClassPass, but for every kind of hobby. The idea being you could book a kite-surfing lesson, a pottery workshop, and a guided hike all in one place (for anyone who knows me, I would find this incredibly useful!). Then I built it using three different approaches.
The first was a default, open stance. I gave a fairly loose brief but pushed back constantly as Claude presented work. I objected to design choices such as “why is everything in one file here, can we separate it out?” We talked through the tradeoffs of Prisma versus Drizzle for the Node backend. I asked it to simplify code I did not like.
The second was strict test-driven development, where I forced small batches and asked for the simplest code that would make each test pass.
The third I turned on –dangerously-skip-permissions. I gave it a really open brief and let it run, and gave a large list of extra features to add in one go.
Before I looked at any data, I had a clear vibe. Test-driven development felt like the best code and the most efficient session. Skip-permissions produced the most volume. The default session felt like a slog, because I kept refusing work. Then I pulled the cost.
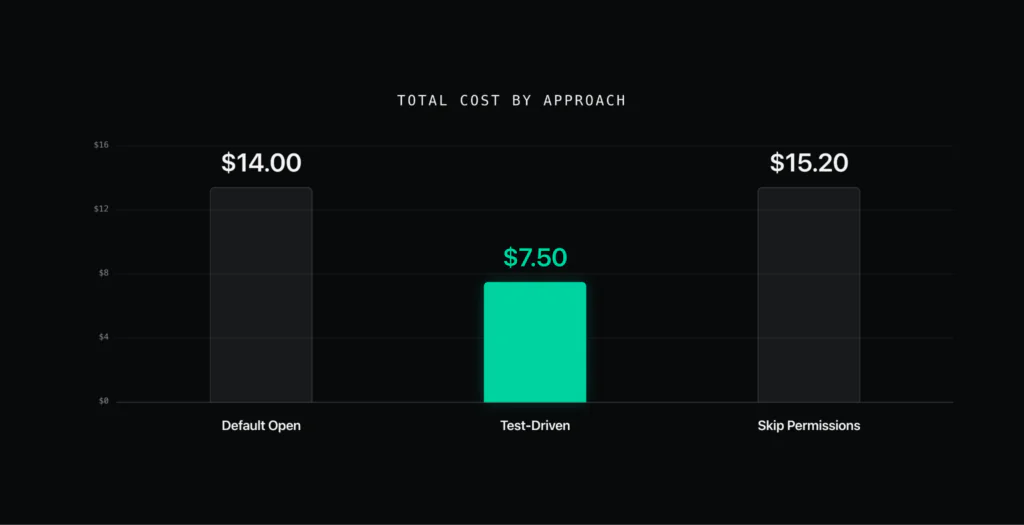
Test-driven development came in at $7.50, against $14.00 for the default stance and $15.20 for skip-permissions. It also had the cleanest cache and the lowest real rejection rate, under one percent. On the first read, test-driven development looks like a straightforward win, and the vibe and the bill agree for once.
The total bill was misleading
There is something wrong with that comparison. The three sessions did not build the same thing. The test-driven session did targeted work on a single feature inside an existing codebase. The skip-permissions session built a whole application from scratch. The bills are measuring different amounts of work, so putting them side by side tells you almost nothing.
If you normalize for volume, the picture inverts. Scaling the test-driven session’s cost per unit of code up to the volume skip-permissions generated puts it at $28, and it would have taken far longer.
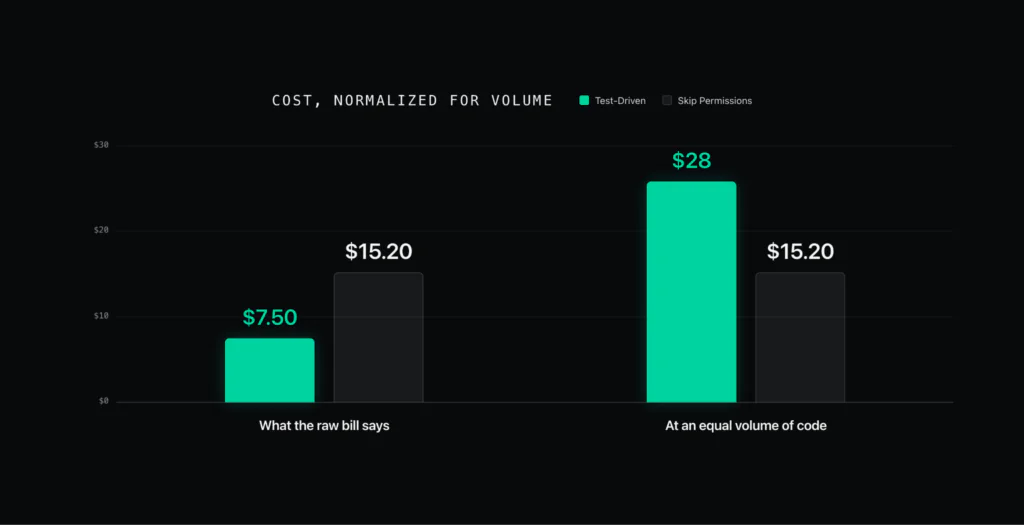
So now skip-permissions looks like the cheap, fast option. It did the most work in the shortest time, for a bill that sits right next to the others. If you optimize on total code shipped and wall-clock time, accept-everything wins. However, that wasn’t the full picture.
Per-turn cost is where the truth shows up
I decided to look deeper than the surface-level cost comparison. The default open approach and the skip-permissions approach charged me with similar bills. But the skip-permissions session took 83 API turns. The default session took far more, 189 turns. (A ‘turn’ is one request the agent sends to the model. It fires off dozens to finish a task.)
Skip-permissions did less than half the turns and still cost slightly more in total, which means each turn was carrying a lot more weight. That works out to $0.18 per turn against $0.07 for the default stance.
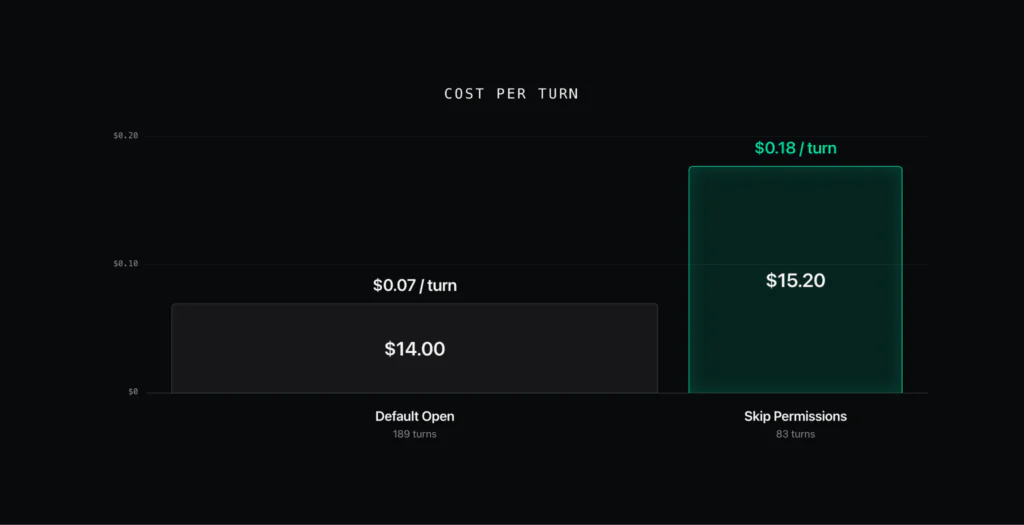
That is more than two and a half times the price for every single turn. The total bill flattered skip-permissions because it hid the unit price inside a smaller turn count. So where did this money go? The answer is in the cache.
Watching the agent change its mind
The cache hit rate emerged as one of the most useful signals to explain different shapes of work.
What is the cache hit rate?
Every turn, the agent resends the whole conversation: the system prompt, all the prior messages, everything. The API caches the parts that do not change between turns, so it does not pay full price to re-read them. A 99 percent cache hit rate means almost the entire prompt was reused.
Analysing my session data, I found that cache creation tokens, the ones written when something new has to be cached, cost roughly three and a half times what cache read tokens cost. When the hit rate drops mid-session, it does not just get a little slower, it gets more expensive quickly.
A drop means something inside the already-cached portion of the prompt changed. Usually that is the agent rewriting its own to-do list or restructuring a plan it had already committed to. In this experiment, I noted each of these large drops as an invalidation event, and it is the closest thing you get to watching the agent change its mind in real time. You are paying to re-cache the large volume of context it just invalidated.
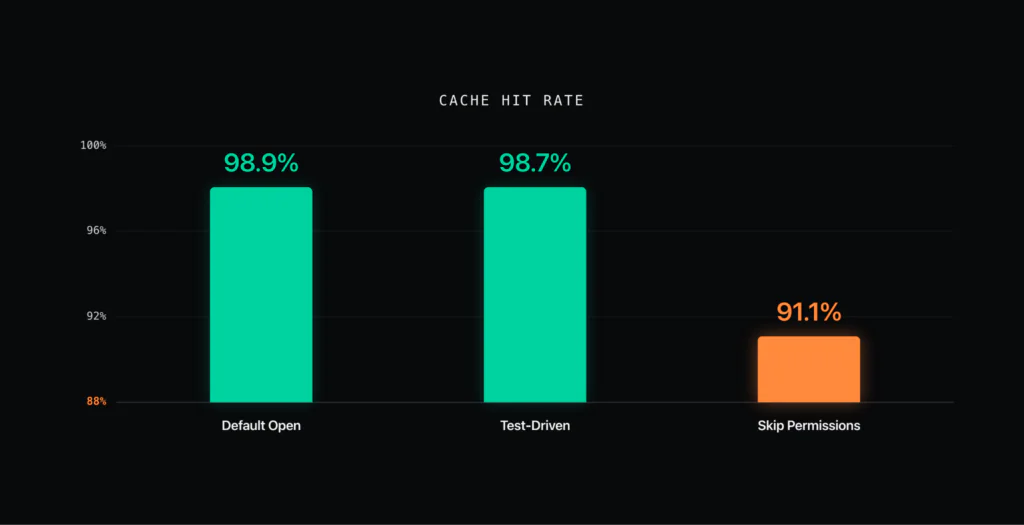
The default and test-driven sessions sat at 98.9 and 98.7 percent. Skip-permissions sat at 91.1 percent, around seven points lower, with six invalidation events. The other two sessions had none.
The Tool Mix
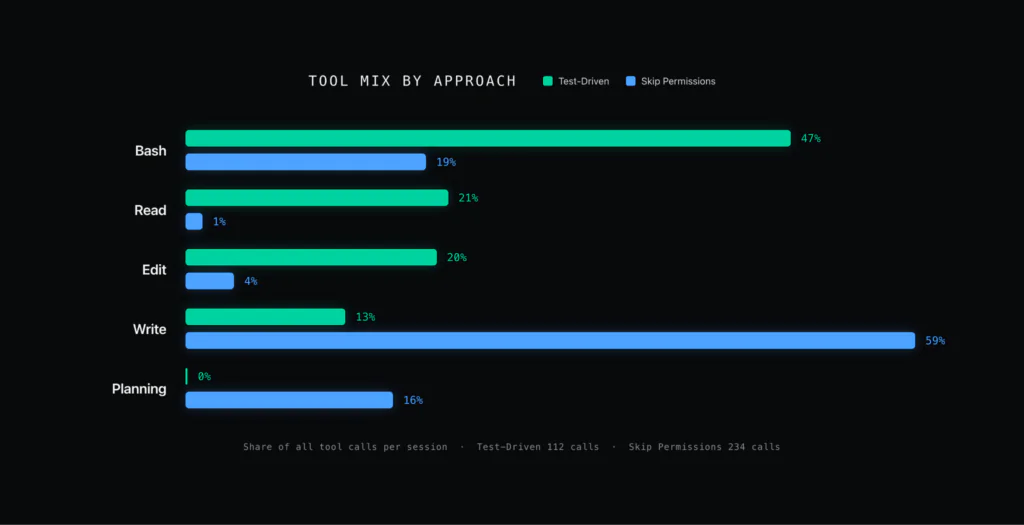
The tool mix explains why. The Skip-permissions approach was 59 percent file writes, churning through a long sequence of plan-and-rewrite cycles that kept rewriting the cached to-do state. The test-driven session was the opposite shape: the dominant tool call was Bash, at 47 percent. The test-driven approach also had no planning tool calls like TaskUpdate and TaskCreate – the tools where the agent figures out what it wants to do. The test-driven approach didn’t have these, because each change was one unit of work.
The cost did not come from the code. It came from the agent doubting itself between turns.
It’s not just me
An experiment on one engineer across three sessions is a hypothesis, not a finding. So my team mate took the same per-turn fields, the cache creation tokens, and the cost, and ran the question across over 20,000 Claude Code sessions over ninety days (no prompts, just the metrics and logs).
A key finding was that the cache-invalidation pattern surfaced across the data. After building a detector tool for mid-session cache invalidations, (separate from the unavoidable cold start at the beginning of a session), we found that 268 sessions displayed this pattern, around 1.3 percent of the total. Between them they carried 811 genuine invalidation events. So my six events in an hour were not an artifact. They were a small, sharp instance of a pattern that shows up across thousands of other sessions, and it concentrates exactly where you would expect: the invalidation-prone sessions run a median of 237 turns against about ten for everyone else, with large contexts. It is a property of long, undirected, big-context work.
The cost model that falls out of the wider data is simple. Cost is context size times turns times model rate. About 63 percent of all spend is context re-read, around a quarter is cache writes, and only about eleven percent is the actual generated output. Your working stance, open or test-driven, does not move the unit price at all. It only moves the volume. Which means the levers that actually control cost are orthogonal to how you like to work: how much context you drag through each turn, how long you let a session run, and which model you point at the task.
In my experiment, the Skip-permissions approach was expensive not because of the flag, but because it produced the long, undirected, context-heavy session shape that the wider data flags as the costly one.
The levers that actually move cost
The timing is the part most people miss. Context ramps for roughly the first third of a session, a median of about thirty-two turns, and then auto-compaction caps it at a ceiling of around 113k tokens, far higher on the 1M-window models. You pay that rate on every remaining turn, so the expensive decisions are the early ones. By the time a session starts to feel heavy, that rate is usually already locked in.
Shrink the context
The biggest and least obvious lever, because that re-read line is the one that dominates the bill. Clear or compact between tasks, keep only the files you actually need open, and don’t drag a whole repo through a long session. The ceiling locks in early, so a lean start is what keeps every later turn cheap.
Keep sessions short and scoped
What sets the per-turn rate is how much context each turn carries, not how long you run, so a long but lean session is actually cheap per turn. Total cost is just the number of turns times the context each one drags along, and the expensive case is a sprawling session that also carries a big context across every turn. Keep the scope tight and the context lean.
Match the model to the work
Reserve the premium model for genuinely hard reasoning. Move the mechanical work, the search, the boilerplate, the routine refactors, onto a smaller model, and you cut both the generation rate, by roughly three times, and the re-read rate, by roughly six times, for the whole session.
Generate in proportion to need
Generation is only a small slice of the bill but, token for token, the priciest thing you buy. A huge one-shot generation into a big context is the expensive shape; the same work done in smaller, targeted changes costs less per unit of progress.
What to go and look at
If you look simply at your overall coding agent bill, you’re not getting true insight. The bill flattens very different sessions into a single number and hides the unit price. But the per-turn signals are already being emitted, and none of this took new instrumentation: the data was streaming out of every session I ran, waiting for someone to look. Once you read it, the cost stops being a monthly surprise and becomes something you steer, turn by turn. Run the same four levers across a team and the savings compound, because the rate you set in the first third of a session is the rate you pay for the rest of it, on every session. The teams that get the most out of agentic coding will be the ones who read these signals, rather than the ones who guess.