Introducing Coralogix Product Analytics

Coralogix Real User Monitoring has spent years collecting full-fidelity user sessions: every session and event processed in stream, without sampling and without prior indexing, at rest in cloud object storage you own. Today that data does a second job. Product Analytics brings heatmaps, funnels, and pathways to the RUM sessions you already send, with no second SDK to install. One dataset now answers what your users did and why it happened.
What has changed?
Behavioral analytics has always arrived from somewhere else. A tag manager, a marketing pixel, a sampled event stream maintained by a different team, in a tool your engineers never open. It answers what users did. It cannot tell you why, because it never saw the error, the slow response, or the release that shipped them.
Product Analytics reads three event types the RUM SDK already captures. A session is one visit, from first activity until the user goes inactive. A view is a page or screen, identified by its path. An action is a single interaction inside a view, a click on a button or a link. Funnels are an ordered sequence of those events, heatmaps aggregate actions by the element the user touched, and pathways trace the sequences of views users move through. Every event keeps its session context, so any number opens into the sessions behind it.
Your data has not moved. The same SDK, the same sessions, the same cloud object storage you own, inside the same platform your engineers already use to debug production.
Where attention actually lands
Heatmaps run on web applications. They draw over a real screenshot of the page, captured by Session Replay as it looked that day. Three views share that screenshot. Top elements ranks the most-clicked controls on the page. Click map paints clicks as color spots, warmer where they concentrate. Scroll map shows how far down the page people get, and marks the average fold.
Read it per device size, because a control that dominates on desktop can sit below the fold in a phone browser.
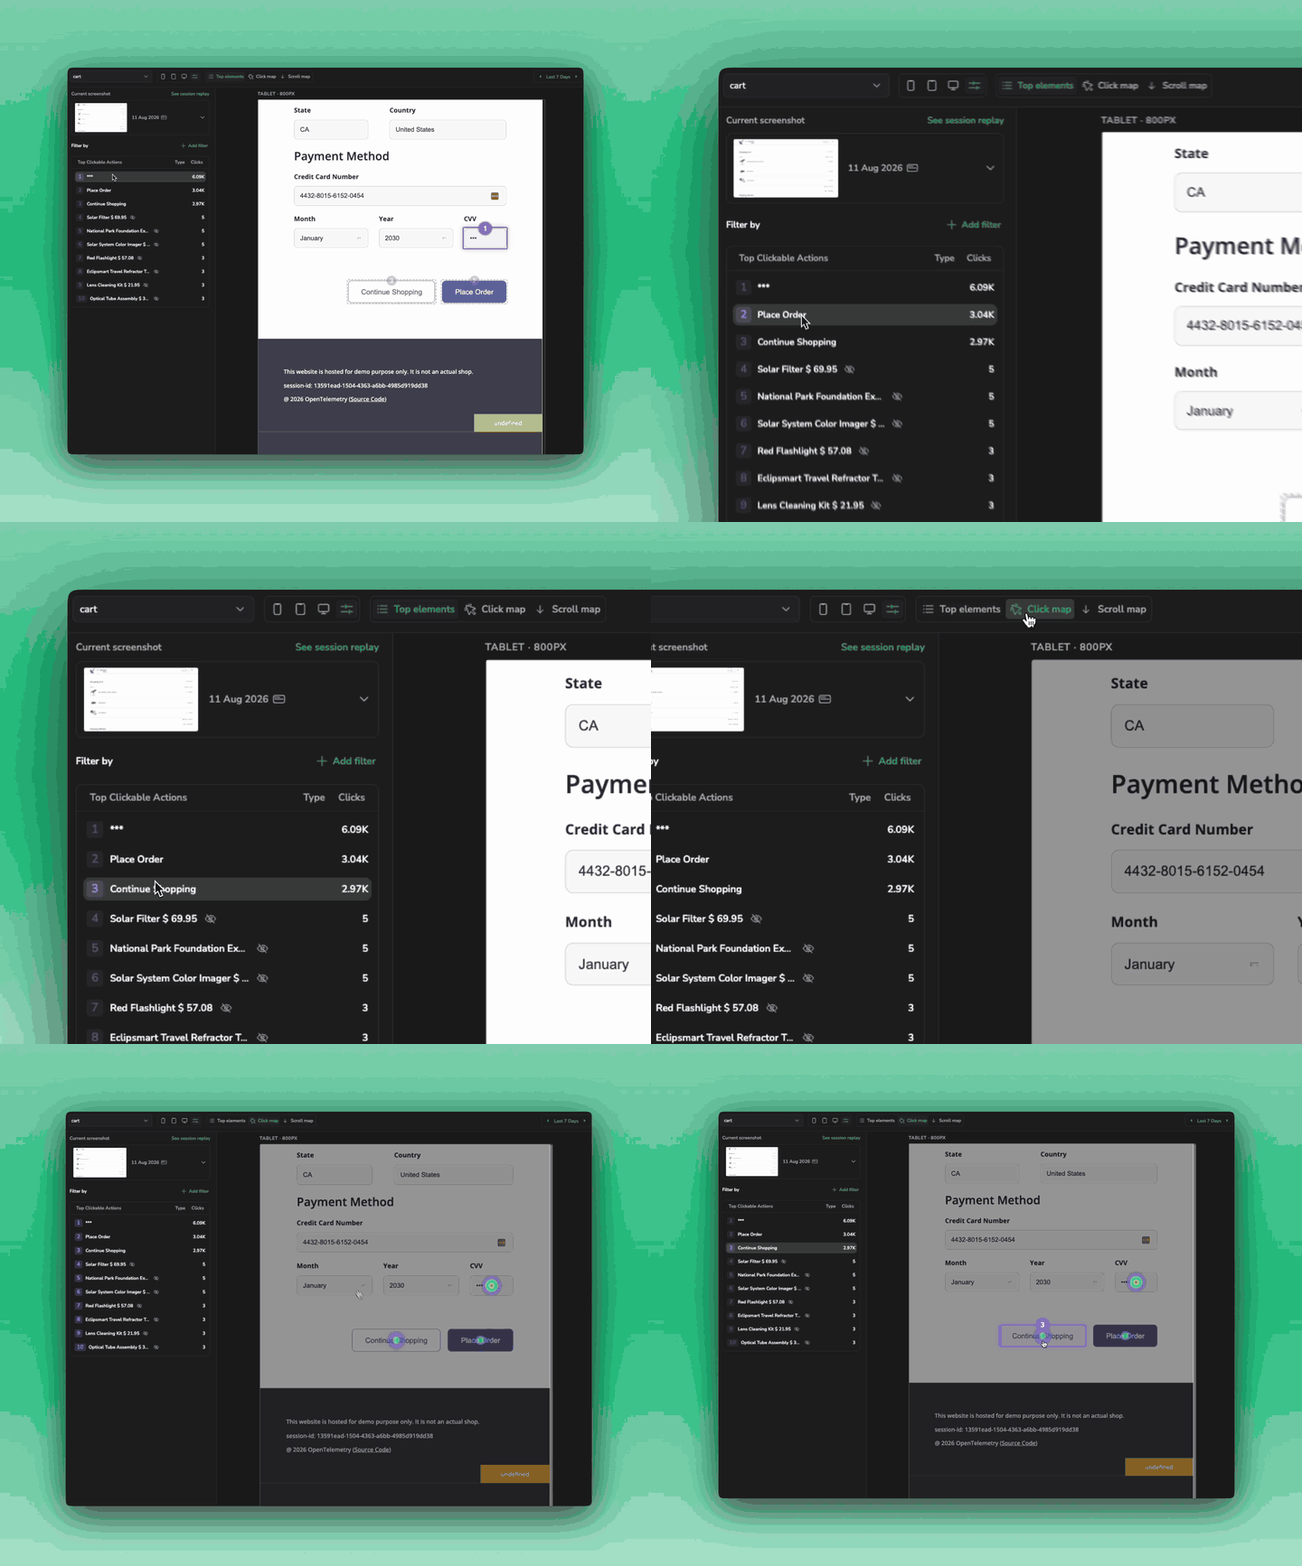
Rage clicks are rapid repeated clicks on one element, where someone expected something to happen and nothing did. Dead clicks got no response at all. Product Analytics badges both in that same ranked list, with the share of clicks affected, and opens the drilldown on whichever signal it found. Read the dead clicks first, because a control that answers nothing is usually broken rather than unpopular.
Where the flow loses people
A funnel measures an ordered flow and reports what each step lost. Steps are views, actions, or custom events your application sends, so the flow you measure is the flow you shipped rather than an approximation of it. Funnels and pathways work everywhere the RUM SDK does, web and mobile alike.
Segment one step or the whole funnel to find out whether a drop hits everyone or only one browser or one country. You can also filter on the account ID, account name, and user email your SDK sets, so “which accounts stalled in onboarding” becomes a filter rather than an export. Environment is in there too, and it is the one worth setting first, unless you want your staging traffic inside your conversion rate.
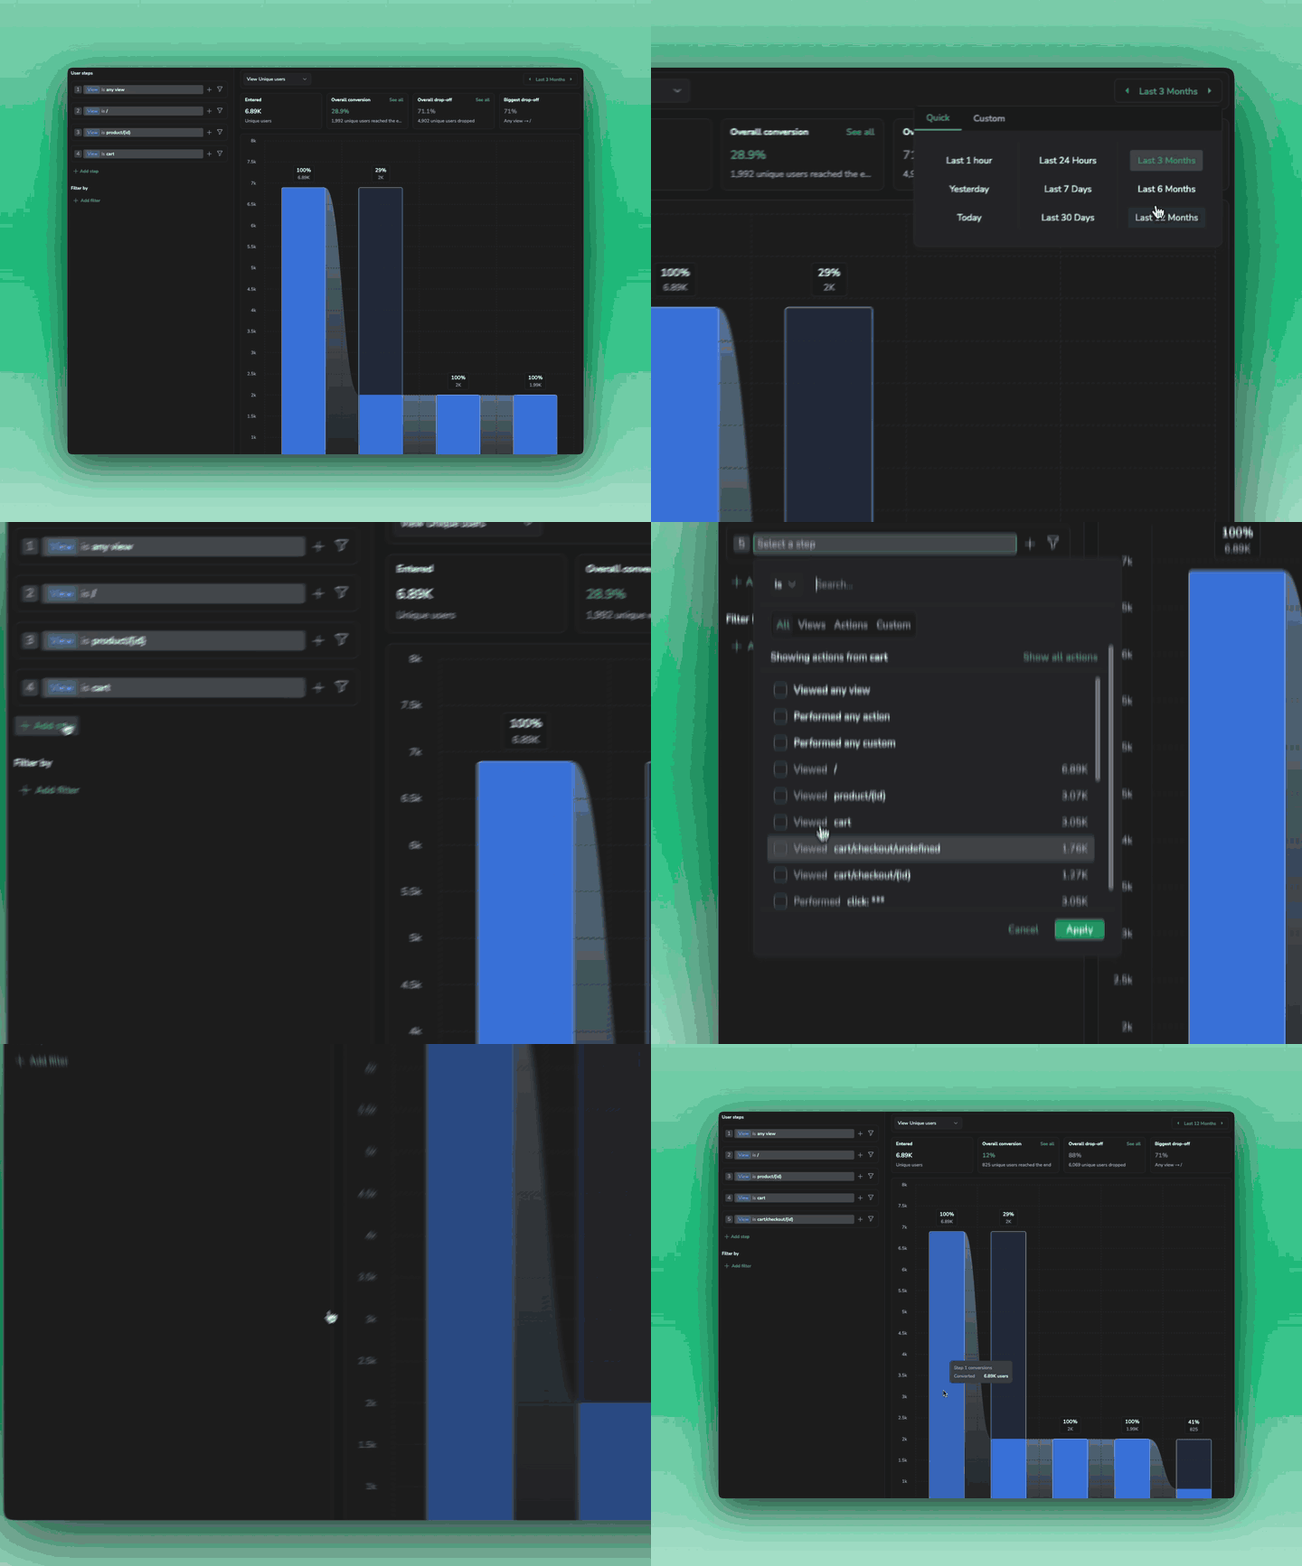
A funnel counts either unique users or sessions, and the two diverge sharply for any flow people come back to. A user who abandons checkout and comes back twice is three sessions and one person. Unique users answers “how many people completed this”, sessions answers “how many attempts completed”. Pick the one that matches your question, because the same funnel tells two different stories.
App version is on that list too, which is what turns a funnel into a release report. Filter to the version you shipped this week, then to the one before it, and the step that moved is where the release landed. Open the sessions behind that step and you land on the errors those users hit, so the release, the behavior, and the fault sit one drilldown apart.
The routes you did not plan for
A funnel needs you to know the flow before you can measure it. Often you do not. Pathways anchors on a single view and traces the routes users actually took around it. It renders as a Sankey, and the width of each ribbon is the sessions that moved between two views.
Trace after a view to see where people went next, or before it to see how they arrived, then widen it until the shape of the real traffic appears.
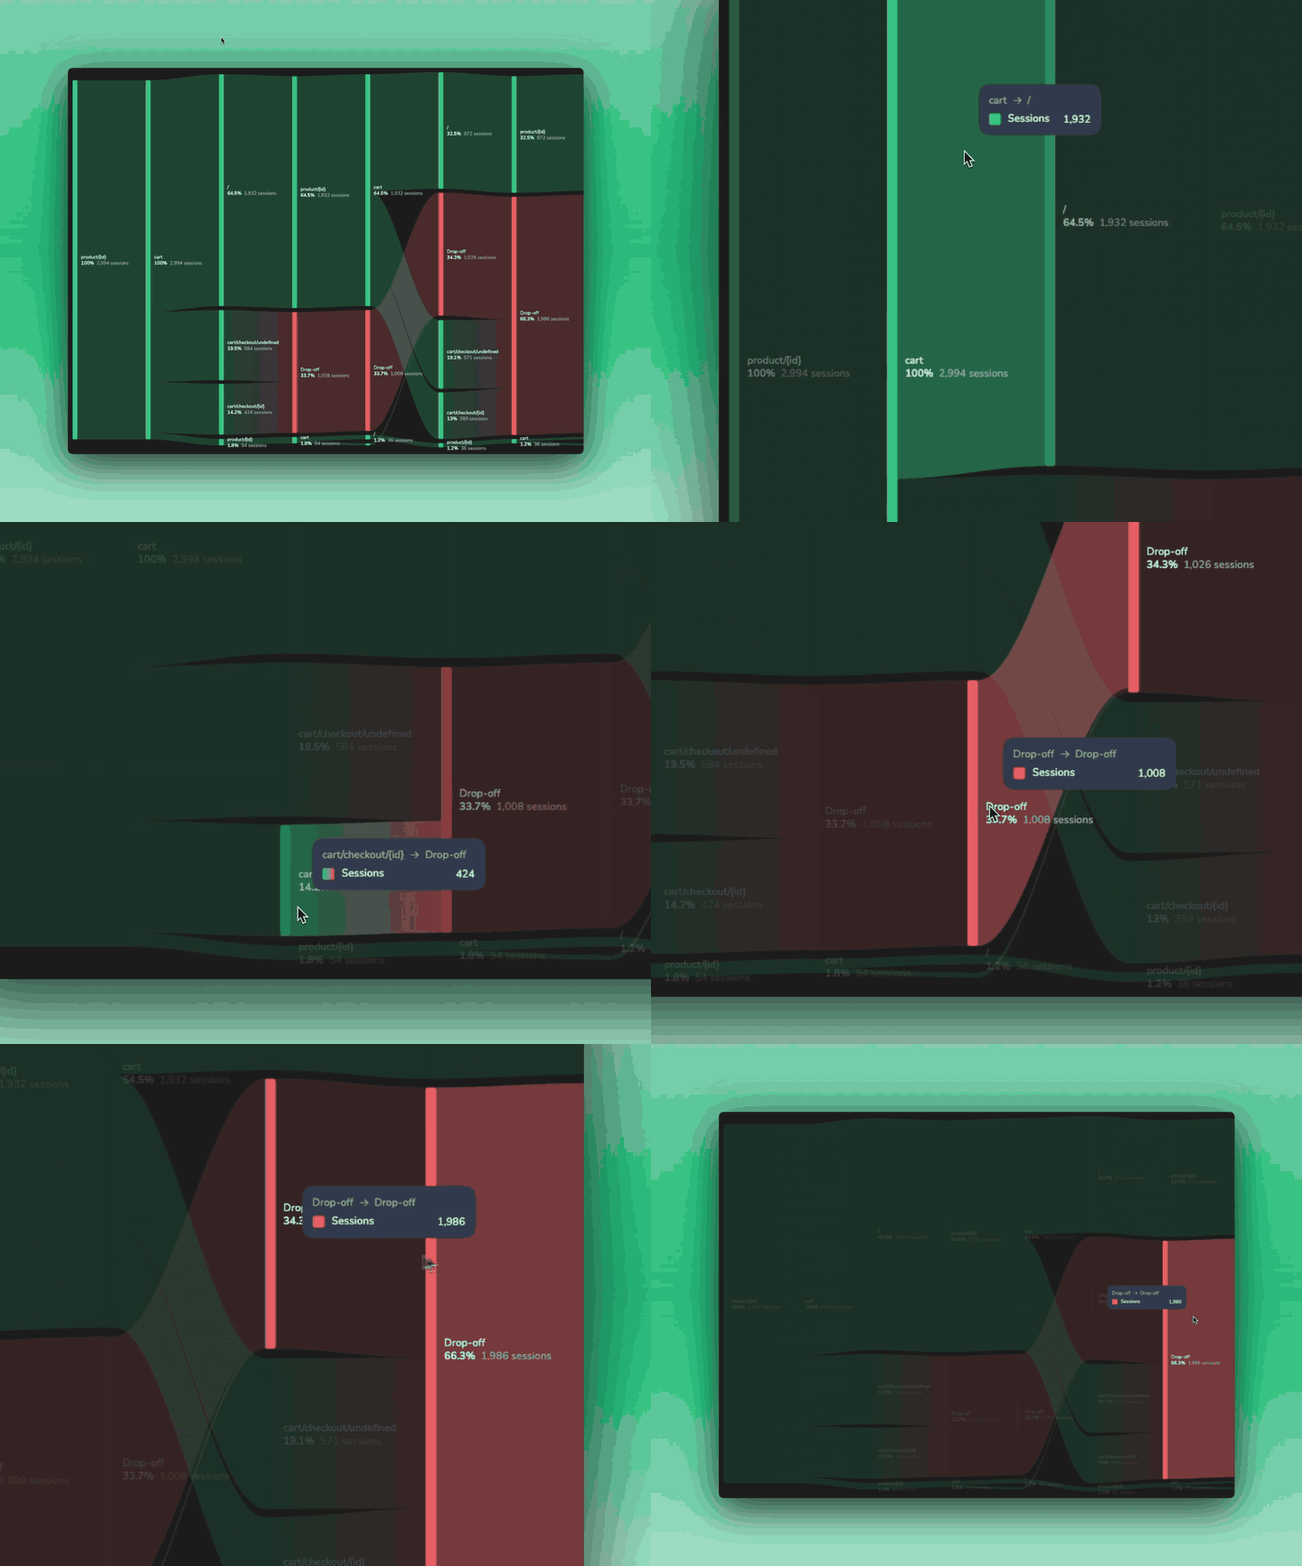
Reach for a funnel when you already know the flow you want to measure. Reach for a pathway when you want to find out what the flow really is, including the loops back and the exits nobody designed.
From a percentage to a person
Every view is one click from the RUM data underneath it, which is what turns an aggregate into the customers behind it. Open a funnel step or a heatmap element and you get the people, by name wherever your SDK sets user context, up to the top hundred, and one more click plays any of their sessions in Session Replay. Funnel lists download as a CSV, and a heatmap element seeds a new funnel, so a hunch about one button becomes a measured flow.
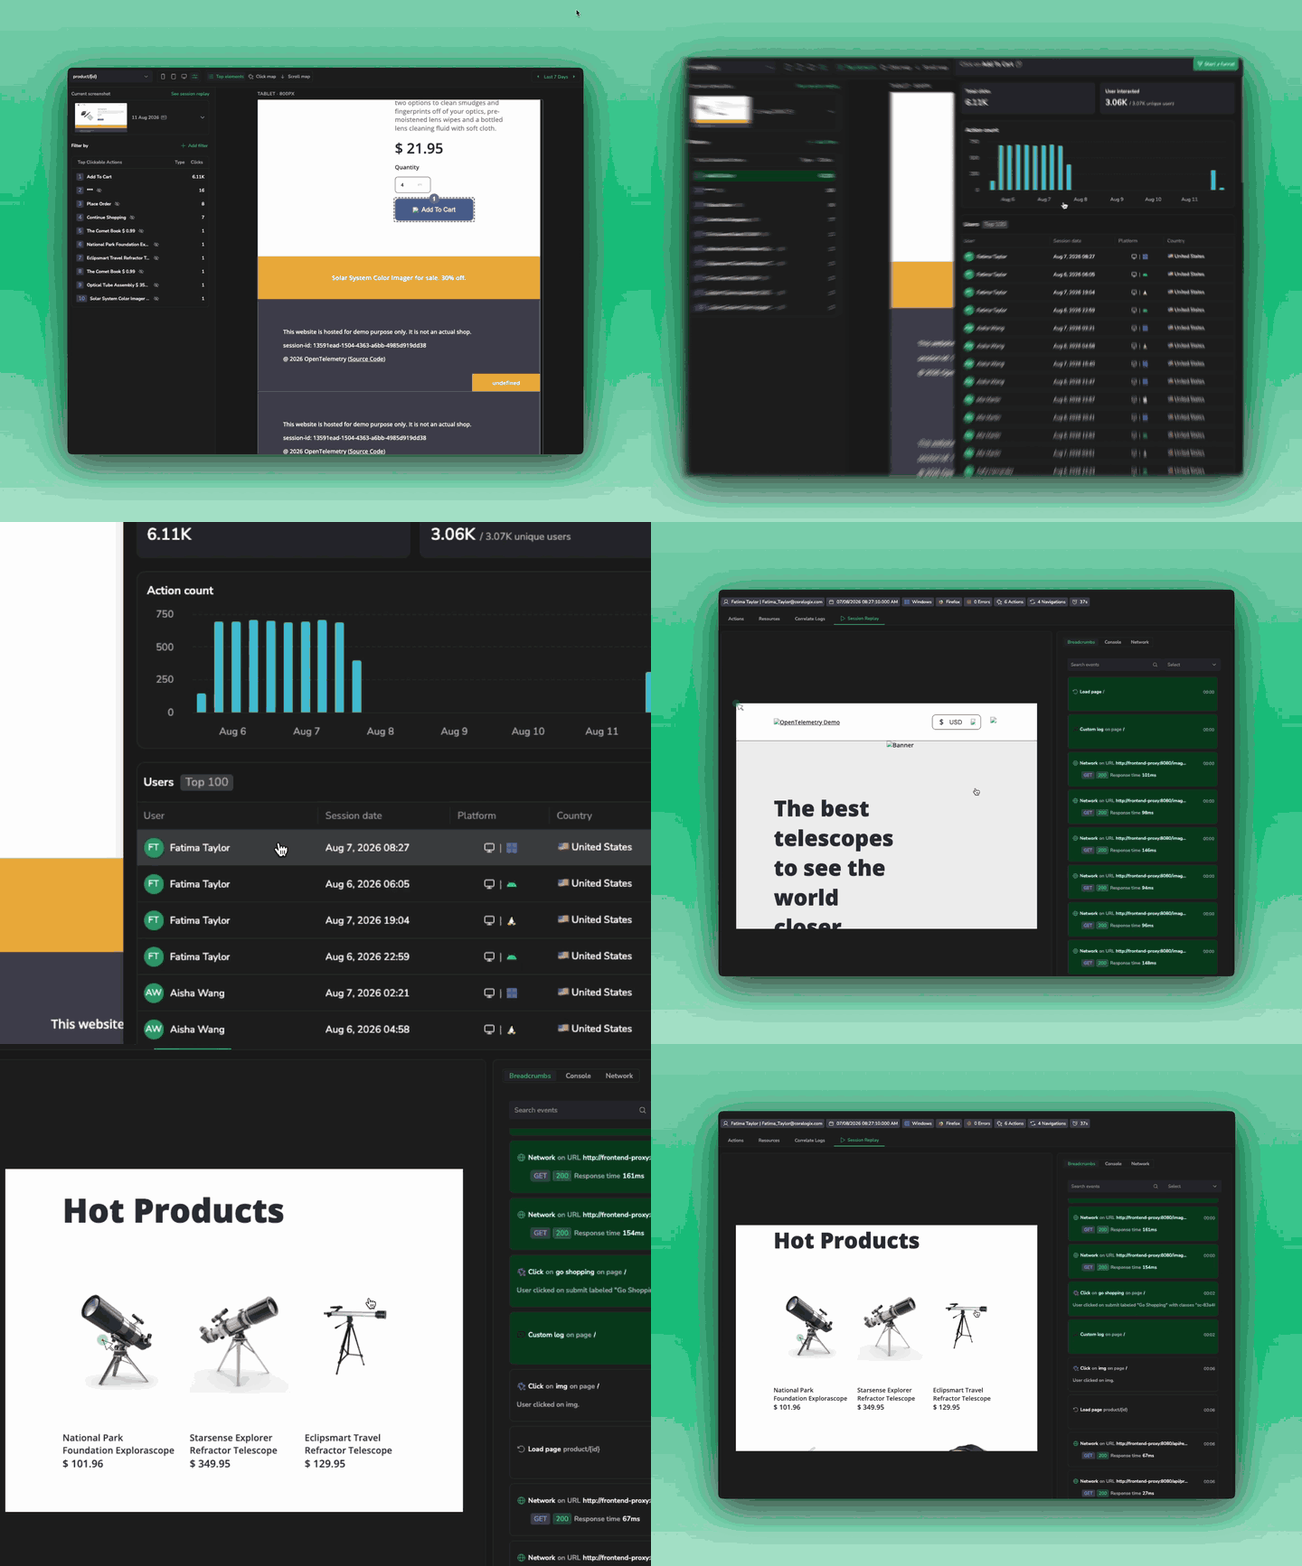
The session joins the two halves. It shows the errors that user hit, and those errors open the traces, logs, and metrics from the backend they were talking to. The chain runs from a conversion rate, to the people it lost, to the session one of them had, to the error that ended it, to the service that threw it. No exports, no joining on a user ID by hand, and no argument about whether the two tools count the same thing.
Why run product analytics on telemetry?
Because your telemetry is the most accurate record your business owns, and it is already complete.
Marketing analytics tools answer behavioral questions from a sampled, tag-based dataset nobody can verify against anything. When the funnel and the monitoring dashboard disagree, and they will, nothing settles it. Two teams hold two numbers, and the meeting turns into a debate about instrumentation instead of the product.
Running those questions on RUM sessions removes the seam. The funnel and the error are the same event stream, captured in full rather than sampled, so a product manager reading a drop-off and an engineer reading a stack trace read one dataset from two directions. Product analytics stops being a separate discipline with separate data and becomes another way to query telemetry you already trust enough to page someone at 3am.
The telemetry data lake underneath
Behavior is the newest signal to arrive in the growing Telemetry Data Lake. Logs, metrics, traces, sessions, errors, and security events are joined into a single flow that explains precisely what a user did, and now, what cohorts of users did over time. Every analytics tool you buy is another copy of your customers’ behavior on someone else’s disk, under someone else’s retention policy, and someone else’s rules about what you can take with you. This one adds no copy. By deriving these insights from your existing telemetry, Coralogix brings value that compounds over time, from every gigabyte held in your own cloud object storage.
Do I need to change how I integrate?
No. Product Analytics reads the events your RUM SDK already sends, so once your team has it enabled it populates on its own. No second SDK, no tag manager, no new pipeline.
It does expect a reasonably recent SDK, so check yours against the minimum for each platform before you go hunting for missing data.
How to try it
Product Analytics is available now for early-access customers. Talk to your account representative or Coralogix Support to switch it on and confirm your organization meets the feature criteria. Once it is on, you will find it at the top level of the left navigation, alongside RUM.
Where to go next:
- The Product Analytics platform page for the three views and what each one answers.
- The introduction for how Product Analytics sits on top of RUM, and the getting started guide for the data model, the SDK versions, and element naming.
- One page per view: heatmaps, funnels, and pathways.
Your behavioral data and your root cause data were always the same telemetry. Now they are the same product.