How iGaming operators connect revenue metrics to the operational telemetry

Global iGaming gross gaming revenue reached $115 billion in 2026, twelve percent up on the year before. A growing number of iGaming operators run on Coralogix, and what they use it for has moved well past uptime. Soft2Bet powers ninety percent of its internal dashboards from Coralogix and treats it as the single source of truth for real-time performance, feature health and user impact.
A powerful debug flow for iGaming operators
This flow was taken from one of our demo environments, that showcases iGaming telemetry from various sources, like AWS instances, application logs, OpenTelemetry spans and metrics, eBPF profiles and more. It begins with a high level problem, not even an error, and directly connects to the deepest possible operational telemetry available. Let’s begin.
What are your players doing?
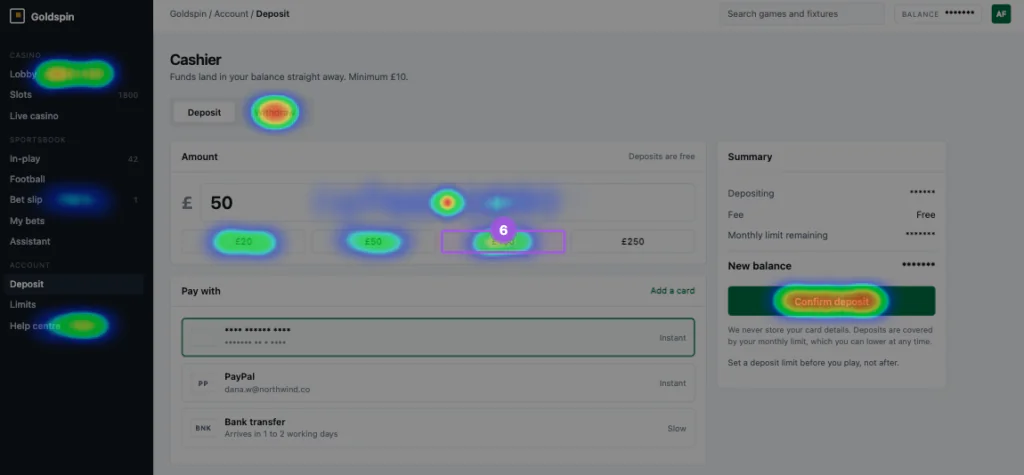
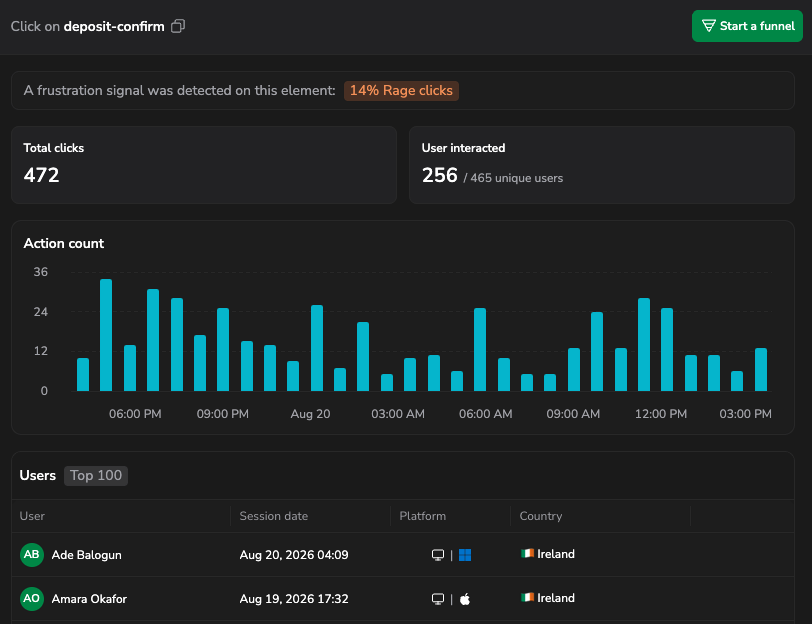
Product Analytics has discovered a disturbing user trend – 14% of the clicks for deposits are badged as rage clicks. Rage clicks are repeated rapid clicks on one element, indicating frustration, but not necessarily an error. This is a signal often missed by observability platforms, that prioritise concrete errors over softer signals of a poor gamer experience.
Going session by session
Coralogix brings together two different disciplines here; the first is around user experience tracking, typically the domain of product or marketing teams, and the second is one of root cause analysis. In a single click, Coralogix Product Analytics jumps from a high level heat map, showing the location of rage clicks over time, to a list of every single user impacted by the poor user experience.
What that player actually saw
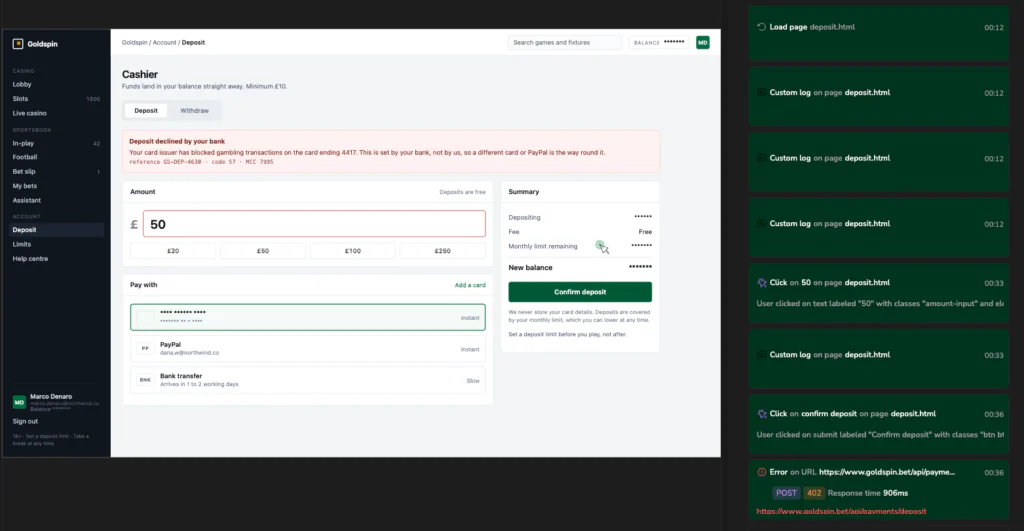
Session Replay plays the session back. The player attempts to deposit 50 GBP, presses Confirm deposit, waits, presses it three more times, drops to a twenty, presses again, switches to PayPal, presses again, switches to bank transfer, presses again, then goes looking for the help center. We are seeing the root cause of the user frustration in realtime.
Sessions stream to your own cloud object storage without sampling or indexing, and the SDK masks sensitive fields at the source, so card numbers, balances and identity never enter the pipeline while the behavior stays fully visible. For an operator under PCI DSS obligations on the same page, this feature is ready to give unprecedented insight while remaining compliant.
An error in the browser
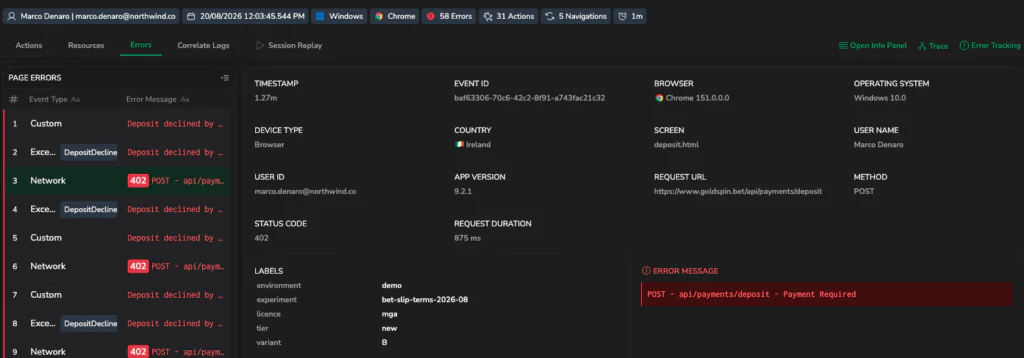
A 402 error has been attached to the session, and it points to a clear root cause. This opens a new thread to the investigation that takes us away from the front end. Most front end network errors have their origin somewhere in the depths of the backend system. This is where we’re going.
Tracing the error into the backend
This network error has a native connection to a downstream trace. Coralogix supports native, end to end, OpenTelemetry tracing, with header propagation from front-end sessions, through backend sessions, with support for OTel span links for asynchronous architectures. By opening the trace, we see precisely how this session behaved on the backend.
edge-gateway takes POST /api/payments/deposit and hands off to wallet-service, which reads the player’s monthly limit out of Postgres and then calls compliance-service. Compliance runs the KYC check and scores the transaction through fraud-model against a deposit-velocity model, returns clear, and wallet-service calls payments-adapter to authorize. payments-adapter opens a client span to the acquirer, and the acquirer refuses.
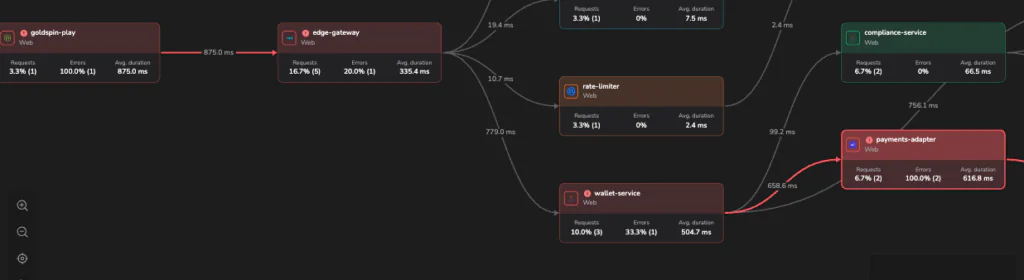
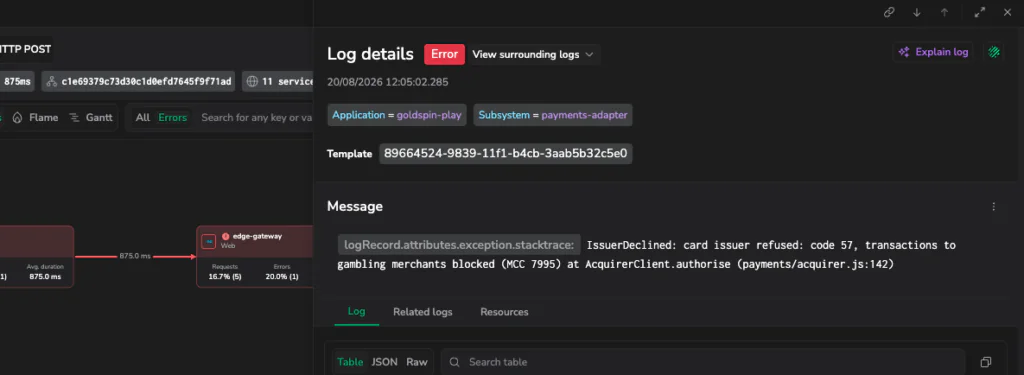
However, in this case, the payments-adapter ran into an error, and thanks to the correlated nature of Coralogix tracing, we can see the attached error logs, that reveal the root cause. A bank decline for gambling merchants.
The final step – business impact
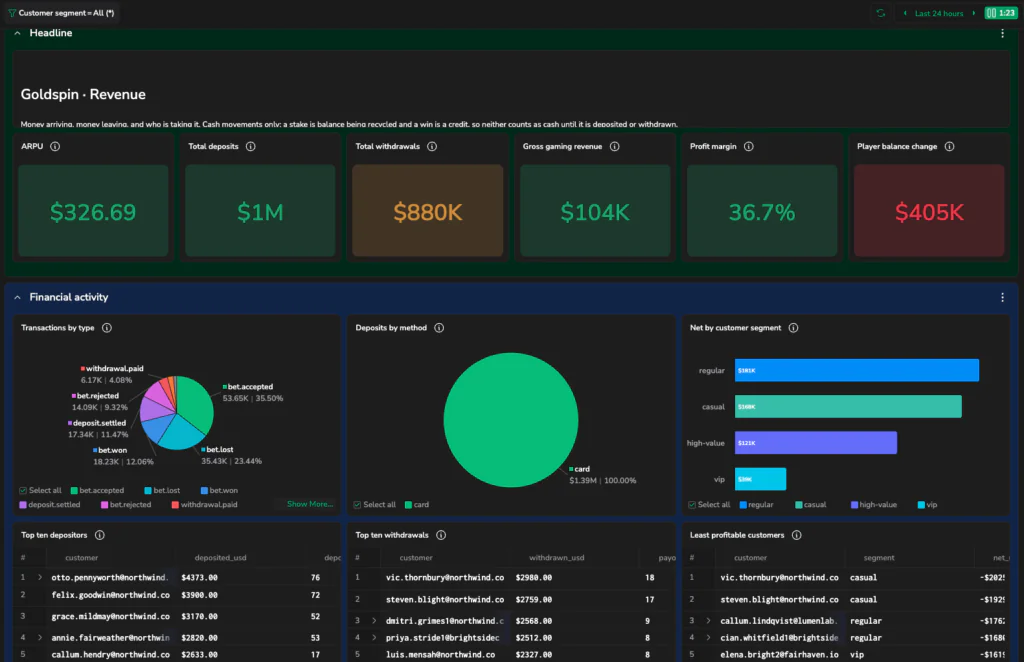
When all of this has been assessed, we have one final question to ask. Is this a widespread issue? What is the impact to our business? This is a deeply bespoke question, which is why Coralogix offers custom dashboards, that can derive core business insights from low-level telemetry.
Is there an easier way to do this?
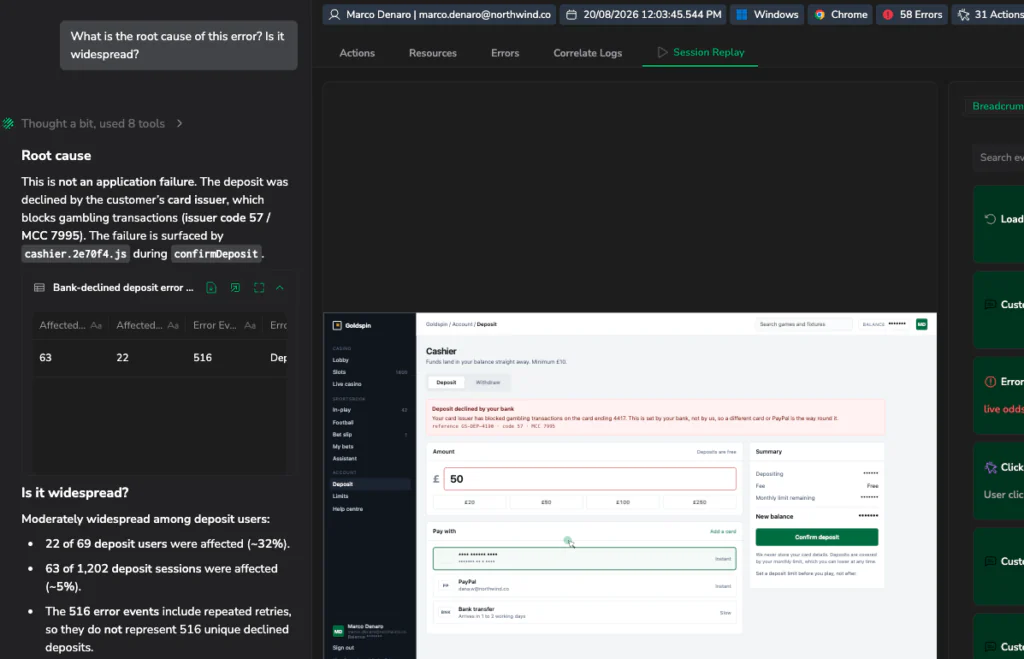
If we go back to the beginning of this investigation, we saw a RUM session that had problems. There is a much simpler strategy – Using CMD+I and asking Olly. Using Olly, we can ask both the business impacting question and the root cause analysis. Olly figured the exact problem out in around 35 seconds. It automatically walked the traces, and aggregated the values, to figure out how many users have been impacted by this bug, as well as calculating the overall cost impact.
Coralogix connects the customer to the code
Using errors to inform investigation is a good start, but as observability transforms into decision intelligence, user experience should be just as a strong a signal as any front end error. The ability to directly correlate between poor user experience and the entire journey of a request, including any errors and performance issues, is a profound step forward. Connecting all of that to business metrics helps operators see the full impact of an error, with both a microscope and a telescope – the business and the customer, in the same journey, viewed all at once.