Zero-effort alert migration from Prometheus to Coralogix


Having spent two decades in technical leadership, I’ve seen first hand what separates great development teams from merely good ones. It’s not about the number of features shipped or the elegance of the codebase — it’s about the ability to consistently deliver value to the customer through really great user experience. What I have seen is that a really effective way to do that, at scale and under pressure, is to make observability a first-class citizen and build a culture of observability through ownership.
But here’s the problem: most development teams treat observability as a technical checkbox. They deploy Prometheus, wire up some dashboards, toss a few alerts into Slack and then move on. They forget why they’re doing it. They lose sight of the user. I am writing this to tech leads, engineering managers, senior developers and SREs who want to fix that. This is about reconnecting metrics to meaning. It’s about SLIs, SLOs and SLAs to build systems that aren’t just reliable, but that earn customer trust. And it’s about how Coralogix can support that mindset — seamlessly.
Start with the why: It’s about really great value-based user experience
Every business whether it’s delivering personal services or enterprise infrastructure, solves a problem for which customers are willing to pay. That transaction — of value exchange for trust — starts and ends with user experience.
As an end user, I don’t care about your tech stack or your architecture. I care that the service is there when I need it. That it works. That it feels fast and reliable. And when it doesn’t, I notice.
The most successful companies internalize this truth. They prioritize user experience in every engineering decision, every product iteration and every operational investment. They align their telemetry not to what’s easy to measure, but to what the customer feels.
And this is where SLIs and SLOs shine.
What are SLIs, SLOs and SLAs — Really?
Service Level Indicators: are metrics that reflect the reality of the user experience. Think: error rates, latency percentiles and availability ratios.
Service Level Objectives: are targets the development team sets internally that define acceptable performance. Think: “99.9% of requests succeeded over 30 days”
Service Level Agreements: are contractual promises to the customer often tied to credits or penalties. This is where Senior Leadership really takes notice of things…
If Service Level Indicators are the pulse of your system, Service Level Objectives are the boundaries of good health. And Service Level Agreements are what you sign up to deliver. None of these mention tech stacks or infrastructure. Again, the focus of the development team is to deliver value to the customer through user experience.
Often it is the case that development teams jump straight to alerting without ever defining what “good enough” means. But once you define Service Level Objectives, everything changes. Alerts become cleaner. The development team feels empowered.
And the customer experience becomes observable, measurable and most importantly — manageable.
OpenTelemetry’s principles
OpenTelemetry’s standardization of metric generation and export is crucial for declarative recording and alerting rules, aligning with its principles of portability, tooling-agnosticism, observability and declarative infrastructure. This declarative approach enhances system resilience, auditability and evolution — especially for SREs and developers focused on modern observability. The key benefits include: precomputing metrics via recording rules for improved performance and alert reusability; and ensuring prompt responses to production incidents through alerting rules.
Storing these rules in Version Control provides traceability, fosters collaboration and enables automation — ultimately maintaining an open, portable, and future-proof system. This workflow supports rigorous code review processes, allowing alert and recording rules to be reviewed, discussed and tested like any other piece of infrastructure-as-code. This guards against common issues like missing durations or metrics that inadvertently cause cardinality explosions. Importantly, defining rules in YAML and storing them outside of a vendor’s UI prevents lock-in.
Designing observability around Service Level Indicators
So, let’s walk through how this looks in practice. Imagine if you will, a development team, for the fictitious ACME Financial LLC, is building an API that handles high volume financial transactions. From their discovery meetings, they have established what the customer cares about most:
- that the API request succeeds — availability
- that API request completes quickly — latency
- that any errors are rare — reliability
- that it scales under high load — saturation
From here, they derive Service Level Indicators, as Prometheus recording rules, that are reusable precomputed metrics that directly reflect what the fictitious ACME Financial LLC customers care about.
These metrics assume the development team’s services are instrumented with OpenTelemetry SDKs and metrics flow through the OpenTelemetry Collector, which exports them in Prometheus format. This is fully supported by Coralogix and documented in the Coralogix Prometheus integration
Availability: “Did the service respond at all?”
Service Level Indicator: Success rate
- record: job:http_success_ratio:rate5m
  expr: sum(rate(http_requests_total{status!~"5.."}[5m])) by (job)
        /
        sum(rate(http_requests_total[5m])) by (job)
This measures: The percentage of HTTP requests that are not 5xx errors. It reflects the overall service availability from the fictitious ACME Financial LLC customer’s perspective.
Latency: “Was the response fast enough?”
Service Level Indicator: P95 latency
- record: job:http_request_duration_seconds:95p
  expr: histogram_quantile(0.95, sum(rate(http_request_duration_seconds_bucket[5m])) by (le, job))
This measures: The 95th percentile of request durations. This helps ensure that the worst-case latency still meets our customer’s expectations. Most of the fictitious ACME Financial LLC customers will experience better-than-this latency.
Reliability: “What just happened?”
Service Level Indicator: Error rate
- record: job:http_5xx_error_ratio:rate5m
  expr: sum(rate(http_requests_total{status=~"5.."}[5m])) by (job) /
        sum(rate(http_requests_total[5m])) by (job)
This measures: The proportion of all HTTP requests that return a 5xx status code—indicating backend/server failures. A rising error rate signals reliability issues the fictitious ACME Financial LLC customers can feel immediately.
Saturation: “Is there something wrong with the Internet?”
Service Level Indicator: Saturation
- record: job:cpu_utilization:rate5m
  expr: 100 * (1 - avg(rate(node_cpu_seconds_total{mode="idle"}[5m])) by (job))
This measures: The percentage of CPU in use across nodes. A consistently high CPU usage indicates that the system is approaching saturation
- record: job:memory_utilization:rate5m
  expr: 100 * (1 - (node_memory_MemAvailable_bytes / node_memory_MemTotal_bytes))
This measures: The percentage of memory used. High memory saturation could lead to out-of-memory kills or degraded performance.
Both node_cpu_seconds_total and node_memory_* metrics come from OpenTelemetry’s hostmetrics receiver component, which emits system resource utilization data in a Prometheus-compatible format.
Define Service Level Objectives, Then alert!
Now the development team has defined Service Level Indicators, they can now establish Service Level Objectives, asking the question; “… what does good enough looks like”.
| SLI | SLO | Backed by Metric | Description |
| Success Ratio | >= 99.9% over rolling 30 days | job:http_success_ratiorate:5m | Ensures customers rarely experience failed requests |
| P95 Latency | <= 250ms over 5 minutes | job:http_request_duration_secondsrate:95p | Keeps tail latency low for 95% of customers |
| Error Rate (5xx) | < 0.1% over rolling 5 minutes | job:http_5xx_error_rationrate:5m | Detects critical backend issues quickly |
| CPU Saturation | < 85% average CPU usage over 5 minutes | job:cpu_utilizationrate: 5m | Helps avoid compute resource exhaustion. |
| Memory Saturation | < 80% average memory usage over 5 minutes | job: memory_utilizationrate:5m | Prevents memory pressure and OOM issues |
From here the development team can derive Service Level Objectives, as Prometheus alerting rules. That now references the Service Level Indicators that the development team established directly reflect what the fictitious ACME Financial LLC customers care about. That is a feedback loop whose sole purpose is to provide value to the fictitious ACME Financial LLC customers’ user experience.
Service Level Objective: >= 99.9% over rolling 30 days
- alert: LowSuccessRate
  expr: job:http_success_ratio:rate5m < 0.999
  for: 5m
  labels:
    severity: warning
  annotations:
    summary: "Success ratio dropped below SLO"
    description: "Less than 99.9% of requests succeeded over the past 5 minutes."
Service Level Objective: <= 250ms over 5 minutes
- alert: HighLatencyP95
  expr: job:http_request_duration_seconds:95p > 0.25
  for: 2m
  labels:
    severity: warning
  annotations:
    summary: "P95 latency exceeded threshold"
    description: "95th percentile latency is above 250ms over a 5-minute window."
Service Level Objective: < 0.1% over rolling 5 minutes
- alert: HighErrorRate
  expr: job:http_5xx_error_ratio:rate5m > 0.001
  for: 2m
  labels:
    severity: critical
  annotations:
    summary: "High HTTP 5xx error rate"
    description: "More than 0.1% of HTTP requests failed over the last 5 minutes."
Service Level Objective: << 85% average CPU usage over 5 minutes
- alert: HighCpuUsage
  expr: job:cpu_utilization:rate5m > 85
  for: 2m
  labels:
    severity: warning
  annotations:
    summary: "CPU usage exceeded SLO threshold"
    description: "Average CPU usage is over 85% in the last 5 minutes."
Service Level Objective: < 80% average memory usage over 5 minutes
- alert: HighMemoryUsage
  expr: job:memory_utilization:rate5m > 80
  for: 2m
  labels:
    severity: warning
  annotations:
    summary: "Memory usage exceeded SLO threshold"
    description: "Average memory usage is over 80% in the last 5 minutes."
The development team has defined their PrometheusRule resources.The screenshot below shows Prometheus Rules in the Prometheus UI for the following Recording Rule:
apiVersion: monitoring.coreos.com/v1
kind: PrometheusRule
metadata:
  name: service-level-recording-rules
  namespace: monitoring
  labels:
    prometheus: example
    role: recording-rules
    release: prometheus
spec:
  groups:
    - name: service-level.recording.rules
      rules:
        - record: job:http_success_ratio:rate5m
          expr: |
            sum(rate(http_requests_total{status!~"5.."}[5m])) by (job)
            /
            sum(rate(http_requests_total[5m])) by (job)

        - record: job:http_request_duration_seconds:95p
          expr: |
            histogram_quantile(
              0.95,
              sum(rate(http_request_duration_seconds_bucket[5m])) by (le, job)
            )

        - record: job:http_5xx_error_ratio:rate5m
          expr: |
            sum(rate(http_requests_total{status=~"5.."}[5m])) by (job)
            /
            sum(rate(http_requests_total[5m])) by (job)

        - record: job:cpu_utilization:rate5m
          expr: |
            100 * (1 - avg(rate(node_cpu_seconds_total{mode="idle"}[5m])) by (job))

        - record: job:memory_utilization:rate5m
          expr: |
            100 * (
              1 - (node_memory_MemAvailable_bytes / node_memory_MemTotal_bytes)
            )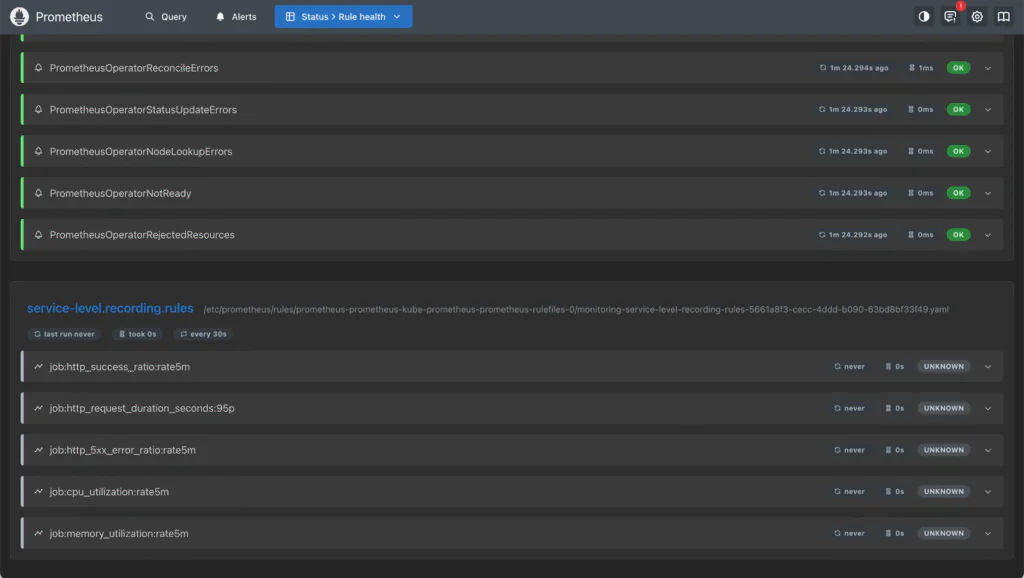
The screenshot below shows Prometheus Rules in the Prometheus UI for the following Alert Rule:
apiVersion: monitoring.coreos.com/v1
kind: PrometheusRule
metadata:
  name: service-level-alerting-rules
  namespace: monitoring
  labels:
    prometheus: example
    role: alert-rules
    release: prometheus
spec:
  groups:
    - name: service-level.alert.rules
      rules:
        - alert: LowSuccessRate
          expr: job:http_success_ratio:rate5m < 0.999
          for: 5m
          labels:
            severity: warning
          annotations:
            summary: "Success ratio dropped below SLO"
            description: "Less than 99.9% of requests succeeded over the past 5 minutes."

        - alert: HighLatencyP95
          expr: job:http_request_duration_seconds:95p > 0.25
          for: 2m
          labels:
            severity: warning
          annotations:
            summary: "P95 latency exceeded threshold"
            description: "95th percentile latency is above 250ms over a 5-minute window."

        - alert: HighErrorRate
          expr: job:http_5xx_error_ratio:rate5m > 0.001
          for: 2m
          labels:
            severity: critical
          annotations:
            summary: "High HTTP 5xx error rate"
            description: "More than 0.1% of HTTP requests failed over the last 5 minutes."

        - alert: HighCpuUsage
          expr: job:cpu_utilization:rate5m > 85
          for: 2m
          labels:
            severity: warning
          annotations:
            summary: "CPU usage exceeded SLO threshold"
            description: "Average CPU usage is over 85% in the last 5 minutes."

        - alert: HighMemoryUsage
          expr: job:memory_utilization:rate5m > 80
          for: 2m
          labels:
            severity: warning
          annotations:
            summary: "Memory usage exceeded SLO threshold"
            description: "Average memory usage is over 80% in the last 5 minutes."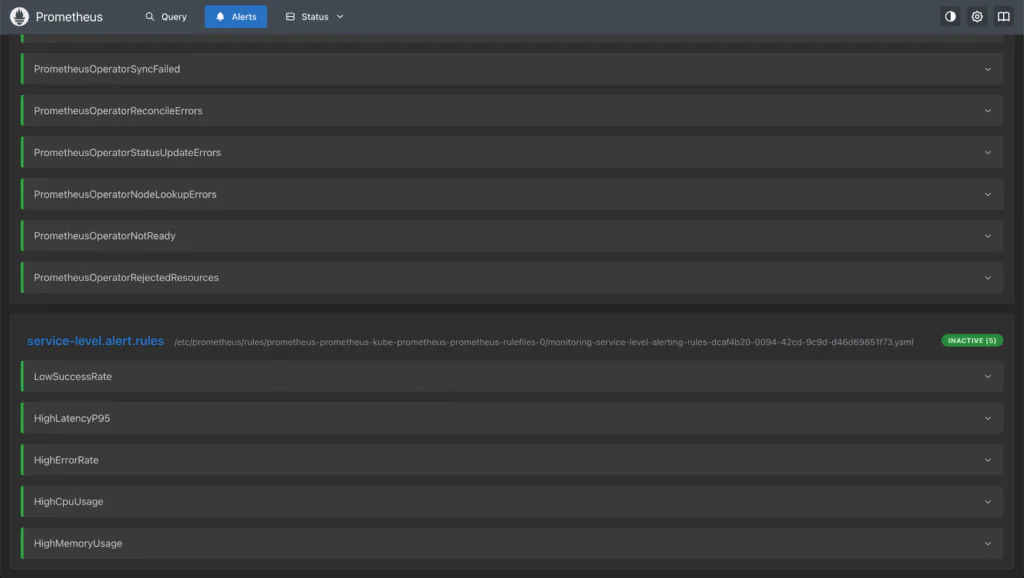
Structure for success: Use the Coralogix Operator
Coralogix’s Kubernetes Operator supports declarative observability. Our development team has defined our PrometheusRule resources and now they will label them appropriately. The Coralogix’s Kubernetes Operator picks them up, syncs them with Coralogix and provides full visibility.
Using kubectl the following commands label the Prometheus rules.
kubectl label prometheusrule [metadata.name] -n [metadata.namespace] \
  app.coralogix.com/track-recording-rules=true --overwrite

kubectl label prometheusrule [metadata.name] -n [metadata.namespace] \
  app.coralogix.com/track-alerting-rules=true --overwrite
When this command is run, the recording rules and alert rules are available within the development team’s Coralogix account.
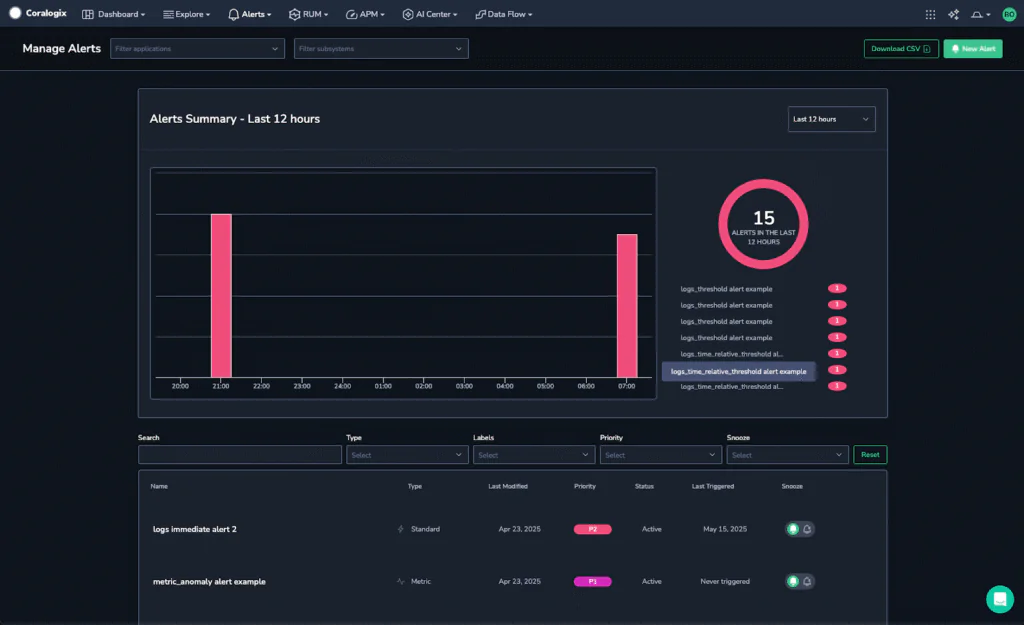
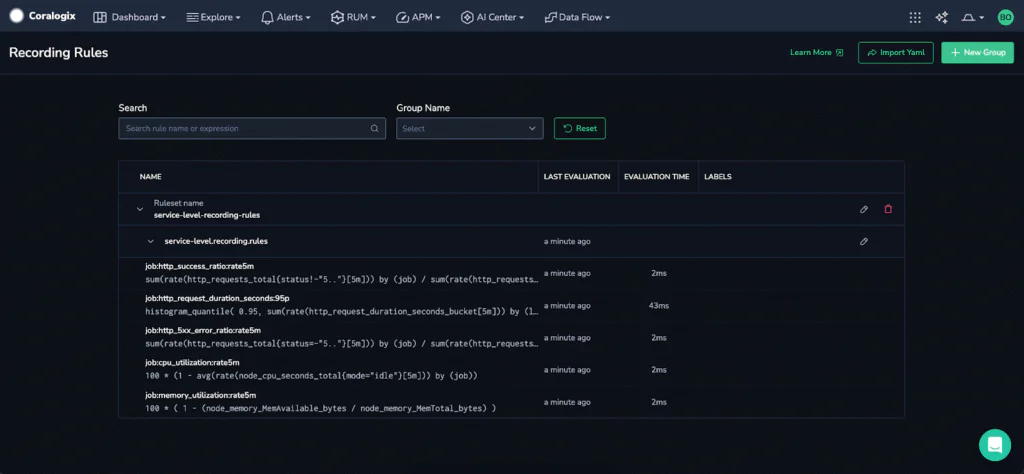
The screenshot below shows Prometheus Rules in the development team’s Coralogix UI for the Recording Rule:
The screenshot below shows Prometheus Rules in the development team’s Coralogix UI for the Alerting Rule:
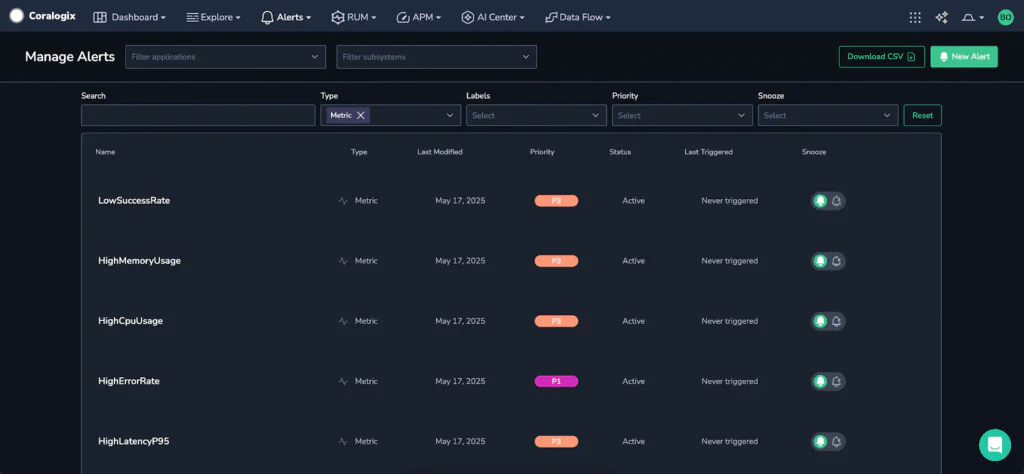
This is a zero-effort path for any development team wanting to surface their Service Level Indicators and Service Level Objectives inside Coralogix.
Why is this so powerful?
Coralogix provides a seamless integration for monitoring Service Level Indicators and Service Level Objectives without operational overhead. This eliminates the need to duplicate configurations, allowing development teams to visualize, correlate with logs and traces and act on Prometheus rules and alerts through Coralogix workflows, dashboards and alerting. As I said above, this approach aligns with OpenTelemetry’s vendor-neutral philosophy, promoting standardized and portable instrumentation and telemetry. By utilizing open and inspectable telemetry formats and tooling, particularly Prometheus for metrics, development teams avoid proprietary alert definitions. OpenTelemetry is the antidote to corporate ransomware.
The development team’s declarative YAML-based Prometheus recording and alerting rules, stored in version control, offer the team several advantages:
- Transparency: Full visibility into what is measured and alerted.
- Traceability: Version Control tracks all changes, enabling reviews, approvals and rollbacks.
- Portability: Rules can be deployed across different environments and platforms.
- Reusability: Rules can be applied to dashboards, alerts, and automation pipelines.
The open-source nature and widespread adoption of Prometheus, along with its native support in the OpenTelemetry Collector, make it an excellent choice for organizations adopting open standards. Integrating this with Coralogix’s Kubernetes Operator combines the flexibility of Prometheus and OpenTelemetry with Coralogix’s deep correlation and operational insights.
This architecture ensures scalable, standardized and platform-agnostic observability, delivering robust production-grade insights and empowering development teams to confidently deploy reliable systems with maintained control.