Stop Guessing Why Your Pods Are Crashing


Kubernetes dashboards often mask a systemic infrastructure failure. When a critical Java service fluctuates and restarts, the post-mortem often confirms an Out-of-Memory (OOM) event. While CPU metrics appear healthy, memory has silently hit a ceiling, forcing the kernel to terminate the process.
The Operational Failure
Traditional metrics are lagging indicators. They report the memory climb, but cannot identify the offending line of code. Manual heap dumps fail as a production strategy. This is because the pod either crashes before the dump triggers, or the dump’s overhead causes the failure. The result is a governance gap where performance issues only surface after affecting users.
The Code-Level Infrastructure Gap
Relying solely on CPU profiling creates a strategic visibility void. While high CPU load indicates execution stress, it does not explain OOMKilled errors or the steady growth of a memory footprint. This one-dimensional focus misses allocation-driven pressure, which is the actual catalyst for memory exhaustion and its subsequent latency spikes.
Without visibility into memory allocations, platform teams cannot govern the pressure exerted on the JVM. Managing modern distributed infrastructure requires a multi-dimensional approach that pivots between CPU execution and memory allocation to identify the code-level intent behind infrastructure failure.
Governing Production Memory
To bridge the code-level visibility gap, Coralogix has expanded its Continuous Profiling suite to include Java Allocation Profiling. The initial release focuses on Java and other JVM languages (inc. Scala, Kotlin, and any JVM languages) allocation profiling; additional runtimes/profile types will follow. Distributed production environments require a profiling mechanism that avoids the heavy, stop-the-world overhead common in legacy approaches, or is designed for production use without the intrusive overhead of heap dumps. Those legacy approaches often induce the actual performance failures they are meant to diagnose.
Production-Safe Instrumentation
The Coralogix SDK provides a production-ready path to continuous allocation visibility. Integrating with the industry-standard Async Profiler enables deep, thread-level visibility into allocation rates. This production-first architecture makes continuous production profiling feasible with recommended settings. This ensures memory pressure is managed before it escalates into system-wide failure.
Code-Level Resource Accounting
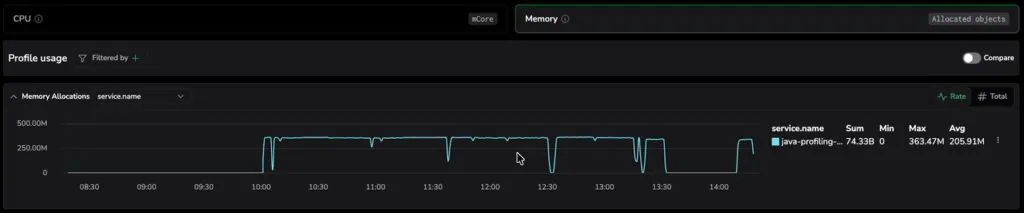
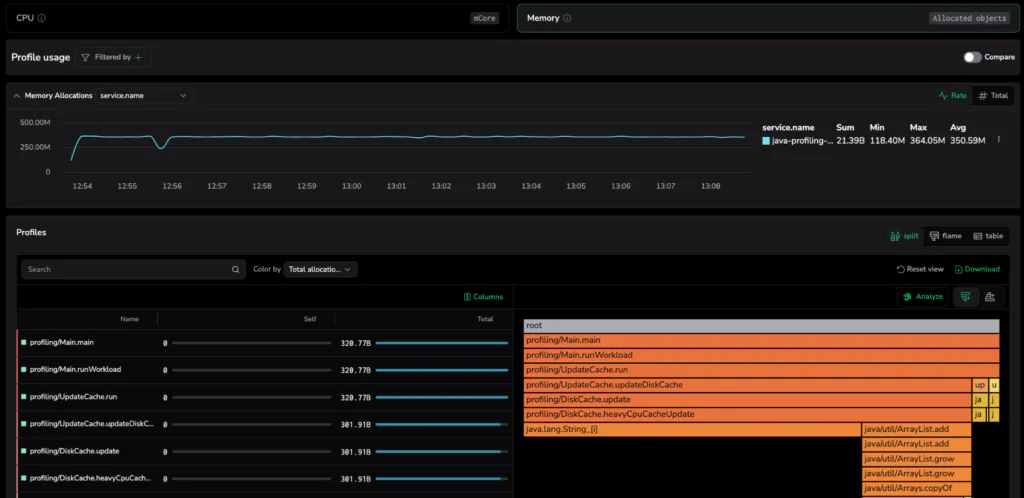
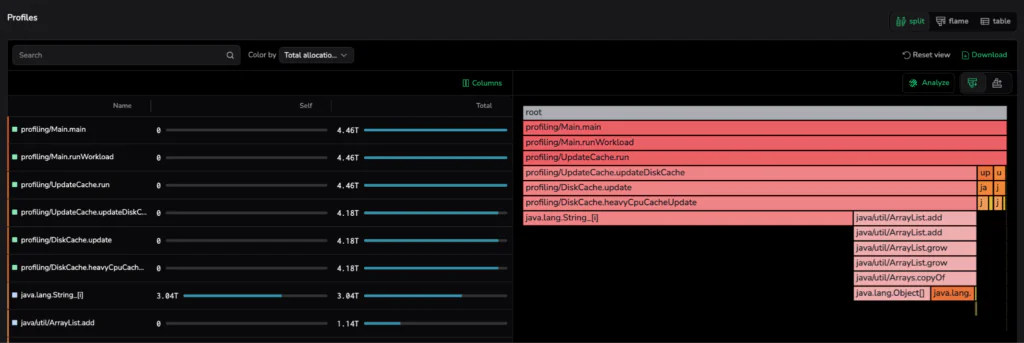
Standard metrics report the total memory footprint, but lack the granularity required for resource accounting. Coralogix profiling surfaces the allocation rate over time, moving beyond aggregate totals to pinpoint the specific methods driving infrastructure pressure. This shift transforms memory management from reactive observation into precise diagnostics, pinpointing the specific methods driving allocation spikes.
Governing Production Resilience
High-scale enterprises move beyond aggregate metrics, using code-level insights to govern critical pod restarts and neutralize slow-growing memory leaks. This granular visibility allows teams to eliminate allocation hot spots before they trigger system-wide failure.
Operational Failure: The 48-Hour Crash Cycle
A high-scale content delivery platform experienced recurring OOMKilled events on a specific 48-hour cycle. Standard metrics reported a gradual memory climb, but the “noise” of production traffic rendered traditional heap dumps ineffective for root-cause analysis.
They deployed continuous memory profiling, and the SRE team identified the specific allocation-driven pressure responsible for the growth. The Flame Graph surfaced a legacy logging utility generating an excessive object volume that eventually saturated the heap. Identifying this code-level intent allowed the team to resolve the leak and restore cluster stability without inducing the overhead of manual diagnostic tools.
Resolving Allocation-Driven Latency
A real-time logistics provider experienced intermittent 2-second latency spikes that bypassed standard CPU-based alerts and log-level error tracking. This failure was not a memory leak, but allocation-driven pressure. In other words, a massive volume of object churn caused millions of temporary objects to flood the heap during specific tracking updates.
This rapid creation and destruction of memory consumed available resources, triggering aggressive GC cycles and the resulting latency spikes that compromised p99 metrics. Coralogix Continuous Profiling surfaced the specific method responsible, allowing the team to refactor the hot path and eliminate the infrastructure pressure without relying on deceptive CPU signals.
Optimizing the Hot Path
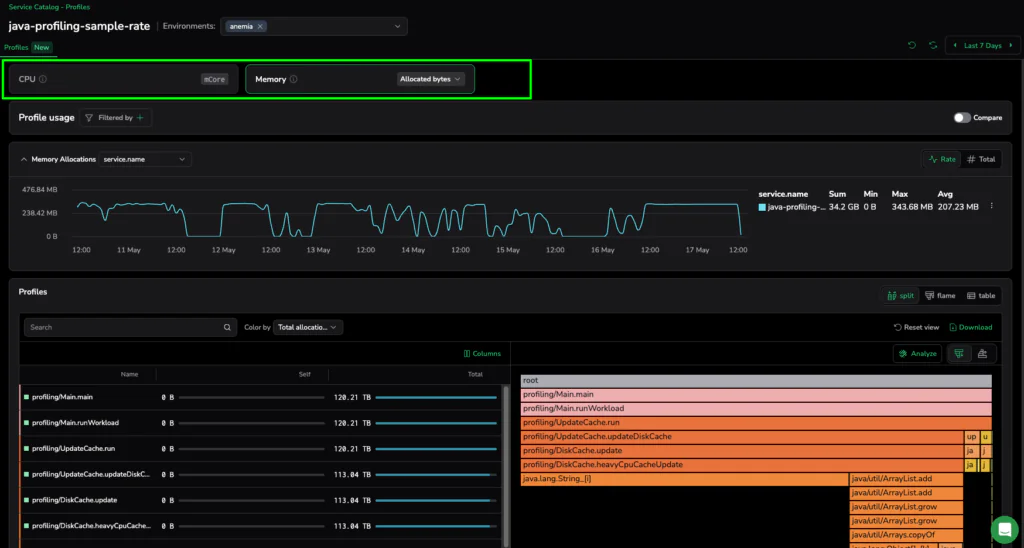
Flame Graph analysis reveals that the heavyCpuCacheUpdate method drives a disproportionate percentage of total allocations. Refactoring this single hot path to prioritize object reuse significantly mitigated allocation-driven pressure and eliminated the 2-second micro-stutters that compromised system stability.
The Strategic Roadmap for Memory Governance
This release establishes Java allocation profiling as a core capability for resolving the most frequent production stability failures. While the current focus addresses allocation hot spots and object churn, Coralogix is committed to expanding this control plane across additional runtimes and memory dimensions.
Our mission is always to provide the governance and code-level visibility required to manage modern, distributed production infrastructure.
Get Started with Java (JVM) Memory Profiling
To begin optimizing your Java application performance and stability, explore the Memory Profiling Documentation and book a demo to see it in real-time.