The new APM experience: every service monitored from day one, and ready for your AI agent

Coralogix APM has told you which service is behind the latency. From today, the new APM experience tells you what is behind the service: the release, the environment, or the query one layer down. It watches every service you run from the moment it appears, without anyone writing an alert. And everything you see on the screen, your AI agent can use too: in Olly, from the Coralogix CLI, or through MCP in your IDE.
A latency chart shows that something got slow. It doesn’t show whether it was your code, the deploy an hour ago, one environment, or the database underneath, and it only helps if someone set up the alert that sent you there and then opened the right screen. The new experience closes all three gaps.
What you get
- If you write the code: ask your coding agent, from your IDE, whether the service you’re changing is healthy in production, before and after you ship. It can run the Coralogix CLI or ask Olly through MCP. On screen, see in one chart whether your release changed anything.
- If you’re on call: every service already reports its health. The alert opens on the tab that is breaching, filtered to the window, with the threshold and the value that crossed it. Press Cmd+I and Olly already knows where you are.
- If you run the team: see what your team owns, what has no owner, and which services are sending no traces or profiles, across every team, from one definition of health.
There is nothing to roll out: no new SDK, no code change, and no database agent.
Built for your AI agent, too
You no longer have to open APM to use it. The answers you see on screen are there for the agents you work with:
- Olly. Press Cmd+I on any APM page and Olly opens with that page as its context: the service, the tab, the time range. Ask why a service is Critical, and it reads the same health policies you do.
- The Coralogix CLI.
cx service-cataloglists your services with their health, RED metrics and dependencies, in output built for scripts and agents. A pipeline can check a service’s health right after it deploys. - MCP. Connect the Coralogix MCP server to your IDE or coding agent. It can pull the live service dependency graph, and ask Olly about any service, before it writes a fix.

A person in the browser and an agent in a terminal get the same answer, from the same data.
Every service, monitored from day one
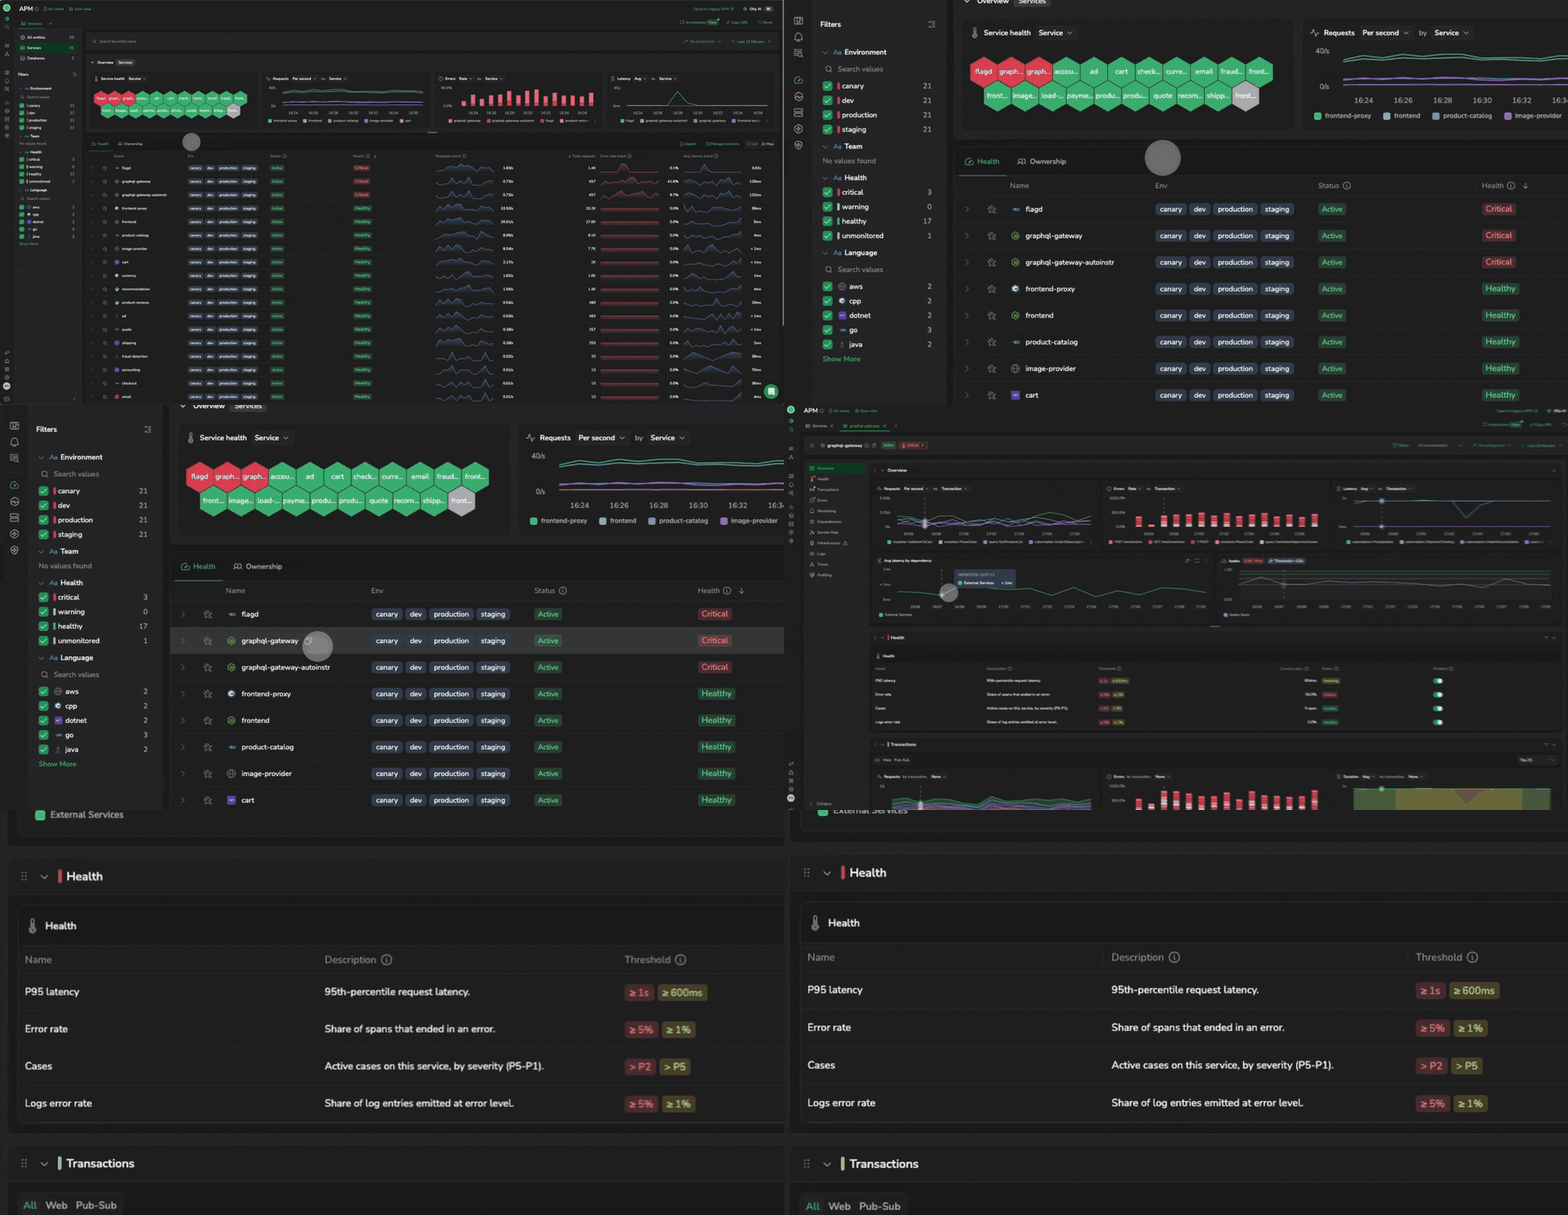
Every service reports its own health, from four policies Coralogix predefines: latency, error rate, cases and log errors. Nobody has to write an alert for a service to be watched, so nothing is left dark because no one got to it. Tune any policy on the service’s Health tab. The worst result wins: one Critical breach makes the whole service Critical.
From the alert to the cause
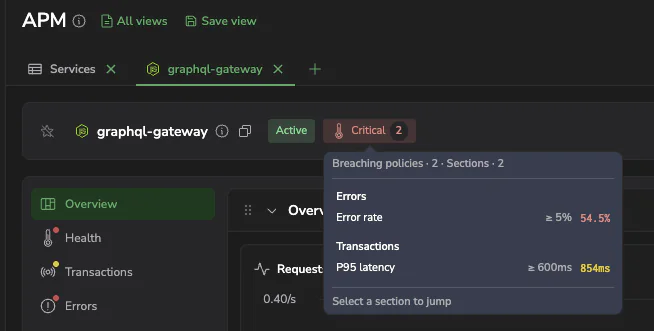
Open a critical service. The header shows a Critical chip with the number of breached policies. Select it, and you land on the tab that is breaching. For a log-error policy, that is the Logs tab, already filtered to the service and the window the alert covers. The Health table names each breached policy, its threshold, and the value that crossed it. There is no second tab to open and no trace ID to copy.
Was it the deploy?
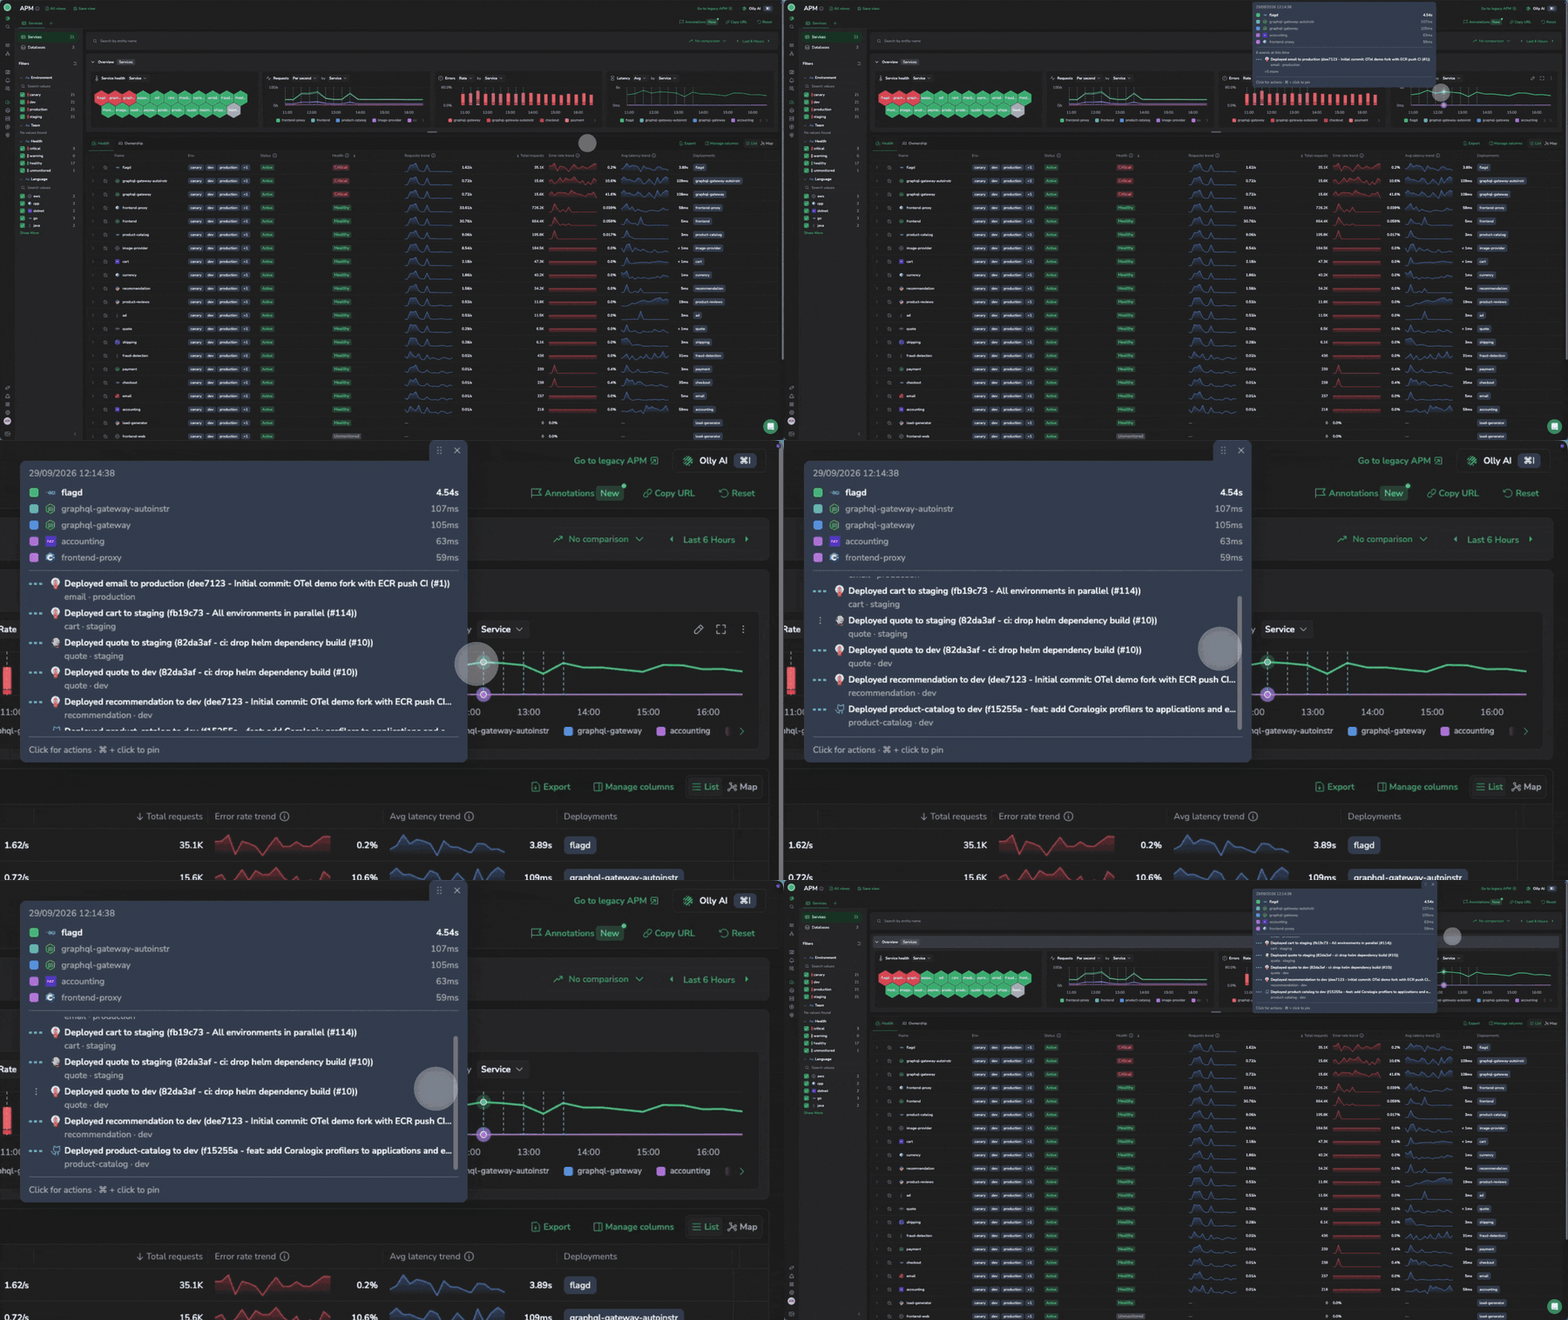
Every deployment from your CD pipeline appears as a marker on the service’s charts, so a spike in errors or latency lines up with the release that caused it. Whether you spot it or your agent does, the cause is one step away. Anything else you want on the same timeline, such as a feature-flag change or a marketing campaign launch, arrives the same way as a custom event.
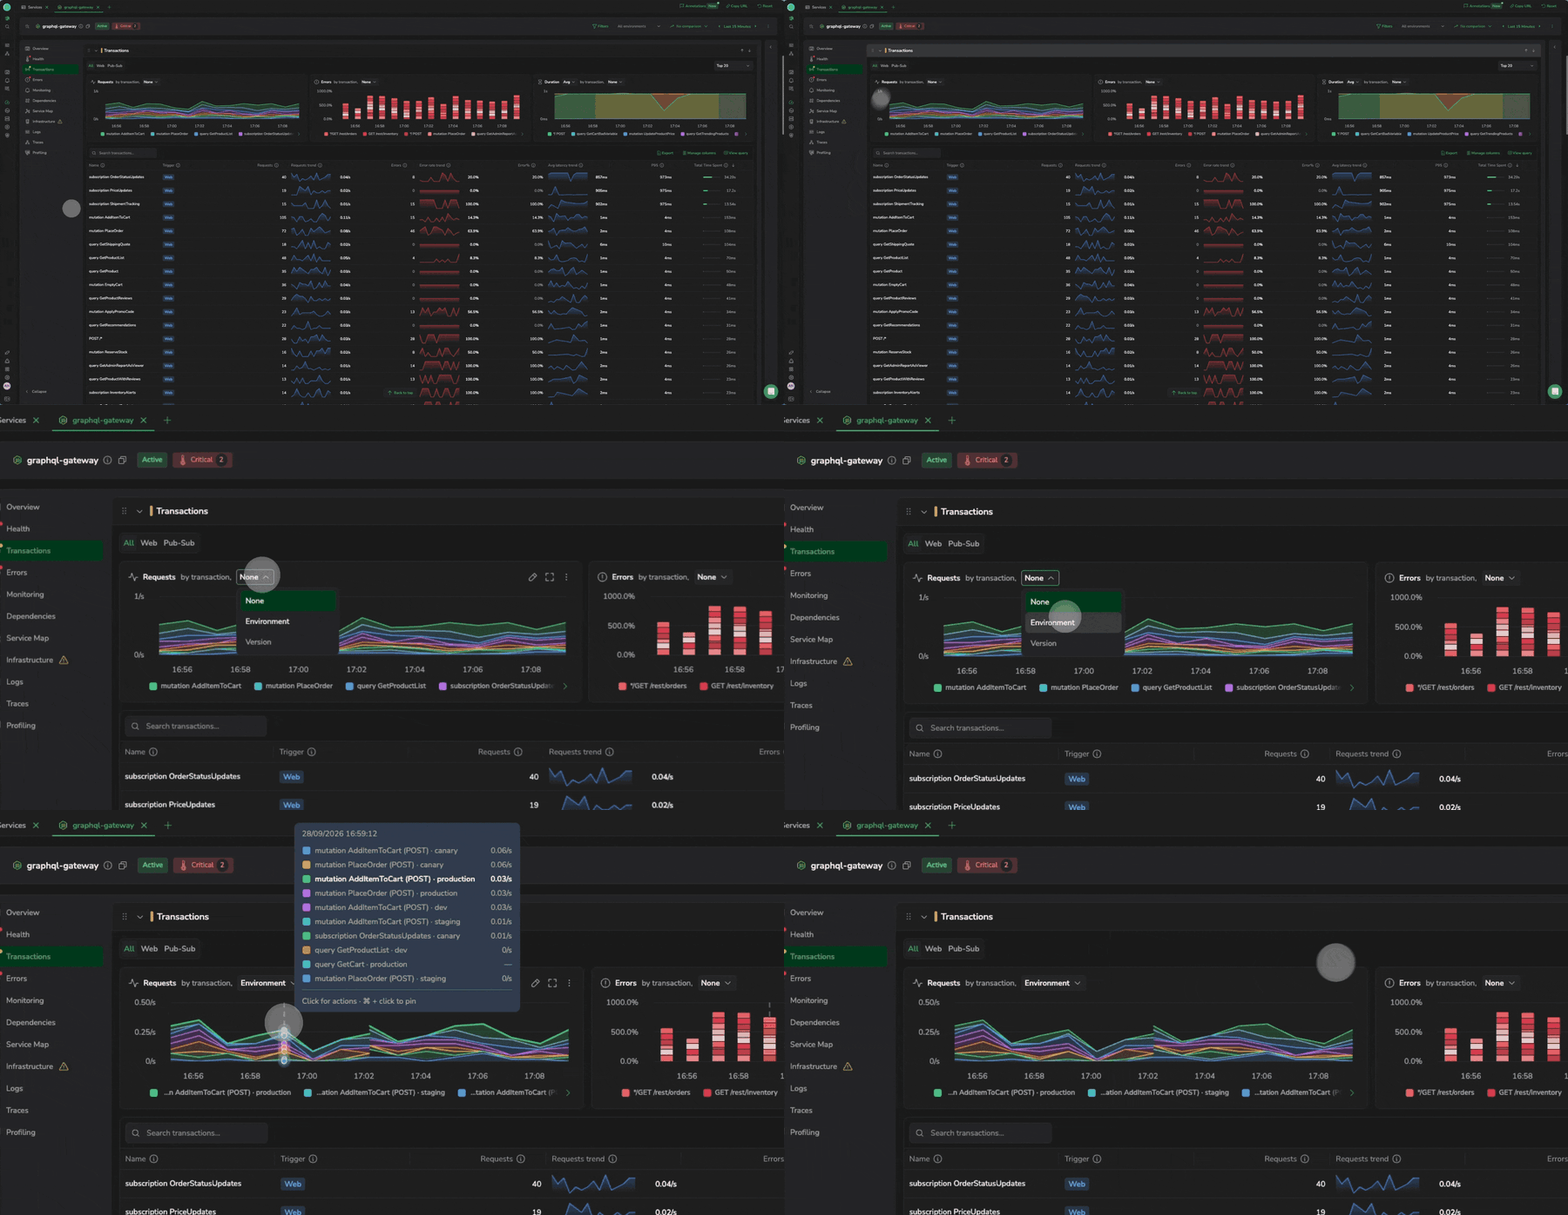
Then narrow the question from what is slow to what is carrying it. The Transactions tab splits its charts by transaction. Add version or environment as a second dimension and turn on Compare to, so yesterday sits beside today. A spike confined to one version points at a release. A spike across every version points at a shared cause, such as a dependency or a capacity limit.
Or the database?
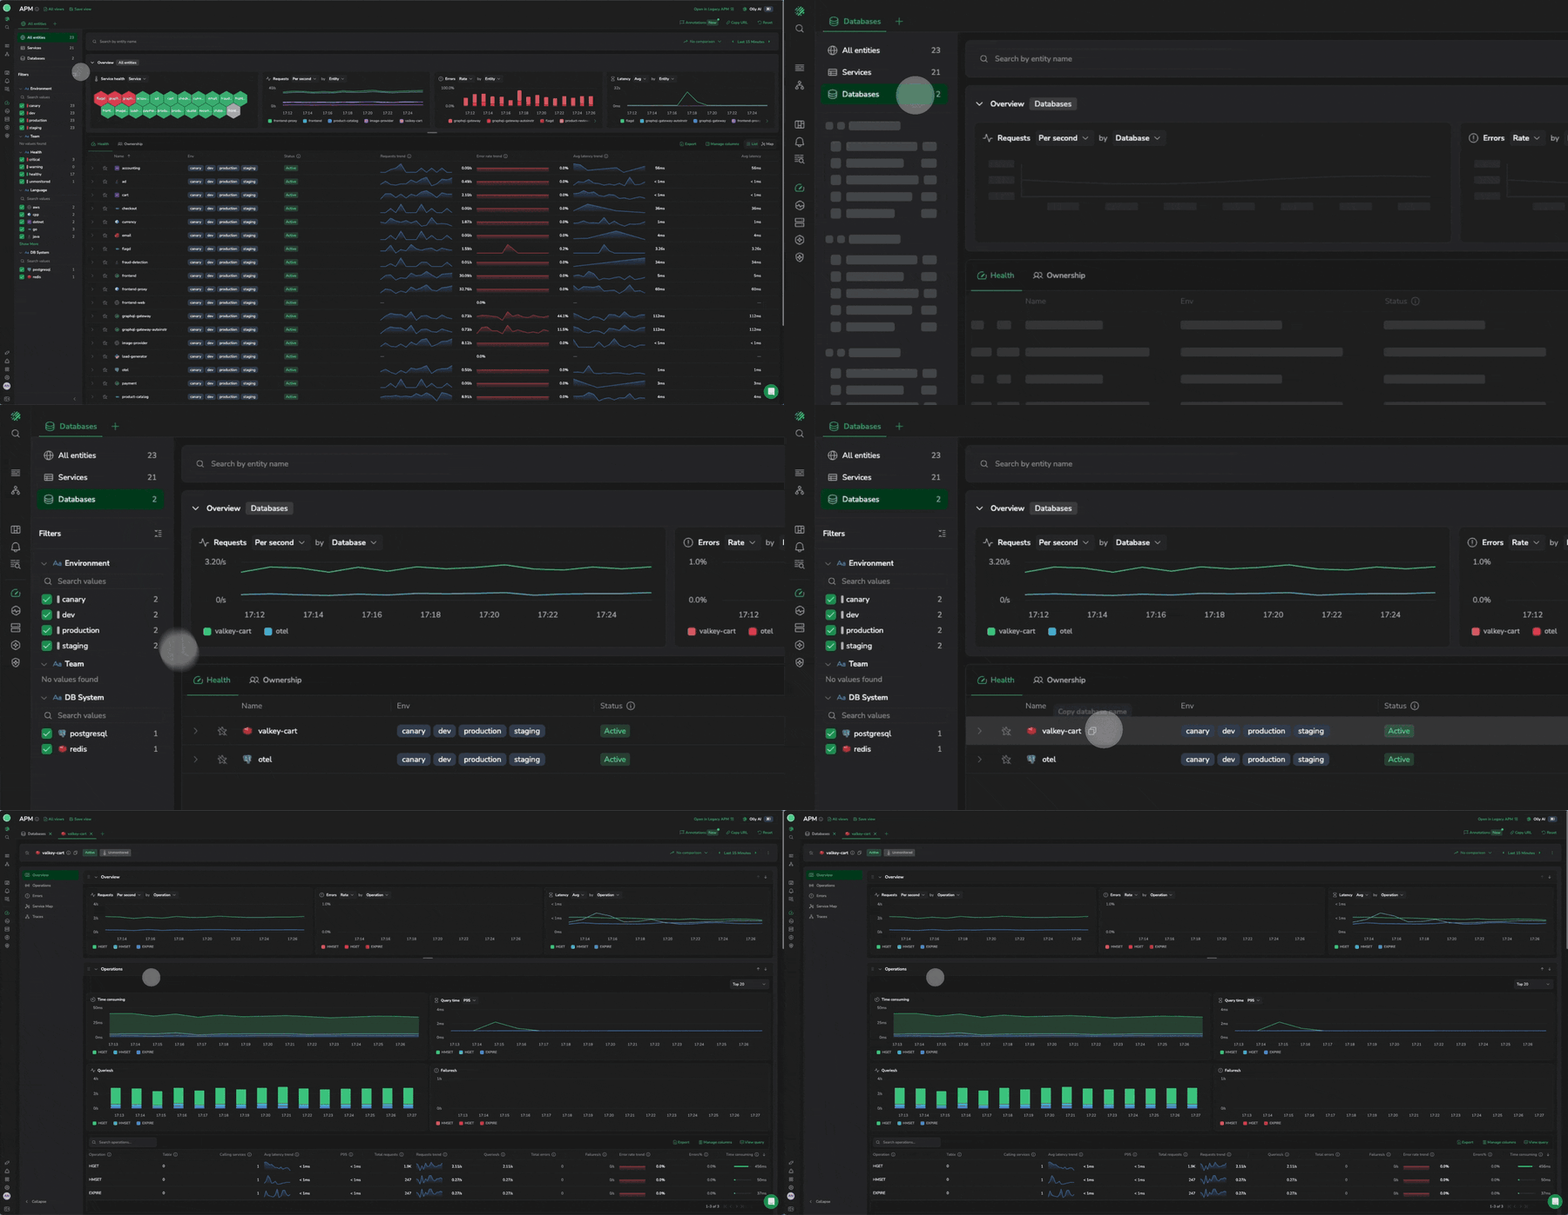
Follow the slow edge. Dependencies carries the investigation past the service’s own code to the external calls and databases it talks to, each with its own latency. Select a database and it opens as its own page in the same catalog, laid out the same way as a service.
There is no database agent to install. Rate, errors and duration come from the database client spans your services already emit, following the OpenTelemetry database conventions. A suspicion about the data layer becomes a row you can open.
Set up the investigation once
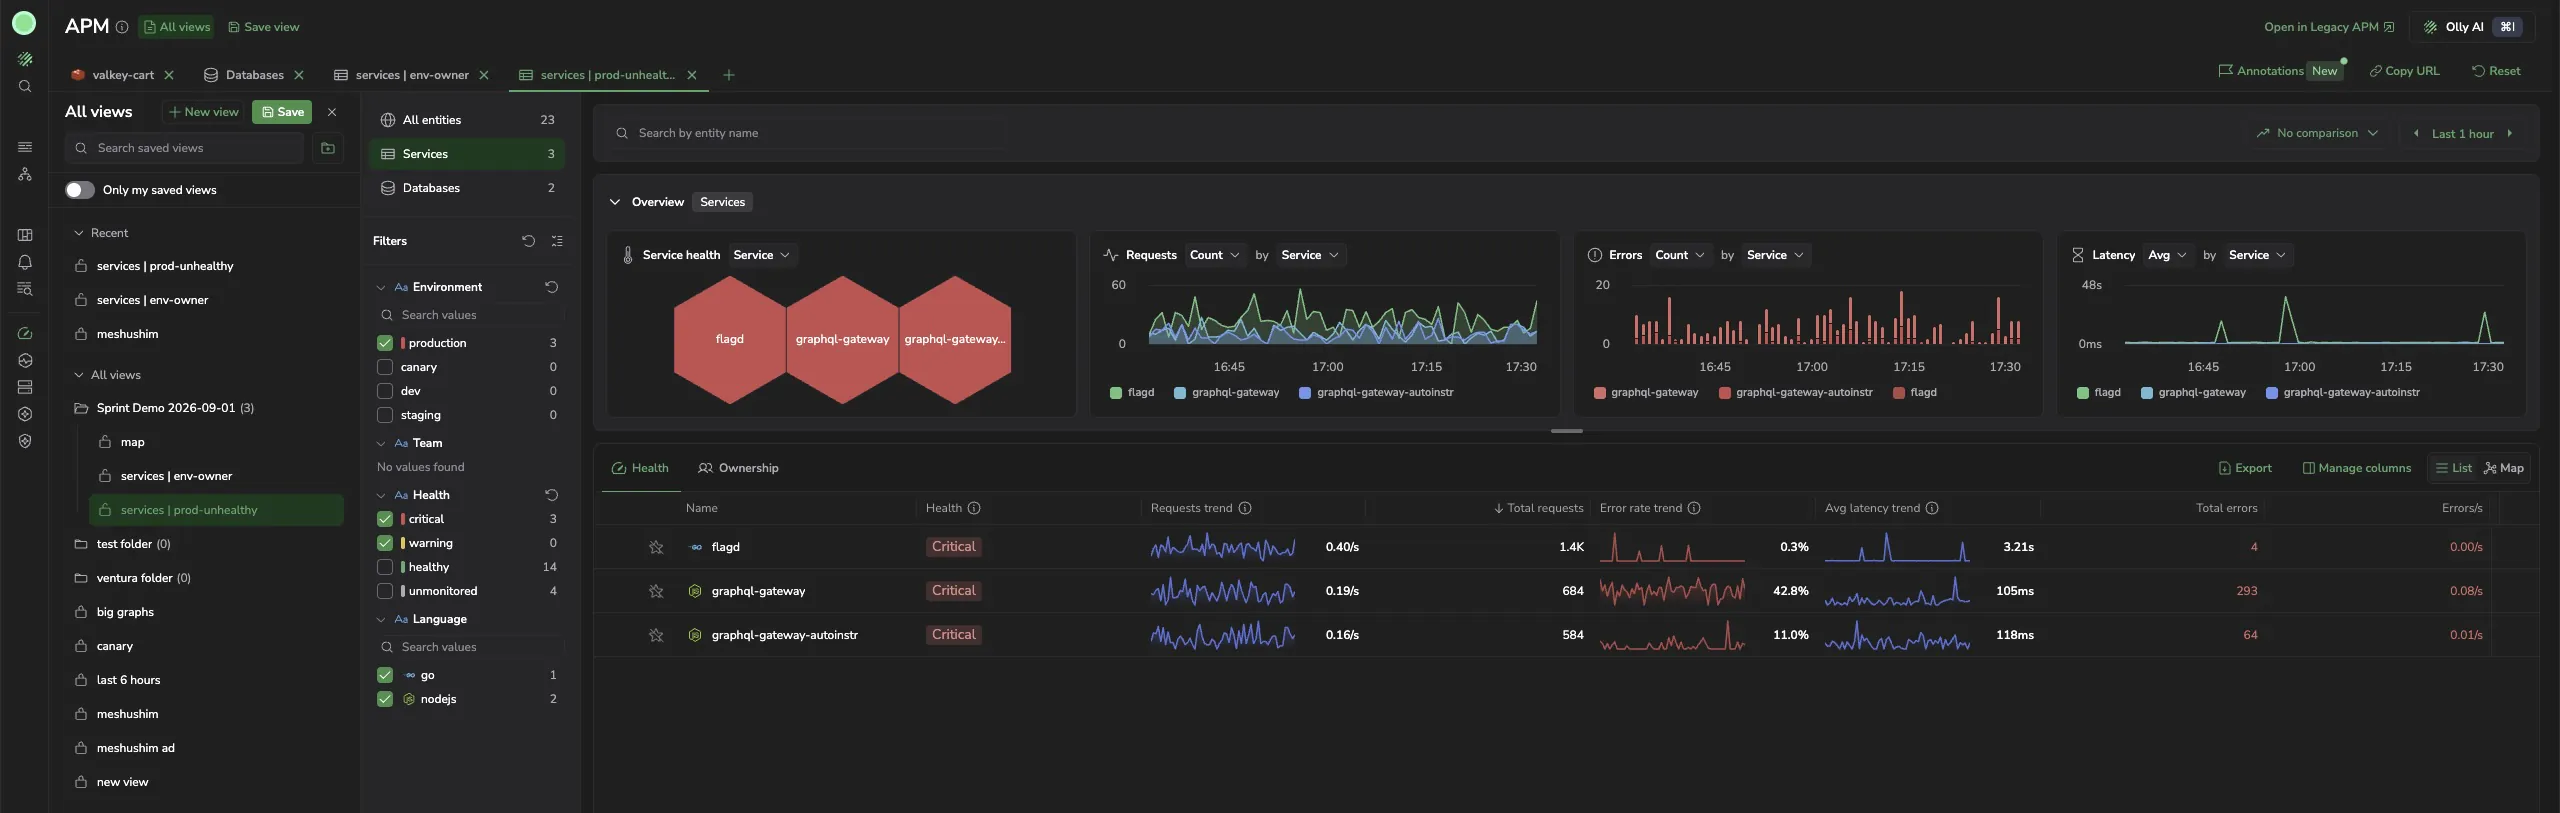
A saved view keeps the scope, filters, columns and comparison exactly as you left them. Save it, organize it in a folder, and share it by URL. Build the view your on-call engineer needs, filtered to production and set to health, and the next person paged opens the investigation instead of rebuilding it. Save it on a calm afternoon, not in the middle of an incident.
See what nobody owns
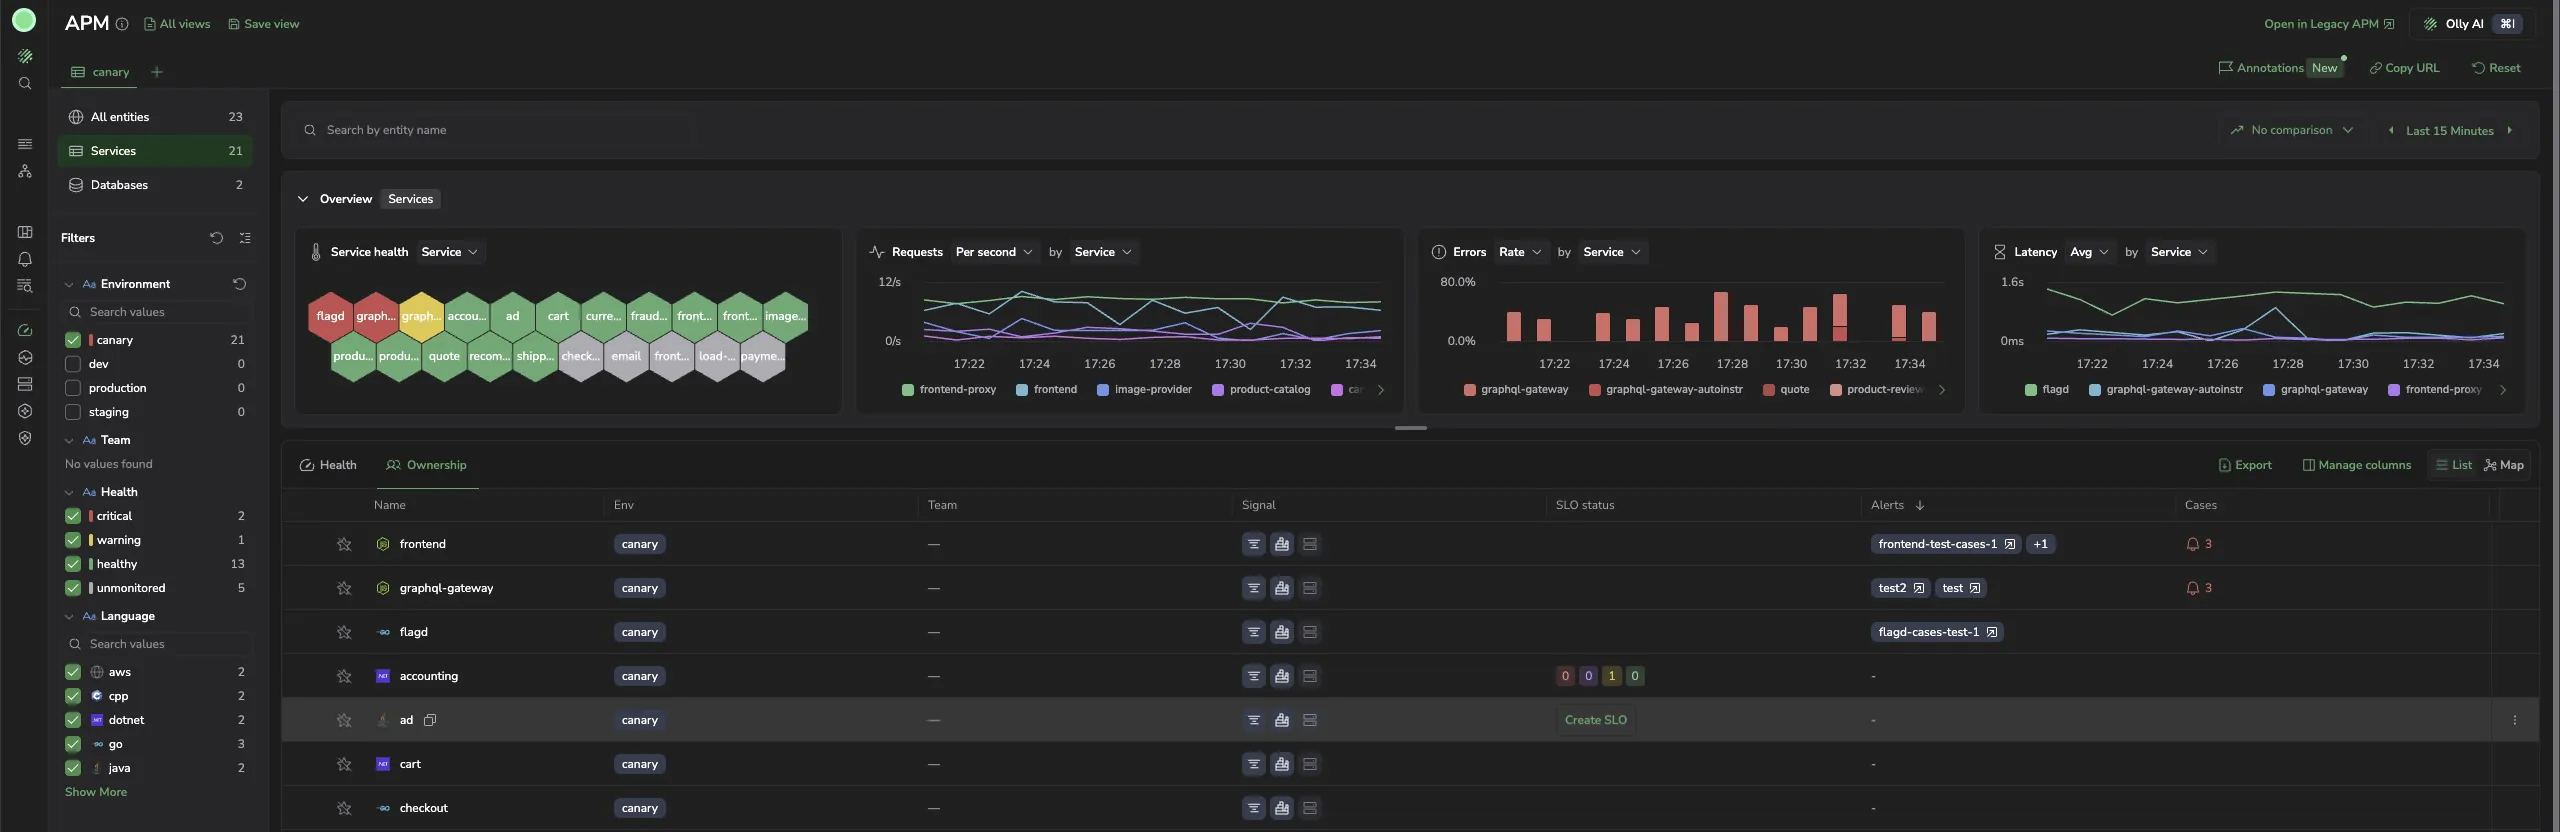
The Ownership view shows which services have an open alert or case, which have an SLO worth checking, and what your team owns versus what has no owner at all. Signal chips show whether traces, profiling and infrastructure are reporting for each service; hover a dimmed one to see why it isn’t and how to fix it.
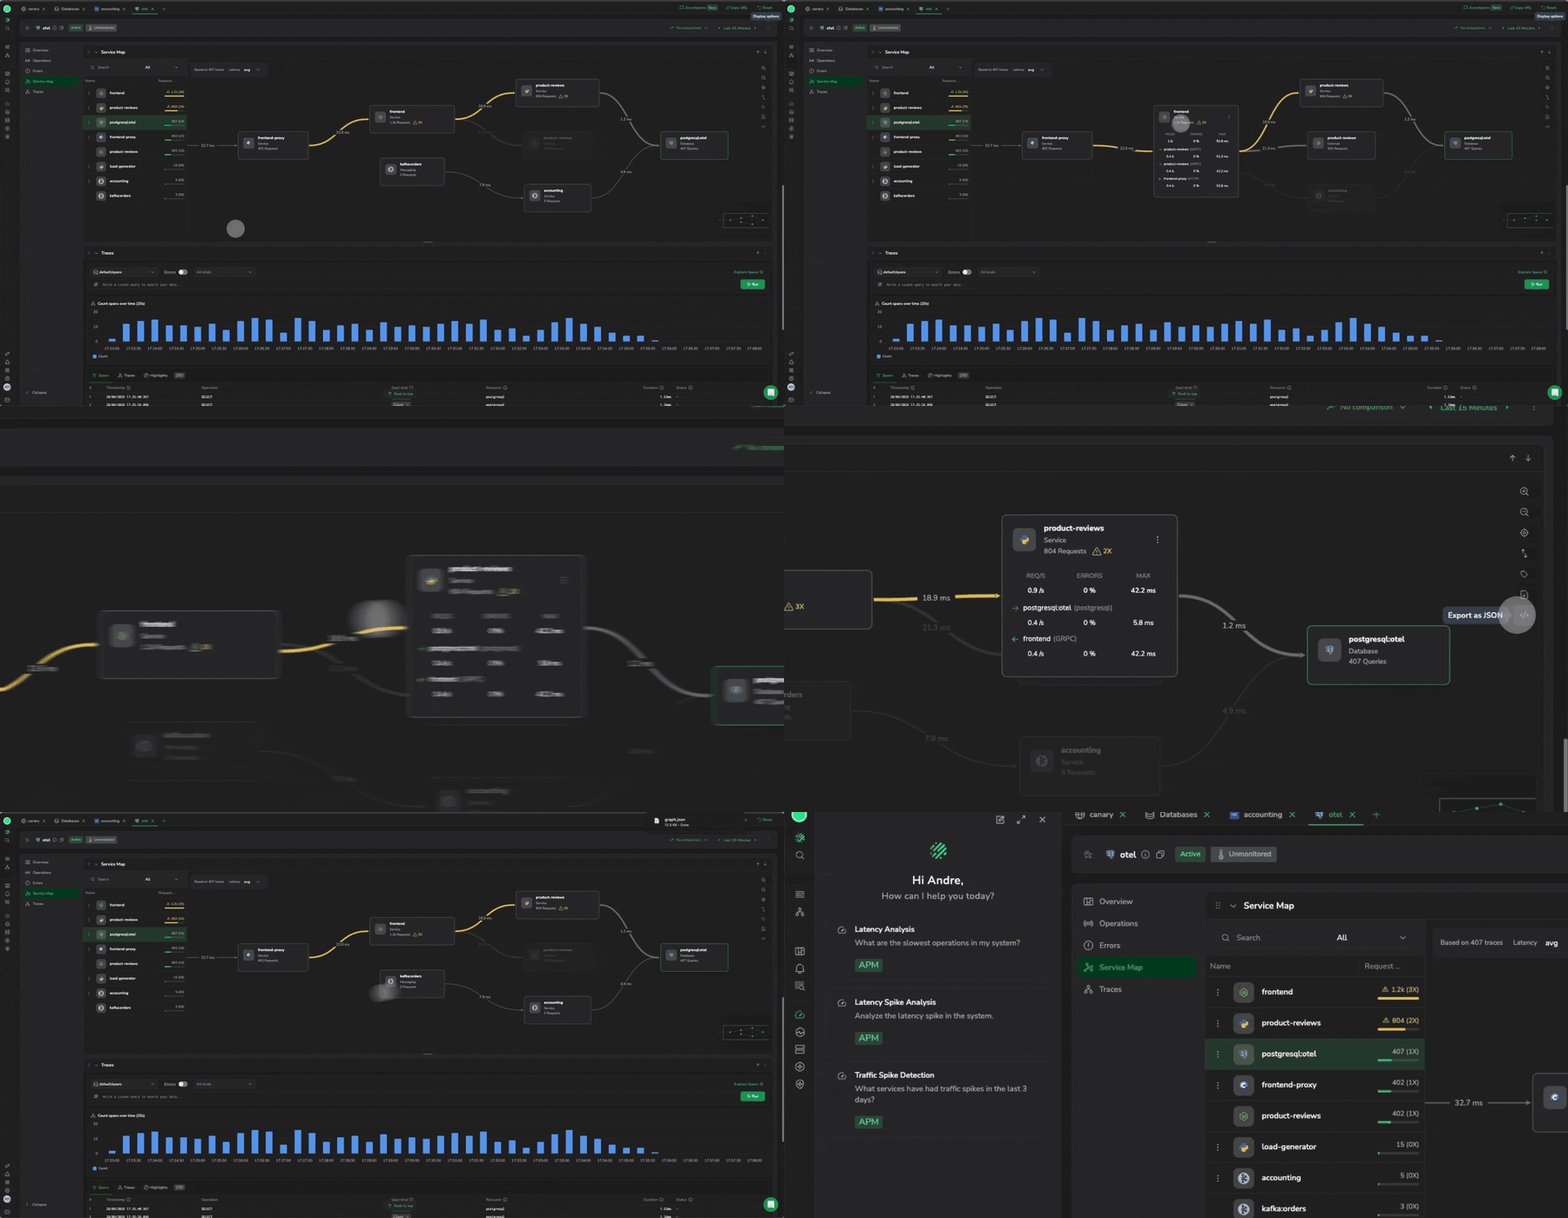
The Map view draws every service and database and the calls between them, with health on each service, and exports as PNG or JSON.
The new experience is part of APM, not a separate product, and the current APM screens stay available from a link on every page.
Do I need to change how I integrate?
No new SDK and no code change. The new experience reads compact span metrics, a low-cardinality metric type that keeps it fast at scale. They are sent alongside your existing span metrics, not instead of them, from both your services and your databases. An account sending them from only one side keeps the current APM screens until both do.
If you already use Span Metrics with the Coralogix OpenTelemetry integration v0.0.230 or later, compact span metrics are already on for both, and there is nothing to do. On an earlier version, upgrade the integration. If you still generate APM metrics with Events2Metrics, migrate to span metrics first. The catalog fills from the moment compact metrics start flowing. To see the volume and cardinality impact, open Service Governance in the Metrics Usage Analyzer.
Try it
The new APM experience is generally available today, for every account sending compact span metrics from its services and databases.
- Turn on compact span metrics
- Services and Databases
- Concepts: entity, signal and health policy
For years, Coralogix APM has told you which service was behind the latency. Now it tells you, and your agent, the release, the environment and the query behind the service, for every service you run.