Permutation Importance (PI) : Explain Machine Learning Predictions


The increasing complexity of machine learning (ML) models demands better explanations of how predictions are made, and which input features are most important in a model’s decision. Providing clear details and reasons for ML predictions and performance (also known as model explainability) is important for:
- ML engineers and data scientists to verify and improve their models.
- Regulators to audit model performance in terms of fairness and ethics.
- End users to trust and adopt the solutions.
One possible and easy way to understand and explain the predictions of models is through feature importance (FI) calculation, which estimates the contribution of each feature to a model’s predictions. Several types of FI techniques exist, however in this article, the focus will surround a very simple to implement and understand FI technique called Permutation Importance.
What is Permutation Importance?
Permutation Importance (PI) is an explainability technique used to obtain the importance of features based on their impact on a trained ML model’s prediction. This technique is usually employed during the training and development stage of the MLOps life cycle when data scientists wish to identify the features that have the biggest impact on a model’s predictions for model diagnostics and improvement, such as identifying bias or irrelevant features. PI ignores the internal behavior of the model and focuses only on its prediction performance. Therefore, data scientists are not required to understand the implementation of the model to be able to use PI. PI could be computed on any trained ML model as long as the input data is available.
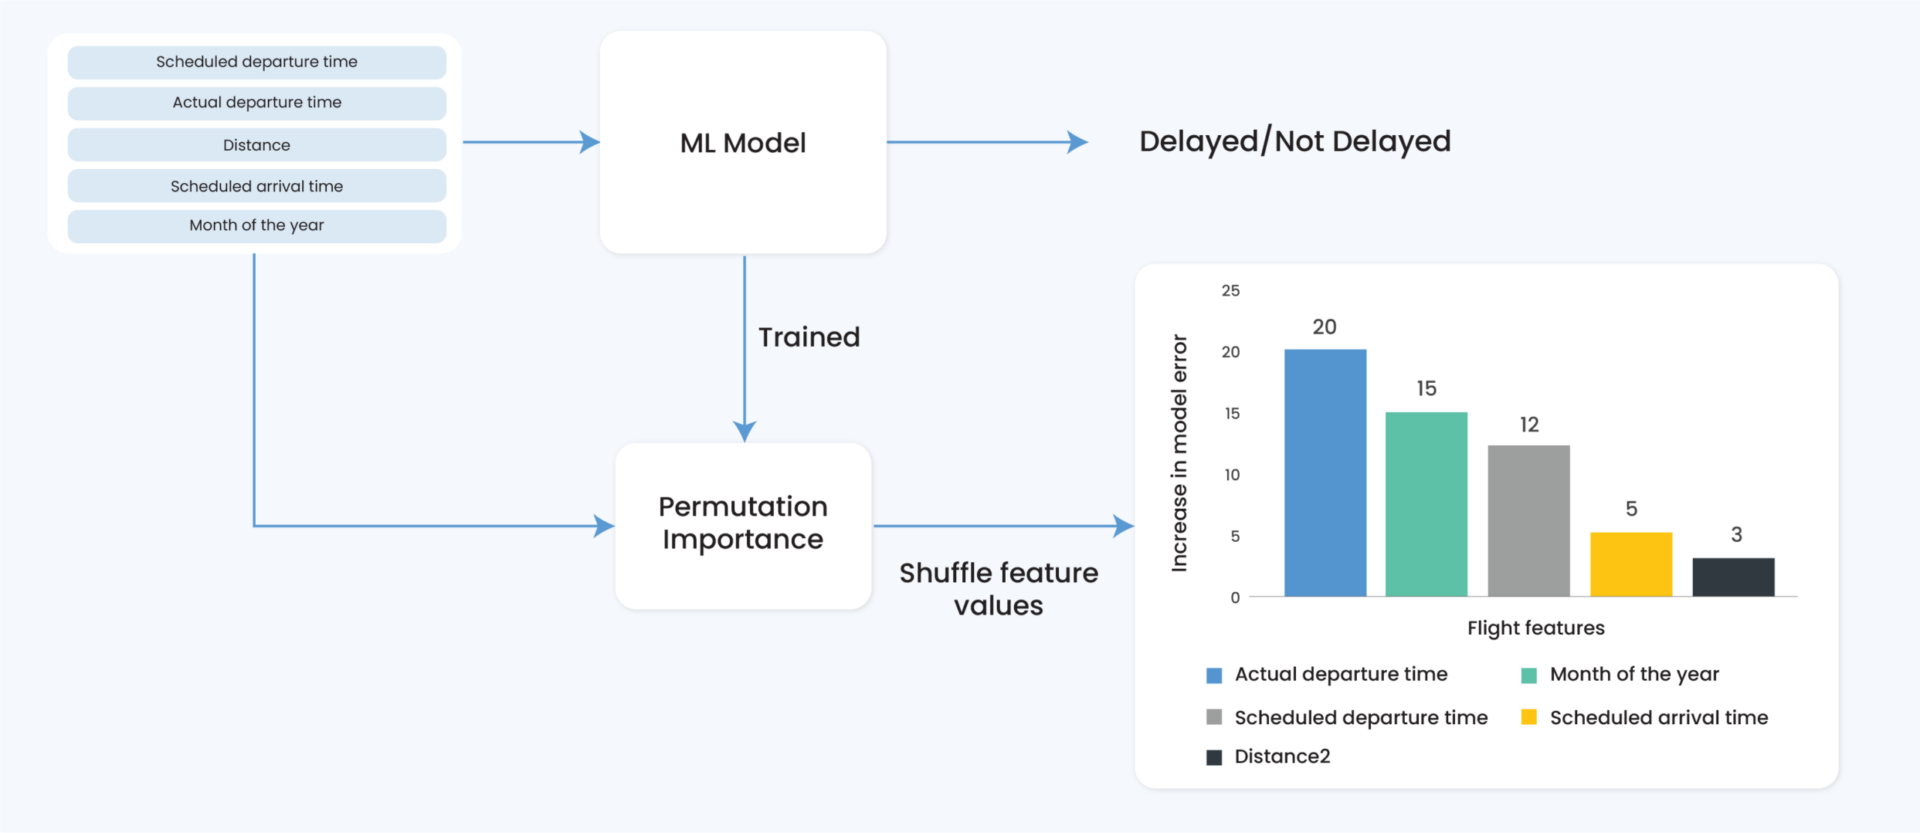
Here’s a simple real-world example (Figure 1) where PI is used to estimate the importance of flight features in predicting flight arrival delays. Using the trained model and dataset, PI is able to produce a ranking of feature importance according to the increase in model error.
The remainder of this article will:
- Describe the computation of PI
- Provide a simple demonstration of computing PI using Python programming language
- Provide advantages and disadvantages of PI
How to Compute Permutation Importance
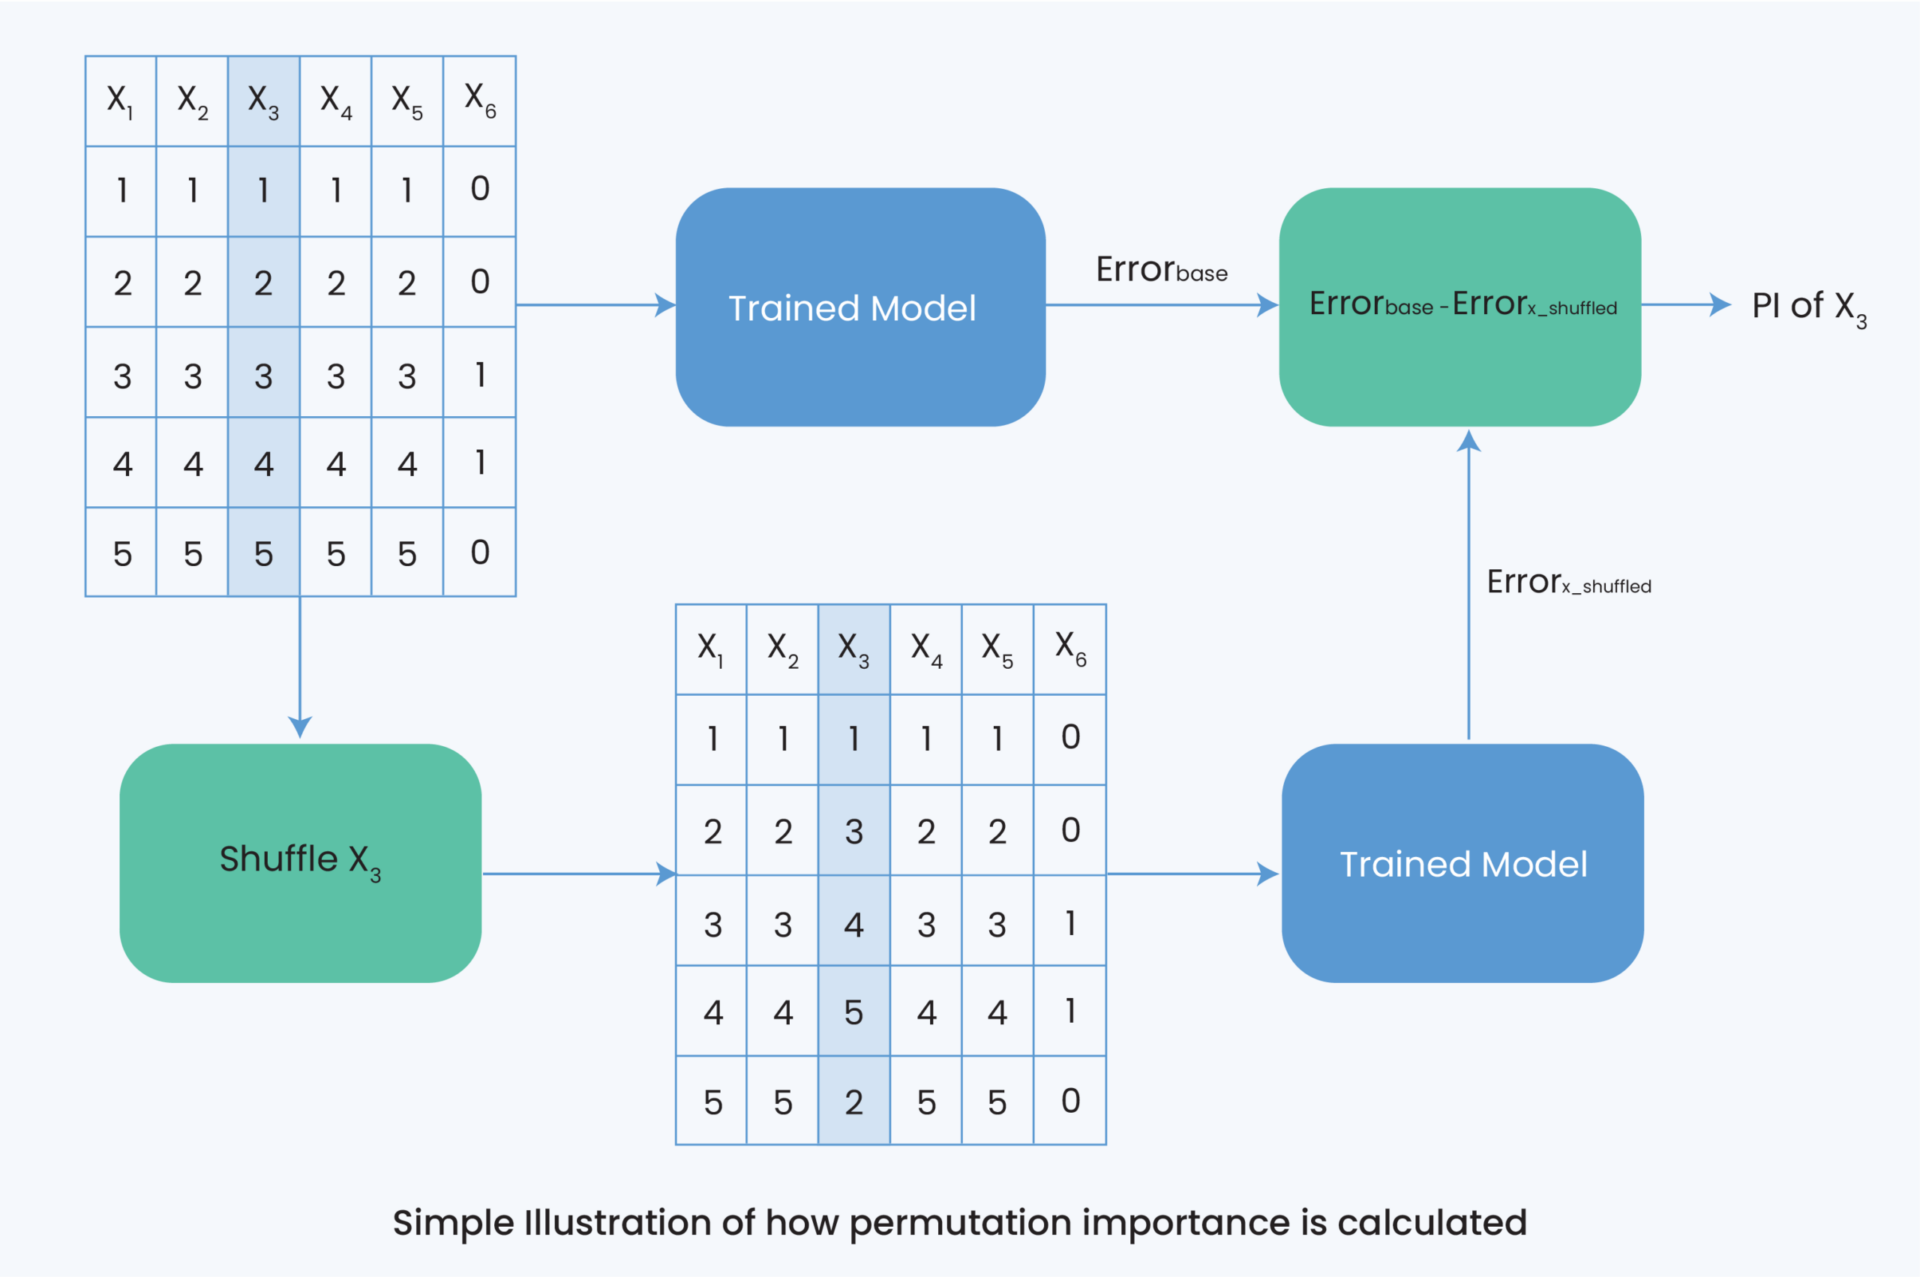
PI estimates the importance of a feature to a model’s prediction by calculating the change in model error when the values of the feature are shuffled (or permuted). Figure 2 illustrates the computation of the importance of feature X3 in a small dataset made up of five features. First, the model error is computed using the trained model and the labeled dataset (Errorbase). Later, feature X3 in the labeled dataset is shuffled. By shuffling feature X3, the relationship between the feature and model prediction is broken leading to a decrease in prediction performance or increase in model error. The model error of the new dataset with the shuffled feature is calculated (Errorx_shuffled) and the difference between the initial error and the shuffled error indicates the importance of feature X3. The greater the difference, the more important that feature is.
Implementation of Permutation Importance for a Classification Task
Let’s go through an example of estimating PI of features for a classification task in python. We will be using the sklearn library to train our model and we will implement Algorithm 1 from scratch. Then, we’ll plot the results to rank features according to their PI coefficients.
Classification of Iris Flowers:
1. Load the popular Iris dataset. The dataset is an open-source flower classification dataset that consists of three types of flowers i.e. Setosa, Versicolour, and Virginica. The dataset is made up of 50 samples from each of the three types of iris flowers and for each sample, four features are reported: sepal length, sepal width, petal length and petal width.
import pandas as pd
from sklearn.datasets import load_iris

# Set seed value
seed_value = 56

data = load_iris()
X = pd.DataFrame(data.data, columns=data.feature_names)
y = pd.DataFrame(data.target, columns=['Iris_type'])
2. Split the data into training and test sets with the size of the test set being 30% of the dataset.
from sklearn.model_selection import train_test_split
data_size_for_testing = 0.3
x_train, x_test, y_train, y_test = train_test_split(X, y, test_size=data_size_for_testing, random_state=seed_value,  shuffle=True,stratify=y)
3. Standardize features to improve model training. Target labels are already encoded as integer classes from default.
from sklearn.preprocessing import StandardScaler, LabelEncoder
standscaler = StandardScaler()
standscaler.fit(x_train)
train_features = pd.DataFrame(standscaler.transform(x_train), columns=x_train.columns)
x_train = train_features
y_train = y_train.reset_index().drop("index", axis=1)

test_features = pd.DataFrame(standscaler.transform(x_test), columns=x_test.columns)
x_test= test_features
y_test = y_test.reset_index().drop("index", axis=1)
4. Train a simple random forest model.
from sklearn.ensemble import RandomForestClassifier
model_clf = RandomForestClassifier(criterion='gini', random_state=seed_value)
model_clf.fit(x_train,y_train)
5. Implement PI as a function called PI_calculate():
import copy
import numpy as np
# Set numpy pseudo-random generator at a fixed value
np.random.seed(seed_value)
def PI_calculate(model, data, criterion):
    PI_matrix = []
    original_pred = model.predict(data[0])
    original_error = criterion(data[1],original_pred)
    for feature in range(data[0].shape[1]):
        perbutated_data= copy.deepcopy(data[0])
        np.random.shuffle(perbutated_data.iloc[ : , feature])
        perbutated_pred = model.predict(perbutated_data)
        perbutated_error = criterion(data[1], perbutated_pred)
        PI_matrix.append((original_error - perbutated_error))
    return pd.DataFrame(PI_matrix, index=data[0].columns, columns=['Features']).transpose()

from sklearn.metrics import accuracy_score
PI = PI_calculate(model_clf,[x_test,y_test],accuracy_score)
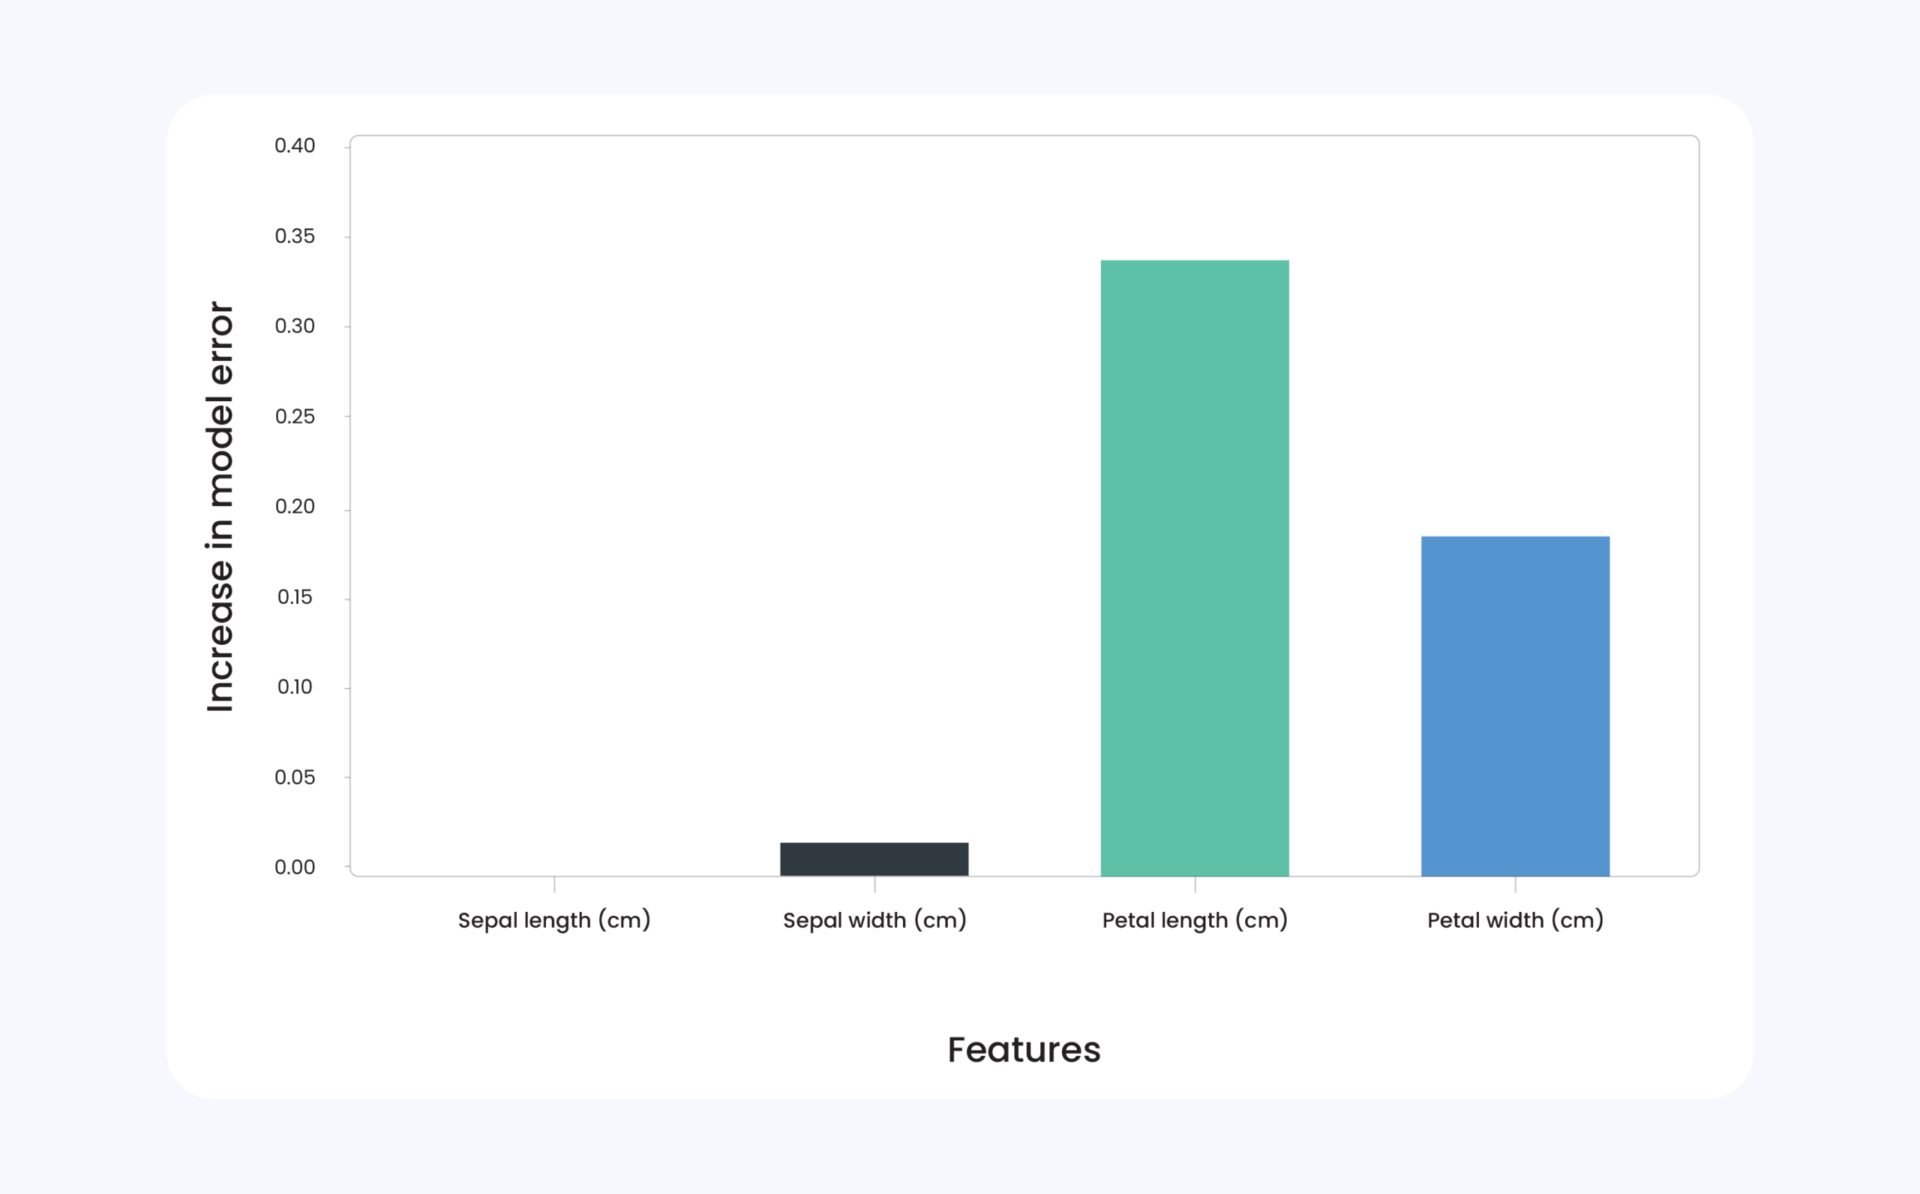
6. Plot the importance of features to the model performance.
import seaborn as sns
import matplotlib.pyplot as plt
p = sns.barplot(x = PI.columns,y=PI.values.flatten())
p.set_xlabel("Features", fontsize = 20)
p.set_ylabel("Increase in model error", fontsize = 20)
p.set_xticklabels(p.get_xticklabels(),rotation = 90)
plt.plot()
Advantages of Permutation Importance
- PI is easy to understand and compute, as it does not require retraining the model. It is a good starting point to learn ML explainability.
- PI can quickly provide a global explanation of how a model makes its decisions based on the feature set.
- The trained model captures all feature interactions. As a result, PI considers both the main feature effect and the interaction effects on model performance.
Disadvantages of Permutation Importance
- PI cannot explain the predictions for specific data points or instances.
Conclusion
Thank you for taking the time to go through our insightful article. To recap, this article introduces a simple approach to explain a model’s prediction called permutation importance. The approach calculates the decrease in model performance when features are removed. The article presented a real-world example on flight delay prediction to show how the approach works and provided code snippets using an open-source dataset to calculate the importance of features in a classification task.
Hopefully, this article has provided you with a solid understanding of machine learning explainability using permutation importance.
Lastly, you can also try implementing permutation importance for a regression task, and then check out our GitHub repository to compare your answers.