Database Monitoring: troubleshooting from the bottom up

A healthy relationship between services and databases is fundamental to overall application performance. Unchecked database issues can compromise application efficiency, user experience, and ultimately, your organization’s bottom line. To steer clear of these consequences, monitoring your databases should be a key component of your observability—and with the launch of Coralogix Database Monitoring, it can be.
How Coralogix Database Monitoring works
Coralogix Database Monitoring complements our existing APM Service Catalog, providing a highly efficient bottom-up method for investigating issues within your databases and the services they interact with. By leveraging the latest in OpenTelemetry’s semantic conventions for databases, Coralogix Database Monitoring ensures up-to-date, standardized monitoring; no extra costs, no vendor lock-in.
Database Monitoring allows you to get to the root of the problem quickly. Say, for example, you’re struggling with issues caused by database blocking. With a standard APM tool, you can see how many services are experiencing failures or high latency, but you won’t always see what’s causing it.
With Coralogix Database Monitoring, however, you can dive into specific details such as database hosts and tables, operations, and statements, to scrutinize latency, failures, and throughput bottlenecks. In turn, you can see which services and operations consume most of the database capacity, fail the most, and potentially block other operations, helping you troubleshoot not only the database but the services it interacts with.
Identifying problematic service-database interactions
Imagine you work for an ecommerce platform that’s launching a major summer sale. Traffic volumes are rising (yay), but you notice failures and latency are rising, too (not yay). You need to determine whether the issues are originating from a database, a service, or both. Consider the following potential causes of database-service interaction problems and how Coralogix Database Monitoring can help you troubleshoot them.
Inefficient database queries: Identify slow-running queries and failures that are affecting user experience
The reality is that most developers aren’t database experts and the code they write can lead to significant performance issues. Poorly written queries—including the use of unnecessary joins, subqueries, or complex logic—can quickly lead to performance degradation. Inefficient database queries from an individual service can generate increased latency and failures, but these inefficient queries are extremely difficult to detect.
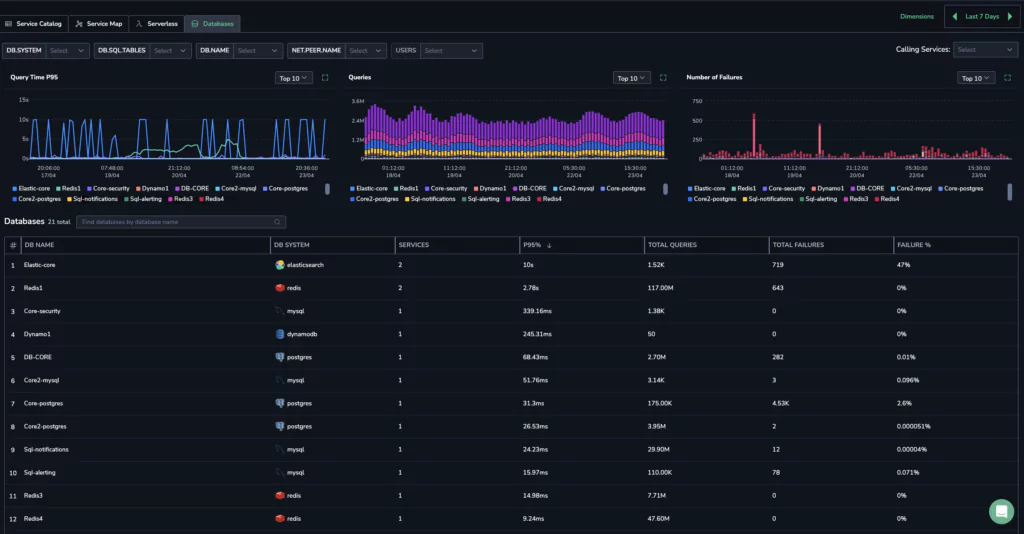
With Coralogix Database Monitoring, you can easily identify databases along with connected services as well as which of those services and their operations are generating the most failures or latency, uncovering the source of poorly structured queries.
Insufficient database resources: Drill into underlying infrastructure
If a database lacks sufficient resources—such as CPU or memory—it can impact any and all services that it interacts with. Resulting database bottlenecks can lead to increased latency and failures. By viewing your databases in one centralized list, you can rapidly identify if a single database is impacting more than one service (potentially due to lack of resources). This provides a rapid way to identify the root cause of problematic databases, simplifying your monitoring and troubleshooting efforts.
Request overload: Quickly assess if high throughput to specific databases is leading to widespread service disruption
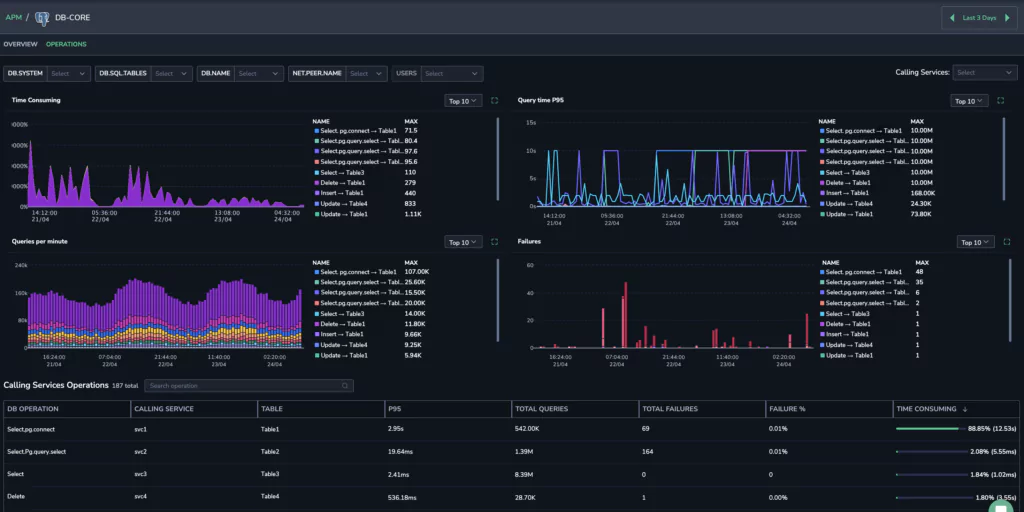
When request volumes from a single service to a database are higher than usual, the database’s overall throughput may be impacted. For example, developers may experience very little lag with a small sample database and just their local machine, but a production-level number of simultaneous queries on a much larger database could grind the entire application to a halt.
With Database Monitoring, not only can you easily detect latencies and failures for all the affected services, but you can quickly pinpoint the source. Starting with a high-level view of all databases, you can then drill into the services connected to a problematic database, view all of the services’ query volumes, and identify the source of the overload.
Getting started with Database Monitoring
Coralogix Database Monitoring is a significant addition to Coralogix’s APM, making it easy for developers to visualize and understand database-related issues.
Begin optimizing your overall system performance with the Database Catalog to proactively tackle issues at their origin and reduce system-wide disruptions. For a deeper understanding of how our Database Monitoring can enhance your APM capabilities, please visit our documentation.