Hands-on-Exercises: Mapping Exceptions with Elasticsearch

Mapping is an essential foundation of an index that can generally be considered the heart of Elasticsearch. So you can be sure of the importance of a well-managed mapping. But just as it is with many important things, sometimes mappings can go wrong. Let’s take a look at various issues that can arise with mappings and how to deal with them.
Before delving into the possible challenges with mappings, let’s quickly recap some key points about Mappings. A mapping essentially entails two parts:
- The Process: A process of defining how your JSON documents will be stored in an index
- The Result: The actual metadata structure resulting from the definition process
The Process

If we first consider the process aspect of the mapping definition, there are generally two ways this can happen:
- An explicit mapping process where you define what fields and their types you want to store along with any additional parameters.
- A dynamic mapping Elasticsearch automatically attempts to determine the appropropriate datatype and updates the mapping accordingly.
The Result
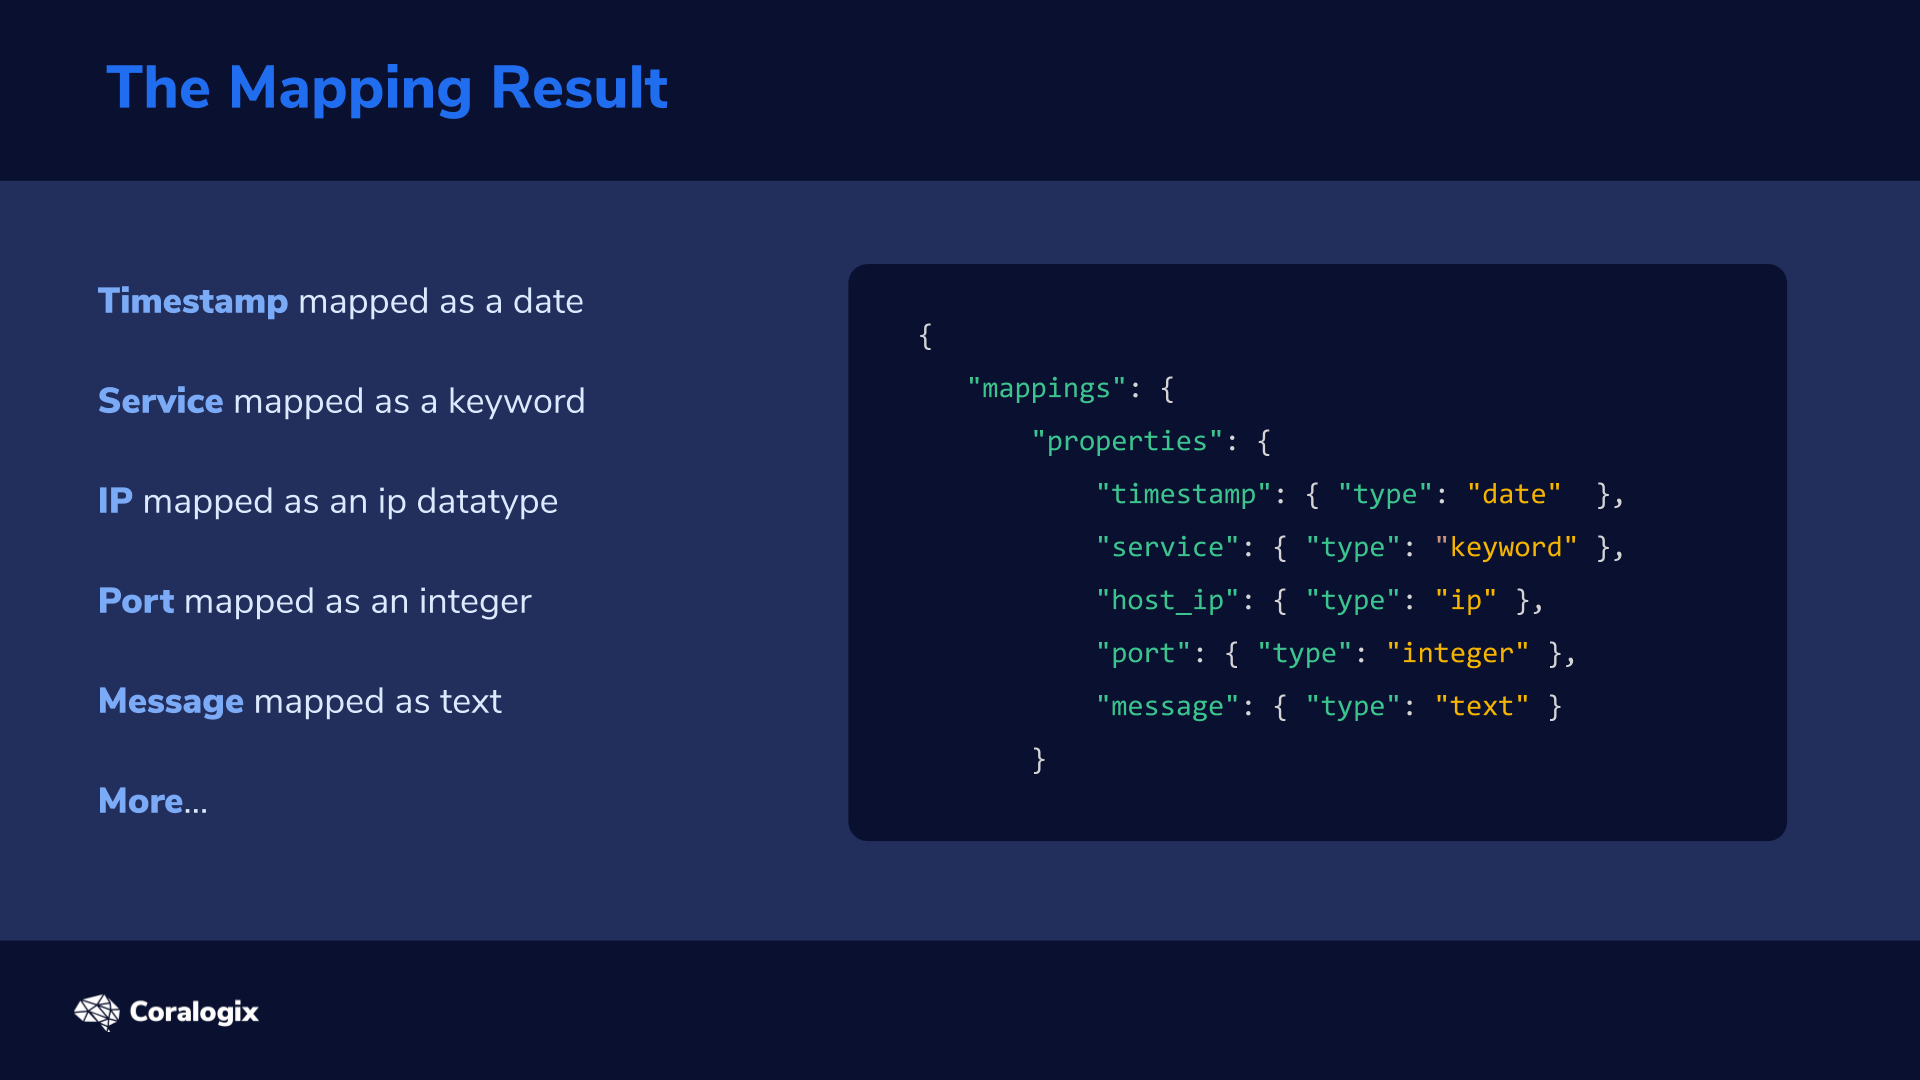
The result of the mapping process defines what we can “index” via individual fields and their datatypes, and also how the indexing happens via related parameters.
Consider this mapping example:
{

"mappings": {

"properties": {

"timestamp": { "type": "date"  },

"service": { "type": "keyword" },

"host_ip": { "type": "ip" },

"port": { "type": "integer" },

"message": { "type": "text" }

}

}

}
It’s a very simple mapping example for a basic logs collection microservice. The individual logs consist of the following fields and their associated datatypes:
- Timestamp of the log mapped as a date
- Service name which created the log mapped as a keyword
- IP of the host on which the log was produced mapped as an ip datatype
- Port number mapped as an integer
- The actual log Message mapped as text to enable full-text searching
- More… As we have not disabled the default dynamic mapping process so we’ll be able to see how we can introduce new fields arbitrarily and they will be added to the mapping automatically.
The Challenges

So what could go wrong :)?
There are generally two potential issues that many will end up facing with Mappings:
- If we create an explicit mapping and fields don’t match, we’ll get an exception if the mismatch falls beyond a certain “safety zone”. We’ll explain this in more detail later.
- If we keep the default dynamic mapping and then introduce many more fields, we’re in for a “mapping explosion” which can take our entire cluster down.
Let’s continue with some interesting hands-on examples where we’ll simulate the issues and attempt to resolve them.
Hands-on Exercises
Field datatypes – mapper_parsing_exception
Let’s get back to the “safety zone” we mentioned before when there’s a mapping mismatch.
We’ll create our index and see it in action. We are using the exact same mapping that we saw earlier:
curl --request PUT 'https://localhost:9200/microservice-logs'
--header 'Content-Type: application/json'
--data-raw '{
   "mappings": {
       "properties": {
           "timestamp": { "type": "date"  },
           "service": { "type": "keyword" },
           "host_ip": { "type": "ip" },
           "port": { "type": "integer" },
           "message": { "type": "text" }
       }
   }
}'
A well-defined JSON log for our mapping would look something like this:
{"timestamp": "2020-04-11T12:34:56.789Z", "service": "ABC", "host_ip": "10.0.2.15", "port": 12345, "message": "Started!" }
But what if another service tries to log its port as a string and not a numeric value? (notice the double quotation marks). Let’s give that try:
curl --request POST 'https://localhost:9200/microservice-logs/_doc?pretty'
--header 'Content-Type: application/json'
--data-raw '{"timestamp": "2020-04-11T12:34:56.789Z", "service": "XYZ", "host_ip": "10.0.2.15", "port": "15000", "message": "Hello!" }'
>>>
{
...
 "result" : "created",
...
}
Great! It worked without throwing an exception. This is the “safety zone” I mentioned earlier.
But what if that service logged a string that has no relation to numeric values at all into the Port field, which we earlier defined as an Integer? Let’s see what happens:
curl --request POST 'https://localhost:9200/microservice-logs/_doc?pretty'
--header 'Content-Type: application/json'
--data-raw '{"timestamp": "2020-04-11T12:34:56.789Z", "service": "XYZ", "host_ip": "10.0.2.15", "port": "NONE", "message": "I am not well!" }'
>>>
{
 "error" : {
   "root_cause" : [
     {
       "type" : "mapper_parsing_exception",
       "reason" : "failed to parse field [port] of type [integer] in document with id 'J5Q2anEBPDqTc3yOdTqj'. Preview of field's value: 'NONE'"
     }
   ],
   "type" : "mapper_parsing_exception",
   "reason" : "failed to parse field [port] of type [integer] in document with id 'J5Q2anEBPDqTc3yOdTqj'. Preview of field's value: 'NONE'",
   "caused_by" : {
     "type" : "number_format_exception",
     "reason" : "For input string: "NONE""
   }
 },
 "status" : 400
}
We’re now entering the world of Elastisearch mapping exceptions! We received a code 400 and the mapper_parsing_exception that is informing us about our datatype issue. Specifically that it has failed to parse the provided value of “NONE” to the type integer.
So how we solve this kind of issue? Unfortunately, there isn’t a one-size-fits-all solution. In this specific case we can “partially” resolve the issue by defining an ignore_malformed mapping parameter.
Keep in mind that this parameter is non-dynamic so you either need to set it when creating your index or you need to: close the index → change the setting value → reopen the index. Something like this.
curl --request POST 'https://localhost:9200/microservice-logs/_close'

curl --location --request PUT 'https://localhost:9200/microservice-logs/_settings'
--header 'Content-Type: application/json'
--data-raw '{
   "index.mapping.ignore_malformed": true
}'

curl --request POST 'https://localhost:9200/microservice-logs/_open'
Now let’s try to index the same document:
curl --request POST 'https://localhost:9200/microservice-logs/_doc?pretty'
--header 'Content-Type: application/json'
--data-raw '{"timestamp": "2020-04-11T12:34:56.789Z", "service": "XYZ", "host_ip": "10.0.2.15", "port": "NONE", "message": "I am not well!" }'
Checking the document by its ID will show us that the port field was omitted for indexing. We can see it in the “ignored” section.
curl 'https://localhost:9200/microservice-logs/_doc/KZRKanEBPDqTc3yOdTpx?pretty'
{
...
 "_ignored" : [
   "port"
 ],
...
}
The reason this is only a “partial” solution is because this setting has its limits and they are quite considerable. Let’s reveal one in the next example.
A developer might decide that when a microservice receives some API request it should log the received JSON payload in the message field. We already mapped the message field as text and we still have the ignore_malformed parameter set. So what would happen? Let’s see:
curl --request POST 'https://localhost:9200/microservice-logs/_doc?pretty'
--header 'Content-Type: application/json'
--data-raw '{"timestamp": "2020-04-11T12:34:56.789Z", "service": "ABC", "host_ip": "10.0.2.15", "port": 12345, "message": {"data": {"received":"here"}}}'
>>>
{
...
       "type" : "mapper_parsing_exception",
       "reason" : "failed to parse field [message] of type [text] in document with id 'LJRbanEBPDqTc3yOjTog'. Preview of field's value: '{data={received=here}}'"
...
}
We see our old friend, the mapper_parsing_exception! This is because ignore_malformed can’t handle JSON objects on the input. Which is a significant limitation to be aware of.
Now, when speaking of JSON objects be aware that all the mapping ideas remains valid for their nested parts as well. Continuing our scenario, after losing some logs to mapping exceptions, we decide it’s time to introduce a new payload field of the type object where we can store the JSON at will.
Remember we have dynamic mapping in place so you can index it without first creating its mapping:
curl --request POST 'https://localhost:9200/microservice-logs/_doc?pretty'
--header 'Content-Type: application/json'
--data-raw '{"timestamp": "2020-04-11T12:34:56.789Z", "service": "ABC", "host_ip": "10.0.2.15", "port": 12345, "message": "Received...", "payload": {"data": {"received":"here"}}}'
>>>
{
...
 "result" : "created",
...
}
All good. Now we can check the mapping and focus on the payload field.
curl --request GET 'https://localhost:9200/microservice-logs/_mapping?pretty'
>>>
{
...
       "payload" : {
         "properties" : {
           "data" : {
             "properties" : {
               "received" : {
                 "type" : "text",
                 "fields" : {
                   "keyword" : {
                     "type" : "keyword",
                     "ignore_above" : 256
                   }
...
}
It was mapped as an object with (sub)properties defining the nested fields. So apparently the dynamic mapping works! But there is a trap. The payloads (or generally any JSON object) in the world of many producers and consumers can consist of almost anything. So you know what will happen with different JSON payload which also consists of a payload.data.received field but with a different type of data:
curl --request POST 'https://localhost:9200/microservice-logs/_doc?pretty'
--header 'Content-Type: application/json'
--data-raw '{"timestamp": "2020-04-11T12:34:56.789Z", "service": "ABC", "host_ip": "10.0.2.15", "port": 12345, "message": "Received...", "payload": {"data": {"received": {"even": "more"}}}}'
…again we get the mapper_parsing_exception!
So what else can we do?
- Engineers on the team need to be made aware of these mapping mechanics. You can also eastablish shared guidelines for the log fields.
- Secondly you may consider what’s called a Dead Letter Queue pattern that would store the failed documents in a separate queue. This either needs to be handled on an application level or by employing Logstash DLQ which allows us to still process the failed documents.
Limits – illegal_argument_exception
Now the second area of caution in relation to mappings, are limits. Even from the super-simple examples with payloads you can see that the number of nested fields can start accumulating pretty quickly. Where does this road end? At the number 1000. Which is the default limit of the number of fields in a mapping.
Let’s simulate this exception in our safe playground environment before you’ll unwillingly meet it in your production environment.
We’ll start by creating a large dummy JSON document with 1001 fields, POST it and then see what happens.
To create the document, you can either use the example command below with jq tool (apt-get install jq if you don’t already have it) or create the JSON manually if you prefer:
thousandone_fields_json=$(echo {1..1001..1} | jq -Rn '( input | split(" ") ) as $nums | $nums[] | . as $key | [{key:($key|tostring),value:($key|tonumber)}] | from_entries' | jq -cs 'add')

echo "$thousandone_fields_json"
{"1":1,"2":2,"3":3, ... "1001":1001}
We can now create a new plain index:
curl --location --request PUT 'https://localhost:9200/big-objects'
And if we then POST our generated JSON, can you guess what’ll happen?
curl --request POST 'https://localhost:9200/big-objects/_doc?pretty'
--header 'Content-Type: application/json'
--data-raw "$thousandone_fields_json"
>>>
{
 "error" : {
   "root_cause" : [
     {
       "type" : "illegal_argument_exception",
       "reason" : "Limit of total fields [1000] in index [big-objects] has been exceeded"
     }
...
 "status" : 400
}
… straight to the illegal_argument_exception exception! This informs us about the limit being exceeded.
So how do we handle that? First, you should definitely think about what you are storing in your indices and for what purpose. Secondly, if you still need to, you can increase this 1,000 limit. But be careful as with bigger complexity might come a much bigger price of potential performance degradations and high memory pressure (see the docs for more info).
Changing this limit can be performed with a simple dynamic setting change:
curl --location --request PUT 'https://localhost:9200/big-objects/_settings'
--header 'Content-Type: application/json'
--data-raw '{
 "index.mapping.total_fields.limit": 1001
}'
>>>
{"acknowledged":true}
Now that you’re more aware of the dangers lurking with Mappings, you’re much better prepared for the production battlefield 🙂
Learn More
-
- on the dynamic mapping process
- various field datatypes and other mapping parameters


