Introducing Mobile Real User Monitoring (RUM)

Human attention spans are seemingly shorter than ever, and your mobile application users are, unfortunately, no exception. Over 70% of users abandon an app if it’s taking too long, with half of these users waiting no more than three seconds. Even minor delays or errors can lead to significant user drop-off, negatively impacting your app’s success and user satisfaction.
Compounding this challenge is the fact that users interact with your app on a variety of devices, operating systems, and network conditions. These diverse environments mean errors are not just a risk; they’re inevitable. Whether it’s a crash on an older device model or a network issue, the potential for problems is high, and the stakes are even higher.
That’s exactly why we created our new Mobile Real User Monitoring (RUM) Solution for your iOS, Android, Flutter & React Native users—so you can easily identify errors, spot patterns, understand the impact, and fix issues before they escalate.
Quickly identify recurring errors
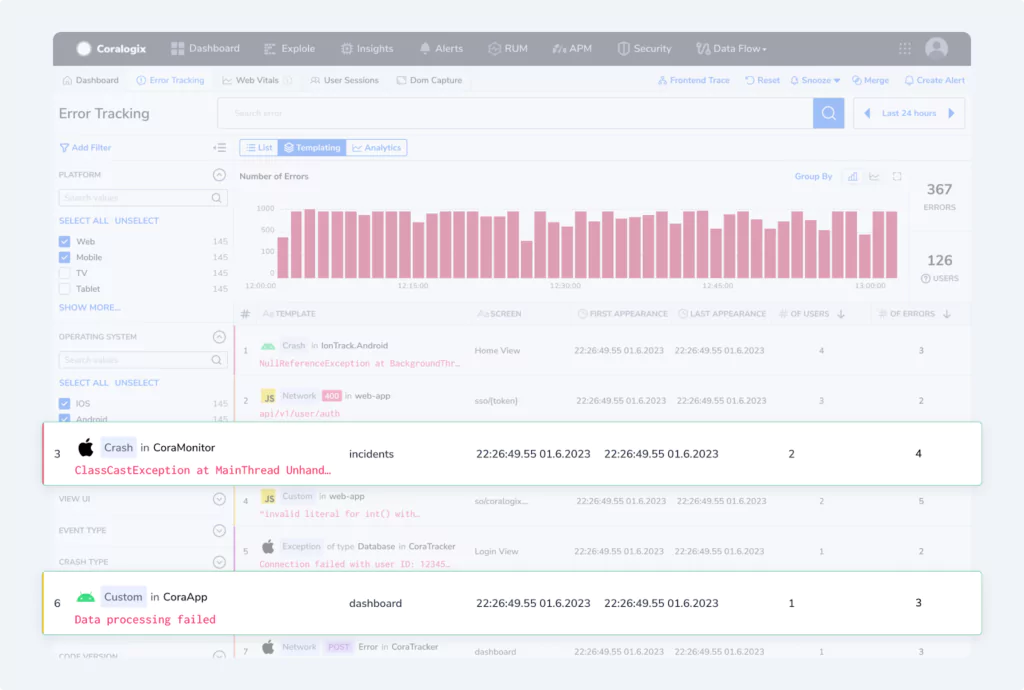
Our Mobile RUM solution aggregates errors based on similar characteristics—such as operating system, error message, or error type—giving you a clear picture of error frequency and your app’s stability. Errors can be grouped into four template types:
- Crash Error (Highly Critical): These are the most severe issues that cause the app to crash and significantly impact user experience.
- Exception (Medium Critical): These errors are less severe but are still important to address as they can disrupt app functionality.
- Network Error: Issues related to network connectivity that can affect app performance.
- Custom Error: User-defined errors that are specific to particular scenarios in your app.
Deep-dive into mobile error data
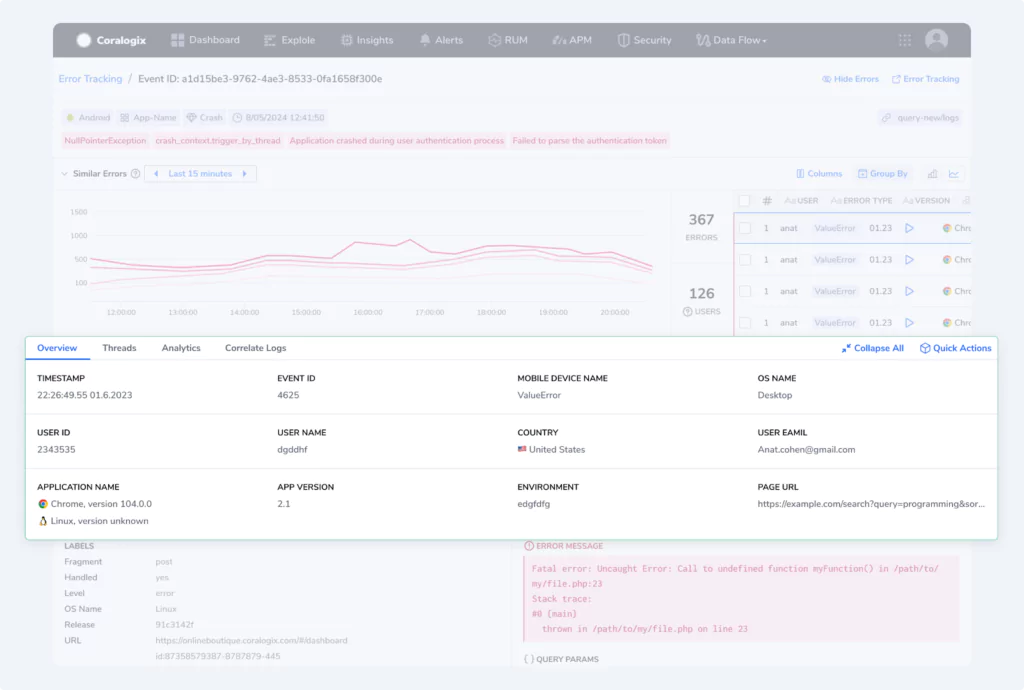
Once you’ve identified an error through the templating feature, dive deeper into the specifics with the Drill-Down feature. This tool provides detailed information tailored to the type of error you’re investigating. With this feature, you can view:
- Error Examples: View specific instances of the error to see how it manifests across different scenarios.
- Detailed Error Data: Get in-depth insights into the error’s characteristics with data extracted from the error log and any relevant joins.
- Analytics: Analyze the error data to identify patterns and understand the broader impact.
- Threads: View the threads running at the time of the error to understand the execution context.
- Correlate logs: View logs that the application has generated related to the error and the surrounding processes.
Monitor your application in real-time
With our Live Tail view, you can keep a constant watch on your app’s performance in real time. This feature provides an instant, live feed of all emerging errors allowing you to catch and address issues the moment they occur. For a more customized view, filter and sort the data by:
- Operating system
- View UI
- Application
- Event Type
- Crash Type
- Exception Type
- Status Code
- Code Version
- User ID
Uncover error context and patterns
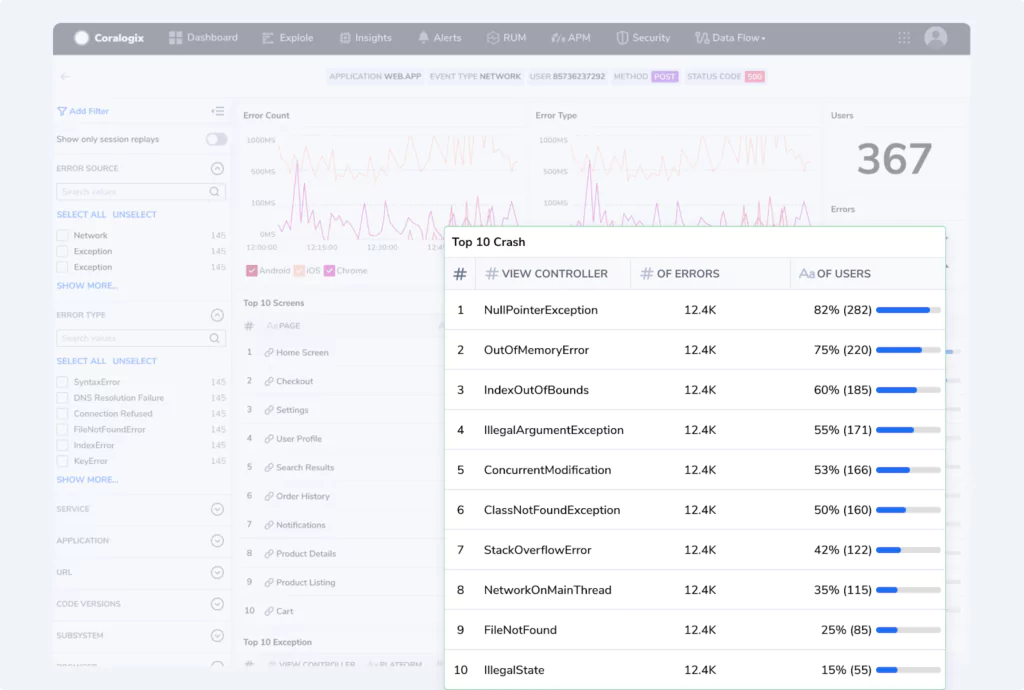
For an even better understanding of the context and patterns of errors within your application, our Analytics tab has got you covered. Pinpoint issues, track trends, and improve your app’s reliability, all with easy-to-visualize widgets. View mobile-specific insights such as the top 10:
- Crash signals including their frequency and affected modules
- Exceptions with key details like location and impact
- Network Issues categorized by type and frequency
- View Controllers where errors occur most frequently
Additionally, for even more detailed user insights, view affected users by geographical location , device attributes, and more.
Maximize the benefits of our Mobile RUM solution with Coralogix APM
Using Coralogix Mobile RUM alongside our Application Performance Monitoring (APM) solution allows you to draw a complete trace from the frontend to the backend and vice versa. This integrated approach gives you the ability to understand the full picture of your application’s performance.
With RUM, you get insights into how your users are interacting with your app on the frontend, while APM provides detailed metrics on backend processes and server performance. When used together, they offer a unified view that helps you identify and resolve issues more effectively, ensuring a seamless user experience across your entire application.
What’s next?
We’re committed to helping you maintain a high-performing, reliable mobile application, so stay tuned for more updates and enhancements to our Mobile RUM solution. For more information on our new Mobile RUM offering, head to our documentation.