Introducing the Coralogix Operator for Kubernetes

As organizations begin to scale their observability strategy, point and click methods of management become increasingly unworkable. This is why Coralogix has now fully released the Coralogix Operator for Kubernetes. Kubernetes operators are control loops that allow users to declare their desired state in their Kubernetes clusters, and the operator is responsible for resolving this state.
How do I get started?
Getting started is as simple as utilizing helm to install the operator into your cluster. This operator can be installed in a single, simple command that will deploy the components necessary for a fully functioning operator.
In addition to deployment, Coralogix users can also capture logs and metrics from the operator itself, to ensure that this critical component of their o11y stack remains functional and healthy.
Why should I use the Coralogix Operator for Kubernetes?
The Coralogix Operator allows customers to define their Coralogix assets in resources that are deployed into their cluster. This creates a simple, declarative interface for defining observability assets and allows the deployment to be brought into the code pipeline.
This ensures consistency across teams, because teams are no longer simply clicking through the user interface. This approach, often termed Monitoring as Code (MaC) mirrors Infrastructure as Code (IaC), which has been successfully deployed across thousands of organizations to scale their DevOps and platform strategies.
With the Coralogix operator, customers can:
- Automatically define TCO policy rules when a new namespace is defined in the cluster.
- Create pre-defined alarms when a new team is onboarded into a shared Kubernetes cluster.
- Build monitoring into internal helm charts, so that every application that deploys is guaranteed a base level of observability.
Vendor Lock-in Safety
For operators seeking to keep their clusters as vendorless as possible, the Coralogix operator can also be programmed using Prometheus CRDs for alarms, meaning that if the PrometheusRule resource already exists in your cluster, then you have a 0-effort migration to Coralogix.
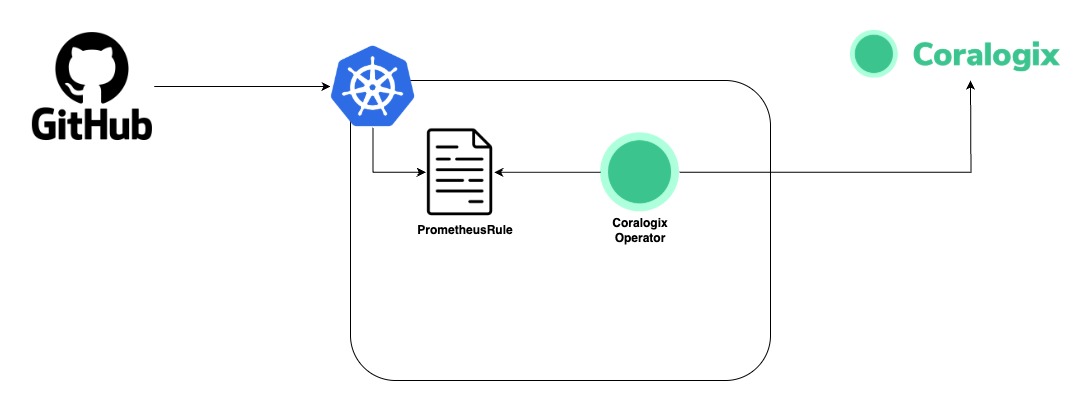
A Monitoring as Code Architecture: Defining Observability resources alongside code & infrastructure
Baking observability into your deployment workflows can be easily done. Let’s take a look at a simple workflow that brings together the key elements of the applications operational needs, and declares them alongside the codebase.
This not only ensures that all resources follow the same lifecycle, minimising hidden changes and reducing drift, but it greatly increases the transparency and requirements of an application.
my-app/
   src/
      index.js
      ...
   o11y/
      500-status.yaml
      crash-loop-error.yaml
   manifest.json
In this codebase, we can see an o11y folder, containing some yaml files. These yaml files are actually Prometheus custom resources, of type PrometheusRule. This is most commonly utilised with open source tooling, such as Alert Manager. An example of a PrometheusRule is as follows:
apiVersion: monitoring.coreos.com/v1
kind: PrometheusRule
metadata:
labels:
app: kube-prometheus-stack
app.kubernetes.io/instance: kube-prometheus-stack
release: kube-prometheus-stack
name: kube-pod-not-ready
spec:
groups:
- name: my-pod-demo-rules
rules:
- alert: K8s Pod Not Healthy
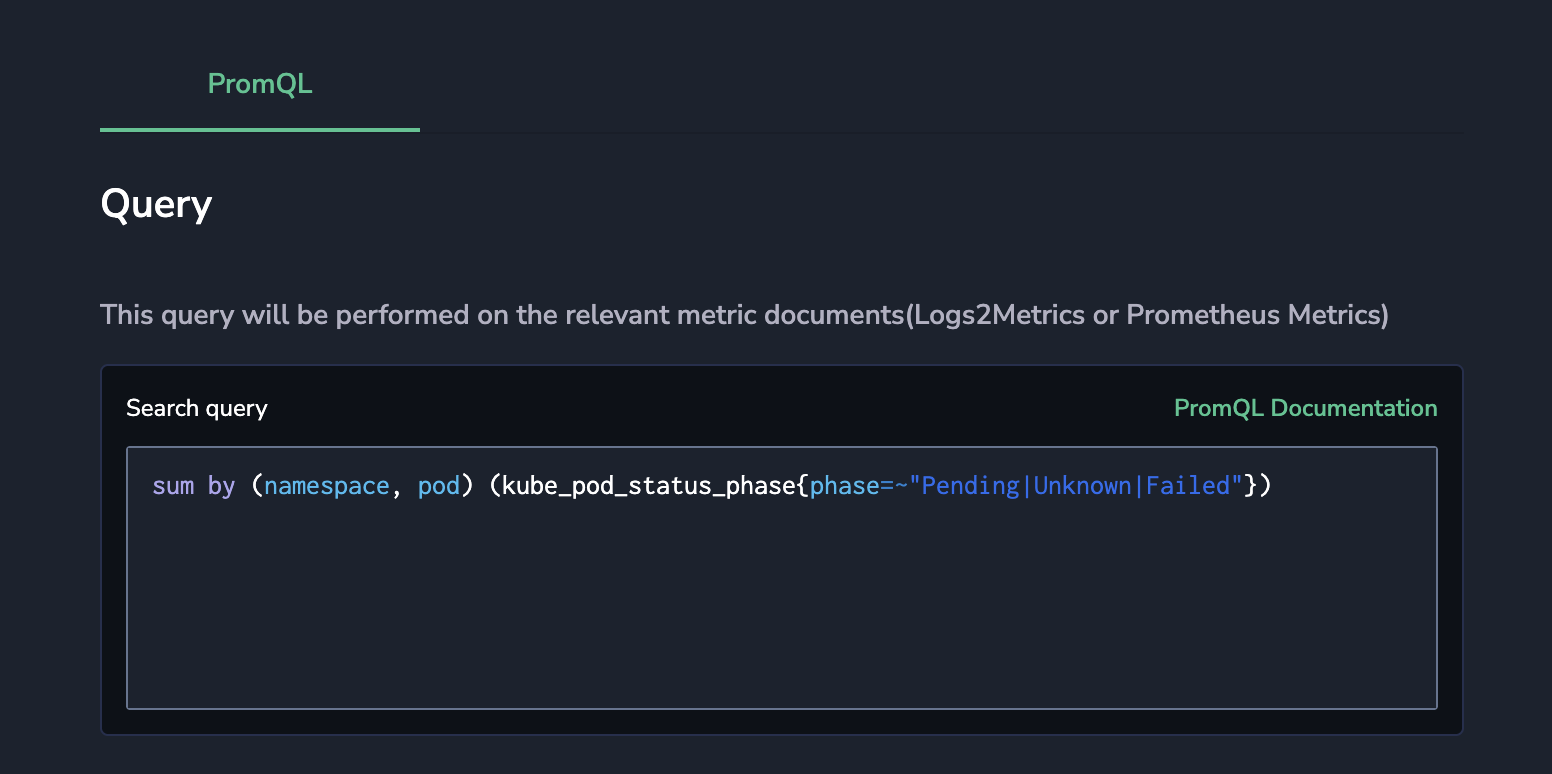
expr: sum by (namespace, pod) (kube_pod_status_phase{phase=~"Pending|Unknown|Failed"}) > 0
for: 1m
labels:
severity: critical
annotations:
summary: Kubernetes Pod not healthy (instance {{ $labels.instance }})
description: "Pod {{ $labels.namespace }}..."Notice here that there is no mention of the Coralogix stack in this resource. This ensures that your codebase remains vendorless, and ensures strong abstractions between your codebase and 3rd party vendors.
When the resources are applied to your cluster, using some command like the following:
kubectl apply -f o11y/*They will be defined. From here, the Coralogix Operator kicks in. The Coralogix Operator automatically detects the PrometheusRule type has been defined, and will begin replicating this alert in the relevant Coralogix account.
This example workflow makes observability a first class citizen in the codebase, and ensures engineers are always thinking about how they need to monitor and operate their applications and infrastructure. This example also demonstrates how abstraction rules can be maintained, to ensure vendorless code remains in the repositories, and the operator functions as a powerful, declarative middleware that ensures the desired outcomes without the negative consequences.
Scaled Observability just got easier
With the Coralogix Operator, organizations that are searching for the best way to increase their observability across their application estate can do so, while maintaining the critical consistency, performance, low overheads and transparency necessary to make every alert, every dashboard, or every TCO optimizer rule, as consistent and as clear as possible.