Istio Zero-Code Instrumentation


Tracing in Istio environments should be seamless, but too often, teams run into a frustrating problem—traces are broken. Requests jump between services, but instead of a complete flow, Coralogix displays fragmented spans.
Tracing should work out of the box in those environments. Istio’s sidecars capture spans automatically, so why are traces incomplete? The issue is almost always context propagation, and fixing it doesn’t have to mean modifying application code.
Let’s explore how to enable full end-to-end tracing in Istio and Coralogix without writing a single line of code.
The Problem: Broken Traces in Istio Service Meshes
When a request enters the service mesh, Istio’s Envoy proxies generate spans, sending trace data to the tracing backend. But without proper context propagation, each service in the call chain starts a new trace, rather than contributing to the original one.
Here’s what happens in a typical uninstrumented Istio setup:
- Ingress Gateway receives a request → Generates a trace ID.
- Service 1 processes the request → Doesn’t pass tracing headers → Istio’s sidecar starts a new trace.
- Service 2 receives a call → Also doesn’t propagate headers → Another new trace begins.
- Service 3 is reached → Another isolated trace.
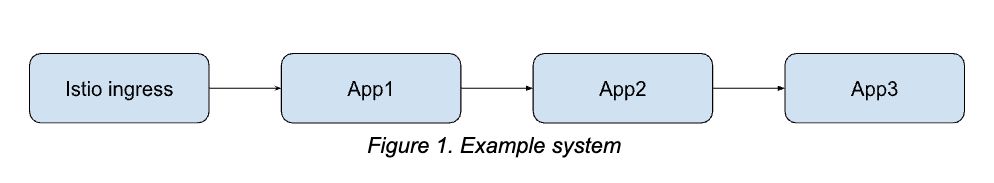
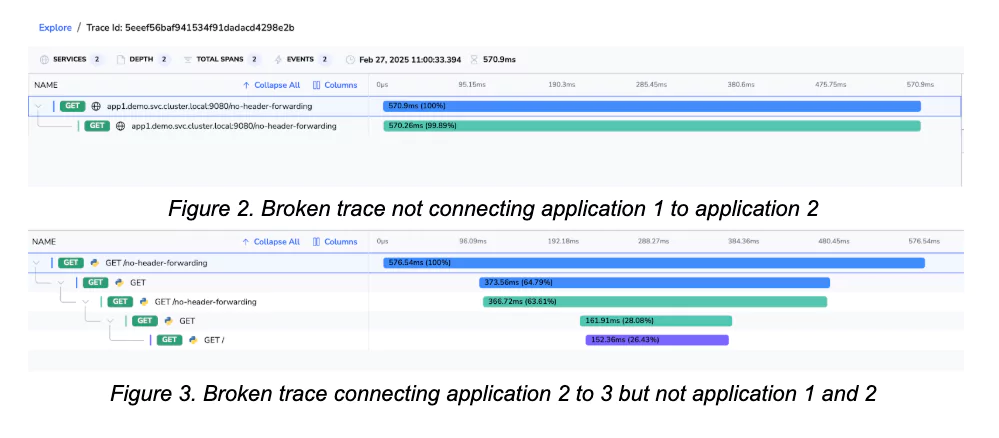
The root cause? Applications aren’t forwarding tracing headers between services.
The Traditional Fix: Manually Adding Header Propagation
The standard way to fix this requires modifying every service to forward the correct headers. In Python, for example, a developer would need to manually include B3-multi and ‘x-request-id’ (used by Envoy to identify the requests) headers in every outgoing request:
headers_to_forward = {
    'X-B3-Traceid': request.headers.get('X-B3-Traceid'),
    'X-B3-Spanid': request.headers.get('X-B3-Spanid'),
    'X-B3-Parentspanid': request.headers.get('X-B3-Parentspanid'),
    'X-B3-Sampled': request.headers.get('X-B3-Sampled'),
    'X-Request-Id': request.headers.get('X-Request-Id'),
}
This works, but it’s not scalable and can be difficult to maintain.
If you’re dealing with hundreds of microservices, modifying each one just for tracing isn’t practical. A better approach? Auto-instrumentation.
The Solution: Zero-Code Instrumentation with OpenTelemetry
Instead of manually injecting trace headers into every service, OpenTelemetry provides a zero-code instrumentation method for Istio.
With OpenTelemetry’s Instrumentation Custom Resource (CR), we can:
- Automatically inject tracing libraries into running applications.
- Enable context propagation without modifying code.
- Ensure every request carries the correct trace headers by default.
How It Works
- The OpenTelemetry operator deploys an Instrumentation CR in Kubernetes.
- The Instrumentation CR defines which applications should be auto-instrumented.
- Istio’s sidecars detect and forward tracing headers correctly.
- Spans are automatically linked, ensuring end-to-end trace continuity.
Enabling Zero-Code Instrumentation
Step 1: Deploy an OpenTelemetry Collector instance using the Coralogix integration
Follow the official documentation to deploy an OpenTelemetry Collector instance using the Coralogix integration.
Step 2: Configure Istio
Istio needs to be configured to send the generated traces from the proxy sidecads to the OpenTelemetry agents. You can find how to do this in the official Istio documentation.
Step 3: Define the OpenTelemetry Instrumentation CR
The Instrumentation CR tells OpenTelemetry which services to instrument and how to propagate tracing context.
Example configuration:
apiVersion: opentelemetry.io/v1alpha1
kind: Instrumentation
metadata:
  name: my-instrumentation
  namespace: demo
spec:
  propagators:
    - tracecontext
    - baggage
    - b3multi
   python:
     env:
       - name: NODE_IP
         valueFrom:
           fieldRef:
             fieldPath: status.hostIP
       - name: OTEL_EXPORTER_OTLP_ENDPOINT
         value: "https://$(NODE_IP):4318"
Note that you need to configure the Instrumentation object to point to the Coralogix agent.
Step 4: Apply the Instrumentation to Services
Modify the application manifests to enable auto-instrumentation. Simply add an annotation:
metadata:
  annotations:
    instrumentation.opentelemetry.io/inject-python: "true"
Once applied, OpenTelemetry Operator automatically injects tracing into workloads when they are created. No code changes. No library updates. No application restarts required.
Step 5: Restart Deployments
For changes to take effect, restart the application pods:
$ kubectl rollout restart deployment -n demoFrom this point forward, all requests will carry the correct tracing headers.
Missing telemetry data in the Coralogix UI?
Some stuff you can check in your cluster:
Sidecar Injection Issues: Ensure that Istio’s sidecar proxy is correctly injected into your application pods. Without the sidecar, tracing data won’t be captured. Verify sidecar injection with:
$ kubectl get pods -n demo -o=jsonpath="{.items[*].metadata.annotations['sidecar.istio.io/status']}"If the output is empty or doesn’t indicate successful injection, check your namespace and pod annotations to confirm they’re set for automatic sidecar injection.
Trace Context Propagation: even with zero-code instrumentation, some applications might not propagate trace context headers as expected. Inspect your service logs to ensure headers like x-b3-traceid are present and correctly forwarded. It can happen that the libraries used by your application are not supported by the autoinstrumentation OpenTelemestry libraries.
Collector Endpoint configuration: verify that the OpenTelemetry collector’s endpoint is correctly specified in your Instrumentation resource. An incorrect endpoint means traces won’t reach your backend.
Collector configuration: verify the configuration from your OpenTelemetry Agent. Ensure the correct receivers and exporters are enabled. You can learn more about this in the Coralogix documentation.
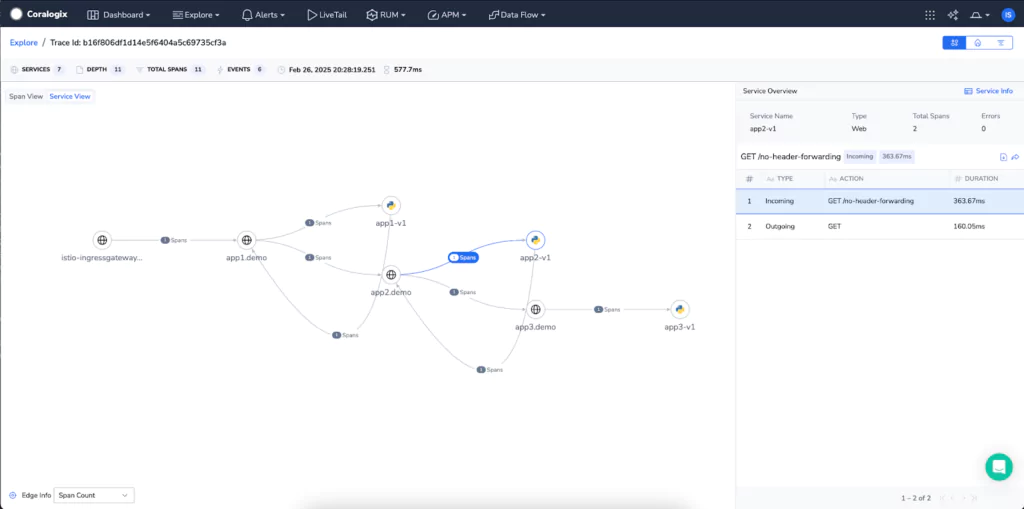
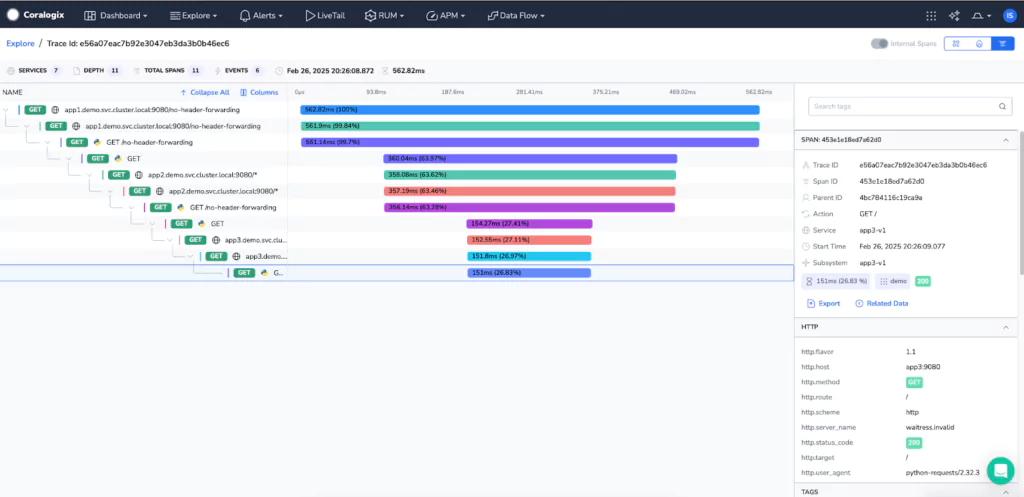
The Result: Complete, End-to-End Tracing
With auto-instrumentation enabled, previously broken traces now appear fully connected in your tracing backend.
Before:
Disjointed traces, missing spans, and disconnected transactions.
After:
Seamless, complete traces, linking every service call in a single transaction.
Auto-instrumentation also captures additional spans by hooking into commonly used libraries. For example:
- HTTP requests (Flask, Requests, FastAPI)
- Database queries (PostgreSQL, MySQL, Redis)
- Messaging systems (Kafka, RabbitMQ)
With zero developer effort, teams gain deep observability into every part of their application stack.
Key Benefits of Auto-Instrumentation with Istio, OpenTelemetry and Coralogix
- No Code Changes – No need to modify services to pass tracing headers.
- Consistent Tracing – Every request is properly tracked across microservices.
- Faster Debugging – Quickly identify latency, bottlenecks, and failed transactions.
- Scalable – Works across hundreds of services with no maintenance overhead.