Kibana Settings: Spaces, Export Dashboard, and more


Kibana is considered the “window” to Elasticsearch and indeed it’s a powerful UI for searching, filtering, analyzing, and visualizing Elasticsearch data, but Kibana settings are also used to configure, administer and monitor the Elasticsearch cluster. In this lesson, we’re going to explore how Kibana settings can be tweaked for collaborative teamwork.
We’re going to be exploring the following Kibana management features in this lesson:
- Kibana Spaces
- Spaces enable you to organize various Dashboards, Visualizations, Searches, and other so-called Saved Objects on your Kibana instance, into distinct “spaces” where different user groups can access what they need.
- This can be especially useful for segregating various business users according to departments like Marketing, Security, Development, Operations, Finance etc.
- You can also assign access to multiple spaces for specific users, in which case they’ll see their accessible spaces when logging in.
- Export Kibana Dashboards
- In relation to Spaces, Kibana allows you to transfer a selected set of Saved Objects either by copying them between Spaces within a single Kibana instance or by exporting them in JSON format from one Kibana instance and importing into another instance. This can be useful in multi-cluster environments.
- Advanced Kibana Settings
- Lastly, we’ll take a look at some settings related to user setup and spaces such as setting a default landing page when entering a space or switching to Dark mode.
Without further ado let’s jump right into spaces!
Kibana Settings
Spaces
Let’s start by navigating to the Management app in Kibana → and from there, head over to the Spaces configuration in the Kibana section. It can be found here running on the default port and localhost: https://localhost:5601/app/kibana#/management/spaces/list?_g=()
As you can see right away, there’s already one space created for us by default (named Default). It’s always present if you haven’t explicitly disabled spaces. All objects that are contained inside the default space are shared between all users.
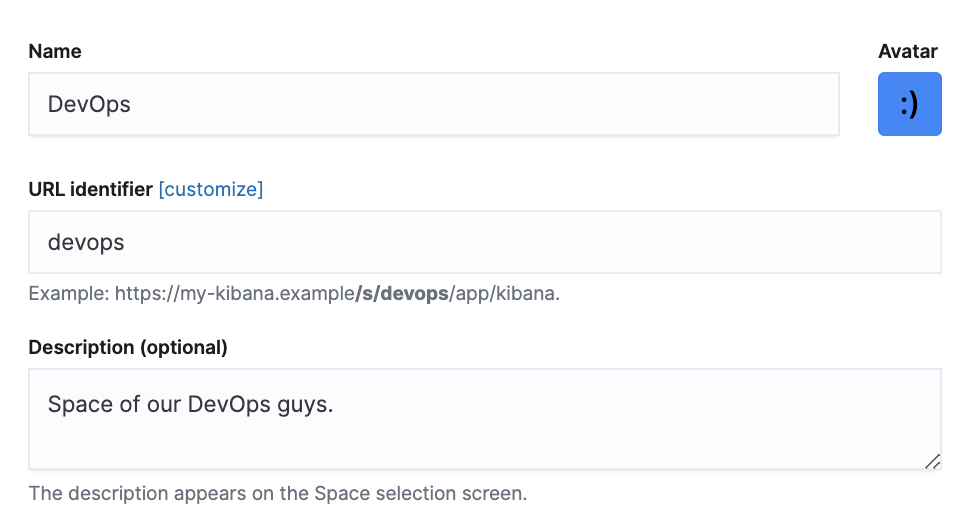
Let’s create a new space by clicking on Create a space. We’ll add the name “DevOps” and you can optionally provide a description. Lastly, we have the option to choose a color for space. This is helpful to visually differentiate spaces for users who have access to multiple spaces.
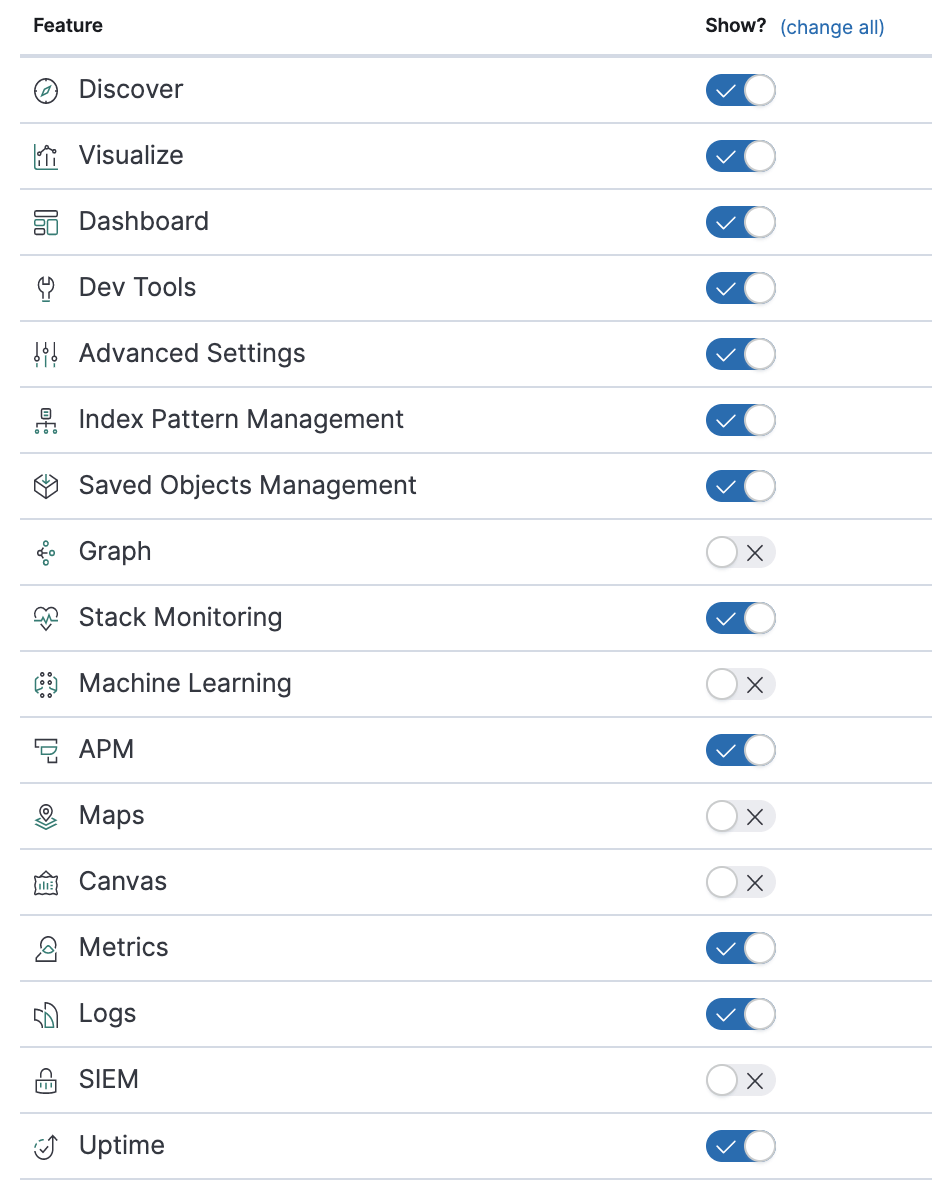
Then, scroll down to the Filters section where we can also filter out any sections that are not relevant for the specific target group. Our DevOps example would likely need access to most or all of these, but if you would be preparing a space for marketing, for example, you’d probably want to hide most of these and just enable access to the Dashboard menu option.
Bear in mind that this only hides or displays the menu options in the Kibana UI, but users would still be able to reach those areas via a direct URL. In other words, these Filters are not a replacement for access control features which would need to be handled separately.
Now let’s go ahead and click Create space.
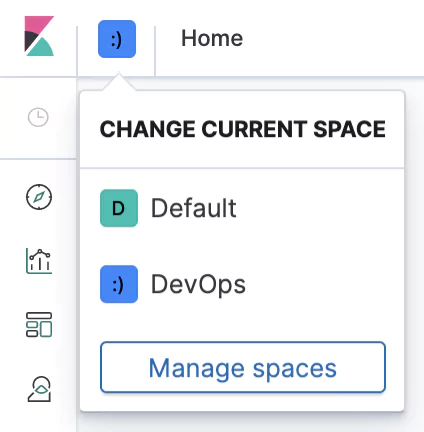
Well done, your first custom space is ready! Now we can see the new space in the top left menu by clicking on the Spaces icon next to the Kibana logo. This menu is great for quickly jumping between different spaces.
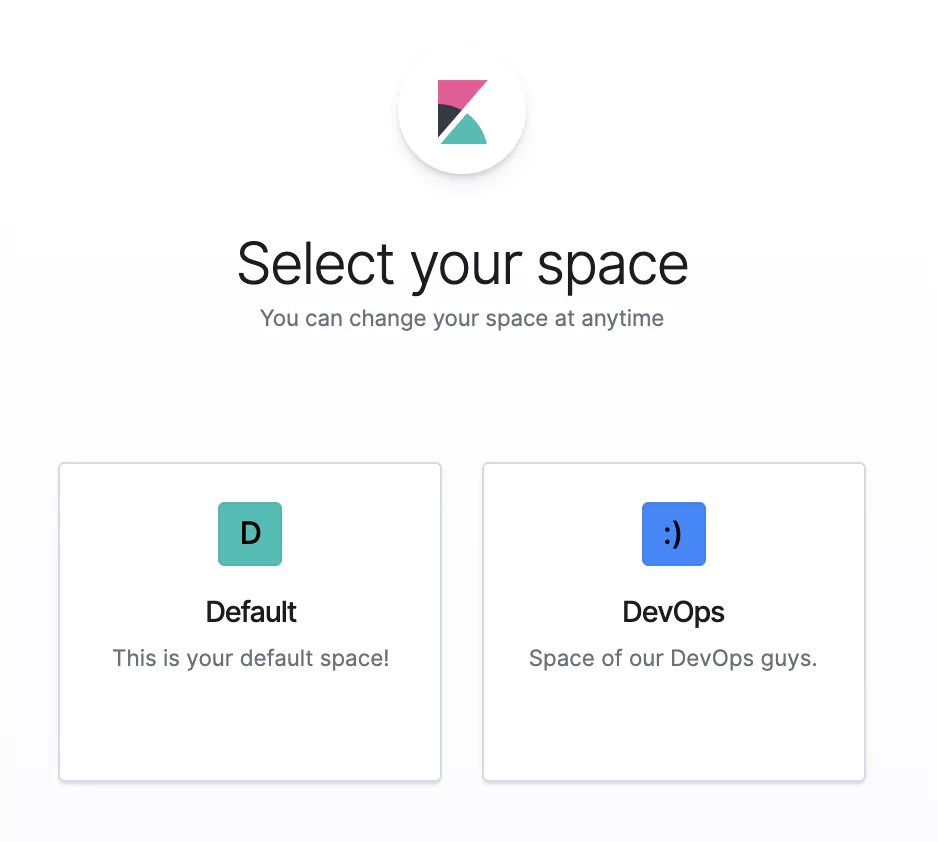
Note: The next time you or other users log into Kibana, you will be prompted with selection boxes to pick from the existing spaces on your Kibana instance.
Perfect! Now just to complete the picture for you, there is also an API to perform these administration tasks of Spaces. For example, you can get a space by its id like this:
curl 'localhost:5601/api/spaces/space/devops'
… and receive basic information on that Space.

And just to give you a sense of what’s possible with the API, we can create, update, and delete Spaces, as well as copy Saved Objects between Spaces.
Next, let’s take a look at how to migrate Kibana objects.
Migrating Saved Objects
The primary function of the spaces is to separate Saved Objects between various user groups. So to see it in action we need to have some Saved Objects created first. Let’s import a premade dashboard and a couple of related objects so that we don’t have to create them manually :). Download this dashboard for Heartbeat to your host machine where you access Kibana. Wget can do it or just right-click it in your browser and use Save as.
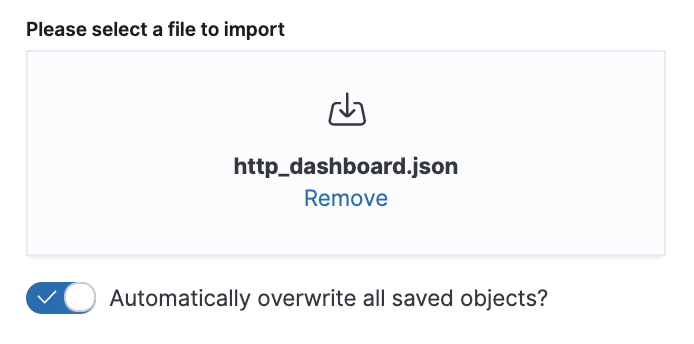
Now let’s make sure we’re in our DevOps space and head to the Management app → and then we’ll go to the Saved Objects section. Click Import in the right corner and pick the http_dashboard.json file that we just downloaded as the imported resource. Then, click Import.
This should import eight Saved Objects (the dashboard, a couple of visualizations, an index pattern, and one saved search). We don’t have any data for these so we can’t actually visualize anything with them, but for our demonstration, we only need them to be present in our DevOps space.
Now, just to reinforce the concept of Spaces that we touched on earlier, let’s switch to the Default space and head over to the Saved Objects section. Notice that we don’t find any of the imported objects. Neither will we see them in the Dashboard or Visualize sections. This is a great demonstration of how Kibana Spaces allow you to organize your data according to user needs.
But now, let’s jump back to our DevOps space and then navigate to the Saved Objects section. We’ll simulate what it would be like to transfer objects between different Spaces. We have two options here:
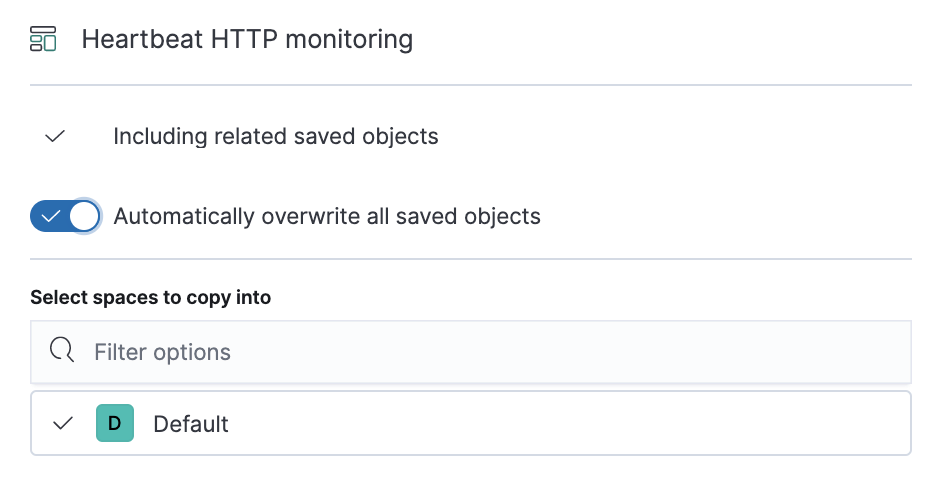
- Same Instance: First, we can copy any object between spaces within the same Kibana instance. This can be done by clicking the three dots symbol next to any saved object (make sure none is selected before doing so) and selecting Copy to space. Afterward, you can pick one or more spaces and finish by clicking Copy. This will duplicate the given saved object (and others like the associated index patterns or all visualizations on a dashboard).
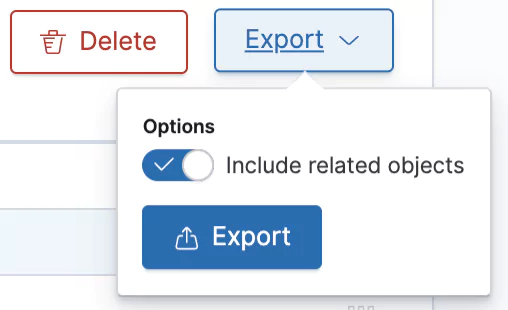
- Different Instances: Secondly, if you need to migrate Kibana objects between different instances, for example from your testing environment to production, you could do so by exporting the objects to a file. This can be done easily by selecting one or more objects and clicking Export. It will be downloaded as a newline-delimited JSON file and we can import it anywhere just like we imported the Dashboard earlier.
Advanced Kibana settings
For our last expedition, let’s head over to the Advanced Settings section in the Management app where many settings are concentrated.
First of all, bear in mind the warning box that is displayed on top of the page saying “Caution: You can break stuff here”. This is true. All sorts of settings, both “high” and “low” level, are found here in one place, so always double-check what you’re about to tweak. Secondly, these settings are mostly applied to the active space (i.e. not globally), which is useful for our case.
Landing page
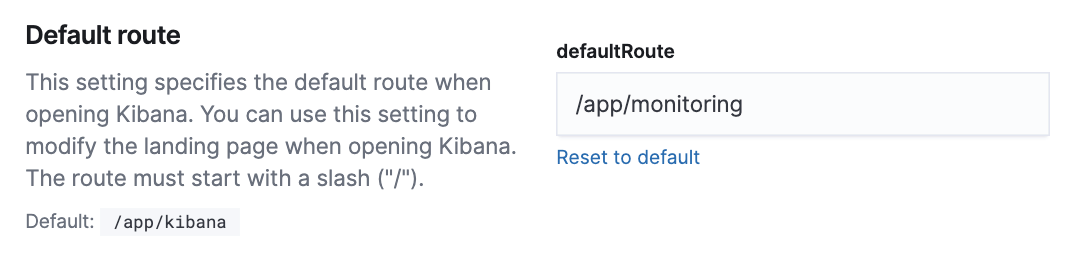
You can change the default landing page to which the users are redirected when they switch to a given space. Do so with the Default route setting. Here we have switched the default landing page to the Monitoring app which aggregates information about our Elastic Stack components. For example, our Operations team can go straight to the overview of the cluster, similarly, you can guide marketing users to their main dashboard.
Dark Mode

Next, if you prefer, you can change your Kibana UI to Dark mode with black and gray as the base colors. This could help reduce eye strain in low-light.
Time Settings
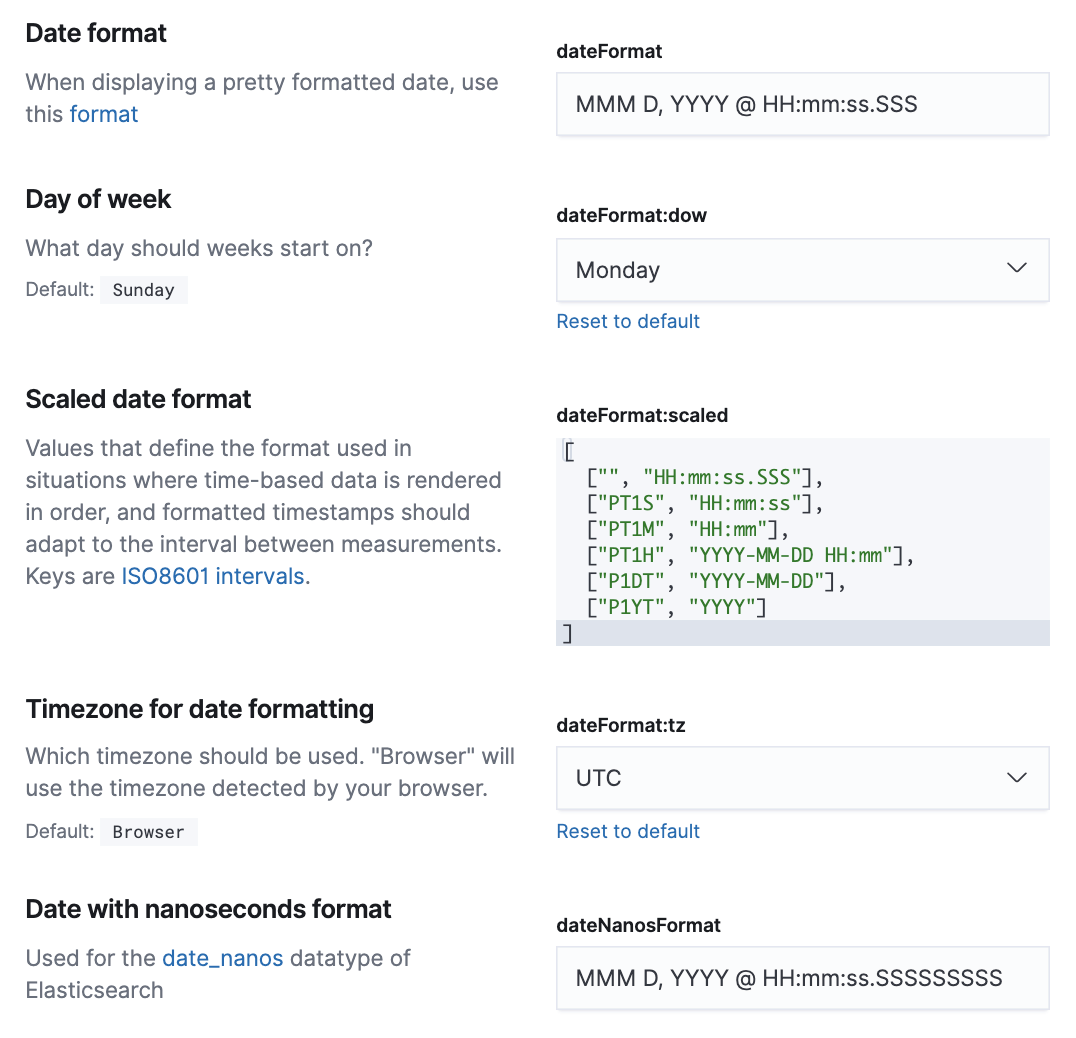
Lastly, we’ll take a quick look at various time-related settings that are available. These settings only affect how the dates are displayed in Kibana and not their persisted form which is stored in Elasticsearch.
In this section we can change:
- The display formats of timestamps to have them “prettified” in the UI
- The starting day of the week depending on the standard in your region.
- The timezone used to “recalculate” the displayed time. It defaults to your browser settings (which adopt your OS timezone), but you can change it, for example to UTC or some specific timezone. This can be useful when you need to troubleshoot an incident with colleagues across other timezones.
That about sums up the more common management tasks that you’ll be performing in Kibana.
Learn More
- Kibana Advanced Settings
- Kibana server configuration in the kibana.yml