How to manage your Docker Logs with ELK and Fluentd


This article provides an overview of managing and analyzing Docker logs and explores some of the complexities that may arise when looking through the log data.
Challenges to overcome:
- Collecting logs from the host machine
- Handling a high volume of logs
- Structuring logs for easy querying
- Debugging the Docker Daemon
We will go through the default log monitoring approach, as well as look at some more advanced configurations that will make diagnosing issues in your Docker-hosted applications much easier going forward.
Prerequisites
This article has been written for use on MacOS. It is possible to run through the same Docker commands using Windows or Linux as well, but some steps, commands or file locations may vary. Please refer to the official Docker documentation for further details in these areas.
Based on a vanilla installation of MacOS, the following other programs are needed to follow along with the tutorials in this article:
- Docker Desktop for Mac
- Node.js and Node Package Manager (npm)
- cURL (optional)
How do Docker Logs work?
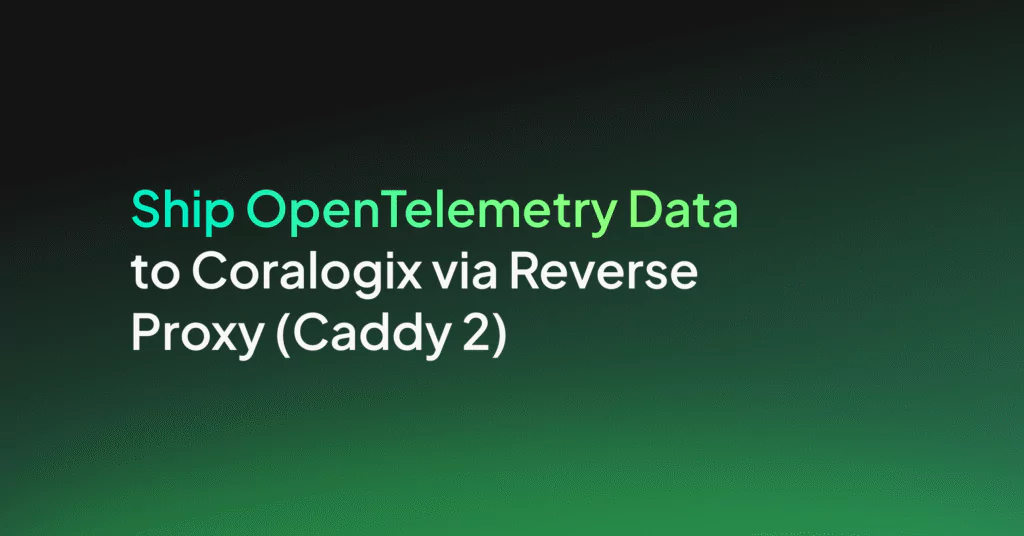
The default configuration of Docker supplies a view of the logs emitted from containers (and the applications within) in two forms: the console or standard output (also known as stdout) and JSON-formatted files stored on the hard disk.
Docker also exposes a remote API that allows users to run a command through the terminal to view the logs stored in these files. This is fine in a scenario where there is one, or a few containers running on one machine, but in a world of applications being comprised of a collection of smaller components (i.e. microservices) that may be hosted across many different servers (both physical and virtual), it becomes a very big problem to try to use these basic log outputs to diagnose any potential issues. Not to mention the fact that trawling through these files would be an arduous and manual task, prone to missing vital information, and complex to build automated alerts around.
So, let’s start by looking at what Docker offers by default for logging. Assuming you have Docker fully installed, run the following command in the terminal:
$ docker run hello-world
This command creates a new container from a simple image hosted on Docker Hub called “Hello World”. It simply outputs an informational message with some additional links to guide you to more resources to help you get started with Docker. It is also a great way to verify that your Docker installation has been setup correctly. You can see an example of the output of this command on Docker Hub.
Now that you have run that command, a single container should exist within Docker. Since the Hello World image outputs a message when started and then stops again, the subsequent container will exist in a stopped state. You can view this container with the following command:
$ docker ps –a
[Output]
CONTAINER ID        IMAGE               COMMAND             CREATED             STATUS                      PORTS               NAMES
b53f3a24df95        hello-world         "/hello"            12 minutes ago      Exited (0) 12 minutes ago                       vibrant_dirac
The –a option tells Docker that you want to view all containers returned by the ps command, regardless of state.
Running this command should display some information for all containers in a tabular format, including the container ID and NAME. The ID is a unique identifier generated for each individual container. The NAME can be explicitly specified by the user when creating the container, or if omitted, Docker will automatically generate one. ID and NAME values both must be unique as they are used to refer to containers when utilizing Docker.
Next, we need to check the logs for the container. Docker supplies two ways for us to do this.
- Looking at the file written to disk
- Using the Docker Remote API command
Docker Log File
First, let’s look at the file written to disk. Docker outputs these files to different locations based on the operating system and installation method. You can view the different locations in the Docker documentation. For now, we are only interested in the location on MacOS, which is under the path /var/lib/docker/containers/.
There are occasions where the log file may not exist in the location you expected (such as when installing Docker via Snap on Linux). This is easy to confirm, as the location is stored against each container under the “LogPath” JSON property when inspecting. You can use the format inspection option to select this for a given container.
$ docker inspect b53f3a24df95 --format “{{.LogPath}}”
[Output]
/var/snap/docker/common/var-lib-docker/containers/f324c0ac408b70c4b40569c5ebcf24ebab0e8452e467a53d3558b61c5d3f8e06/f324c0ac408b70c4b40569c5ebcf24ebab0e8452e467a53d3558b61c5d3f8e06-json.log
When a container starts logging information, a new file is created within the containers folder, under a sub folder named with the full ID of the container. So, the full path any container’s log file will be:
/var/lib/docker/containers/<CONTAINER ID>/<CONTAINER ID>-json.log
You will notice in the output above, that we only get the container ID in the short format (b53f3a24df95), but the folder and files will be named with the long format. Sometimes this is sufficient when you don’t have many containers, but as your number of containers grows, you will want the long format ID. To get this we need to inspect the container (using its short format ID as reference):
$ docker inspect b53f3a24df95
This will return a large JSON result back, which holds all the information about the container. For now, we are only interested in the full ID. This should appear as the first property near the top of the output, but to make it easier, we will use the format option, which will allow us to select the “Id” property in the JSON response:
$ docker inspect b53f3a24df95 --format “{{.Id}}”
[Output]
b53f3a24df9543fb755019fd01778918afb03a2cc46540209dd60b9871e11203
Using this full ID, we can now look for the relevant log file at the path:
/var/lib/docker/containers/ b53f3a24df9543fb755019fd01778918afb03a2cc46540209dd60b9871e11203/ b53f3a24df9543fb755019fd01778918afb03a2cc46540209dd60b9871e11203-json.log
Docker Remote API
The second and more user-friendly, way to view the logs for a container is to use the Docker Remote API command: logs. The simplest form of this command is to just display a pre-formatted (I.e. not JSON-formatted) view of a container’s logs. To do this, simply run the following command for our Hello World container:
$ docker logs b53f3a24df95
Note: You can reference the container with either the unique ID or NAME.
The output of this command should be the same as the output you saw when you first ran the Hello World container. For other containers, the output will show you what is currently in the logs. While this is fine for containers with small logs, it very quickly becomes unwieldy when the log file grows. Before we talk about how to manage this, let’s take a step back and look at the format of the command. You can view this by specifying the –help option (this can be done for any command).
$ docker logs --help
[Output]
Usage:    docker logs [OPTIONS] CONTAINER
Fetch the logs of a container
Options:
--details        Show extra details provided to logs
-f, --follow         Follow log output
--since string   Show logs since timestamp (e.g. 2013-01-  02T13:23:37) or relative (e.g. 42m for 42 minutes)
--tail string    Number of lines to show from the end of the logs (default "all")
-t, --timestamps     Show timestamps
--until string   Show logs before a timestamp (e.g. 2013-01-02T13:23:37) or relative (e.g. 42m for 42 minutes)
After the logs command there are two components: OPTIONS and CONTAINER. We have already seen that CONTAINER can be replaced with the unique ID or NAME of the container for which we wish to view the logs. OPTIONS can be optionally replaced with one or more of the options detailed lower in the help output. These options can help when looking at a container’s logs, so let’s look at some of them.
Before we investigate these options, it will be useful for us to spin up a container that will run indefinitely so we can see what it is like interrogating the logs of a running container. Run the following command from the terminal:
$ docker run -d alpine sh -c ‘while true; do echo “[$(date +%c)]: This is a log entry”; sleep 5; done’
[Output]
2f918b7bda8cc332d84c22e24f4f5044e750d68c442baa68579202d82563f69a
Let’s quickly break down this command so we can see what’s going on.
- docker run -d alpine – This tells docker to spin up a new container from the latest Alpine Linux image hosted on Docker Hub. The -d option tells Docker we want to be detached from the container when it is running, which allows us to attach/detach as we please.
- sh -c ‘…’ – Anything added after the name of the Docker Image is the process that should be executed within the container once it has started. In this case, we want to start a shell and use it to execute the command inside the quotes.
- while true; do echo “[$(date +%c)]: This is a log entry”; sleep 5; done – This is the command we wish to execute inside the container. It is a simple, infinite while loop that will print out a message to the standard output every 5 seconds. It is this message that will see stored as entries within the container’s logs.
Once Docker has started the container because we have said we want to detach from that container, control should be given back to the user in the terminal and the ID of the container should be printed. You can check that the container is now running using the following command:
$ docker ps
[Output]
CONTAINER ID        IMAGE               COMMAND                  CREATED             STATUS              PORTS               NAMES
2f918b7bda8c        alpine              "sh -c 'while true; …"   3 minutes ago       Up 3 minutes                            naughty_hugle
You can also view the logs that the container has already started producing using the logs command again:
$ docker logs 2f918b7bda8c
[Output]
[Mon Jun 22 12:21:05 2020]: This is a log entry
[Mon Jun 22 12:21:10 2020]: This is a log entry
Follow the logs
Going back to the log command options, the first one worth mentioning is the “follow” option. According to the help output, this can be specified in long (–follow) or short (-f) format, as with a lot of options in the Docker commands. The following command simply gives you a real-time view of the logs for a container as they are being generated and will continue to follow the live logs until the container stops or the process is canceled. Try this now on the container you have just created.
$ docker logs –f 2f918b7bda8c
[Output]
[Mon Jun 22 12:21:05 2020]: This is a log entry
[Mon Jun 22 12:21:10 2020]: This is a log entry
[Mon Jun 22 12:21:40 2020]: This is a log entry
[Mon Jun 22 12:21:45 2020]: This is a log entry
[Mon Jun 22 12:21:50 2020]: This is a log entry
[Mon Jun 22 12:21:55 2020]: This is a log entry
You can see here that the command has started displaying a live view of the logs generated by the running container, starting with the logs that already exist within the log file. If you leave this running for a little while, you will notice that a new log entry appears every 5 seconds. Once you have seen enough, cancel the process to return control back to the terminal.
Show logs since
The next option we will look at is the –since option. By now, we should have started to see a number of logs appear in the log file. Consider this in a real-world scenario where a container may be running for days, weeks or even months, and outputting log messages that whole time. You would end up with too many log entries to practically search through with ease. This is where date/time-specific filters can help, such as the –since option. This option will allow us to view only the log entries that have been output since a specific date and/or time in the past. Let’s try it now. Enter the following command in your terminal (note that you will have to adjust the date/time parameter to something relevant to when your container has been running):
$ docker logs --since 2020-06-23T12:01:00Z 2f918b7bda8c
[Output]
[Tue Jun 23 12:01:00 2020]: This is a log entry
[Tue Jun 23 12:01:05 2020]: This is a log entry
[Tue Jun 23 12:01:10 2020]: This is a log entry
[Tue Jun 23 12:01:15 2020]: This is a log entry
[Tue Jun 23 12:01:20 2020]: This is a log entry
[Tue Jun 23 12:01:25 2020]: This is a log entry
[Tue Jun 23 12:01:30 2020]: This is a log entry
[Tue Jun 23 12:01:35 2020]: This is a log entry
[Tue Jun 23 12:01:40 2020]: This is a log entry
[Tue Jun 23 12:01:45 2020]: This is a log entry
[Tue Jun 23 12:01:50 2020]: This is a log entry
[Tue Jun 23 12:01:55 2020]: This is a log entry
Here, I have told Docker that I want to view the logs for the container that were output since 23/06/2020 at 12:01pm. You will note that this value is in ISO format. The time part will not be included if the format is not correct (i.e. you need to separate date and time with the ‘T’ and end with the ‘Z’).
The –since option can also take in values in other formats, such as a specific length of time. For example, if you wanted to view the logs that have been output for the last 5 minutes, you could use the following command:
$ docker logs --since 5m 2f918b7bda8c
Of course, this option can be combined with other options to give a more specific window of log messages. Experiment with a few more of the options so that you can start to see what you can do with this command.
Optimizing Your Docker Logs
The first problem with application logs is, historically, they’ve been quite simple. By this, I mean that they are usually a one-line informational message, output to describe some small marker in the code. Often, they don’t contain any more detail than that and therefore are usually very unhelpful when trying to decipher what has happened within an application. The tried and tested “solution” here is to simply apply a severity level to each message (info, debug, critical, warning, etc) so that we can filter out any noisy messages on production servers. However, this still doesn’t address the issue of a lack of detail, and it also then removes any other messages from the logs that might give some context to any error messages that do exists (such as what the application was doing right before the error occurred). Enter: Structured Events.
Structured Events
Structured Events are log entries from your application that hold context and more detail. The purpose being twofold:
- You have more information around a particular event in your application (be that an error or something else), which will make it easier when trying to understand what your application has been doing at any given point in time.
- You can pipe out those messages into a system that will allow you to build queries around pieces of information within the logged event. Thus, enabling you to trace events and information more easily.
When you consider the fact that disk space nowadays is much cheaper, and also bring in external systems that are built for the sole purpose of collecting log information; you end up in a place where you no longer need to filter out non-error messages from your Docker logs and instead can consider all logs to be important. Additionally, code no longer needs to be littered with fragmented log messages to paint a picture of the inner workings of the application. Instead, when structured events are logged out, an application can be described by small, specific log points within the application.
Building on this concept of Structured Events, let’s set up our own simple application and talk about what we can do with Docker to start moving us toward more useful log information.
Making Queryable Logs
To begin with, we are going to write a basic NodeJS application. From that, we will build a Docker Image, which will be spun up in a container and allow us to view the log output. We will output the logs in JSON format. You do not need to have any previous knowledge of NodeJS, JavaScript, or writing Dockerfiles, as we will walk through each step and everything can be done directly from the command line.
Step 1: Create the application
The first step is to create the actual NodeJS application. For this, we need to create a single file, which we will name app.js. You may notice by the file extension, that this is a JavaScript file, which is what Node can run. You do not need Node installed locally for this section, as we will build a Docker Image that will contain the Node runtime, allowing the application to be run within Docker and without need for any additional tools or dependencies to be installed on your local machine.
From the terminal, launch your editor of choice. In this tutorial, I will be using the terminal-based application, Nano, as it comes preinstalled on MacOS and many Linux-based operating systems. You do not need to use a terminal based text-editor though, as you can use any editor to create and edit the file.
$ mkdir logging-in-docker
$ cd logging-in-docker
$ nano app.js
These three commands will create a new directory named “logging-in-docker”, change the location of the terminal to be inside this folder, and then create a new file named “app.js” and launch it with the terminal-based Nano text-editor. Once the file is open, populate it with the following JavaScript code:
const tickInterval = 4000
const tockInterval = 4000
const tockDelay = 2000
let tickIntervalHandle
let tockTimeoutHandle
let tockIntervalHandle
const logEvent = (eventName, functionName, message) =>
console.log(JSON.stringify({
timestamp: new Date(),
eventName,
functionName,
message
}))
const tick = () => logEvent("TICK", "tick()", "Tick...")
const tock = () => logEvent("TOCK", "tock()", "Tock!")
function startClock() {
// Tick every 4 seconds
tickIntervalHandle = setInterval(tick, tickInterval)
// Tock every 4 seconds, starting in 2 seconds
tockTimeoutHandle = setTimeout(() =>
tockIntervalHandle = setInterval(tock, tockInterval), tockDelay)
}
logEvent("APPSTART", null, "Starting application...")
startClock()
// Handle the application receiving an interruption signal
// so that we can log the end of the application and gracefully
// clean up all scheduled function calls
var process = require("process")
process.on("SIGINT", () => {
logEvent("APPSTOP", null, "Application stopped!")
// Clear the timeout and intervals if they have been scheduled
// i.e. if we have stored the handles for them
if (tickIntervalHandle) {
clearInterval(tickIntervalHandle)
}
if (tockTimeoutHandle) {
clearTimeout(tockTimeoutHandle)
}
if (tockIntervalHandle) {
clearInterval(tockIntervalHandle)
}
// Stop the application process
process.exit(0)
})
I won’t go into detail about how this program works as that is outside of the scope of this article, but what we expect from this is that we should receive structured log messages pertaining to 4 different events within the application:
- APPSTART – this event will be logged when the application starts up
- APPSTOP – this event will be logged when the application stops
- TICK – this event should occur every 4 seconds from when the application started
- TOCK – this event should also occur every 4 seconds, starting 2 seconds after the application started
If you do have NodeJS installed on your local machine already, you can test this code by running the following command:
$ node app.js
Step 2: Build a Docker Image and start a new container
Next, we need to write a Dockerfile. A Dockerfile is a file that contains a special set of instructions to tell Docker how we want to compose our image, the dependencies required, the files to include and the command or process to run when a new container is spun up from the image. You can read more about Docker Images and writing your own Dockerfile here. For now, simply create a new file next to your app.js file, called Dockerfile (no file extension), and enter the following content:
FROM node:10
COPY app.js /usr/src/app/app.js
WORKDIR /usr/src/app
CMD [ "node", "app.js" ]
Briefly, this image tells Docker to use the node:10 image on Docker Hub as a base, copy the app.js file to the location /usr/src/app/app.js within the image, set the /usr/src/app/ directory as the working directory, and then run the command node app.js when the container starts up. To test this, we need to build a Docker image from this Dockerfile, and then spin up a new container.
First, build the new Docker image.
$ docker build –t node-log-app .
[Output]
Sending build context to Docker daemon   5.12kB
Step 1/4 : FROM node:10
10: Pulling from library/node
81fc19181915: Pull complete
ee49ee6a23d1: Pull complete
828510924538: Pull complete
a8f58c4fcca0: Pull complete
33699d7df21e: Pull complete
923705ffa8f8: Pull complete
667ab65c1289: Pull complete
9c3f7667ed73: Pull complete
03e9677c0489: Pull complete
Digest: sha256:f9e66964ec6e9a78693929b58b3d95aadf03cc70e47f6d276d1e0943853c2bb5
Status: Downloaded newer image for node:10
---> e7671d9424c2
Step 2/4 : COPY . /usr/src/app
---> 846adac2a298
Step 3/4 : WORKDIR /usr/src/app
---> Running in e90d42396363
Removing intermediate container e90d42396363
---> 56c91a7af7b5
Step 4/4 : CMD [ "node", "app.js" ]
---> Running in 0b83111a500e
Removing intermediate container 0b83111a500e
---> 9fdcff945749
Successfully built 9fdcff945749
Successfully tagged node-log-app:latest
The –t option allows us to tag the image with a specific name (in this case, “node-log-app”). This is used here to just give it something simple so we can refer to it later, but would normally be used to add the name of the repository where you want to store the image, the name of the image, and the version of the image you have built. You can read more about this command here.
You can see in the output of this command that Docker starts by pulling down the layers of the base image before executing each instruction inside the Dockerfile we created. Once complete, the image will now exist with the image name and tag of “node-log-app:latest”. Note that when referring to images with a tag of “latest”, you can omit the tag and just specify the image name. Tags are useful though when you want to use a specific tagged version of an image.
Now that the image has been built, you can view it within Docker using the following command to list all images:
$ docker images
[Output]
REPOSITORY          TAG                 IMAGE ID            CREATED             SIZE
node-log-app      latest           9fdcff945749    24 minutes ago 912MB
node                   10                   e7671d9424c2    13 days ago       911MB
hello-world        latest           bf756fb1ae65    5 months ago   13.3kB
Like containers, we can see a list of all images that have been downloaded into our local Docker installation listed in a tabular format. We can also see that an image has both name and unique ID. The name in this case is REPOSITORY. You can refer to an image by its ID, by REPOSITORY or by REPOSITORY:TAG if the TAG is something other than “latest”.
Now we have an image, we need to spin up a new container. To do this, run the following command from the terminal:
$ docker run -d --name logger-app node-log-app
[Output]
2f0267e679958be654521f0cda60cb6c3a710ae1e25de62161b4fb37680ae751
That’s it! Our container should now be running within Docker and outputting structured event logs. Using what we have already gone over about viewing logs, take a few minutes to look at the logs output from the new container. You should see something like this:
$ docker logs --tail 10 logger-app
[Output]
{"timestamp":"2020-06-25T14:46:59.312Z","eventName":"TOCK","functionName":"tock()","message":"Tock!"}
{"timestamp":"2020-06-25T14:47:01.285Z","eventName":"TICK","functionName":"tick()","message":"Tick..."}
{"timestamp":"2020-06-25T14:47:03.313Z","eventName":"TOCK","functionName":"tock()","message":"Tock!"}
...
Note that by converting our JSON object to a string before logging to the console in JavaScript, Docker stores each entry together. Otherwise, logging the object directly would result in it being stored over multiple log entries within the log file.
Step 3: Change the log driver
When it comes to logging, Docker supplies a mechanism for controlling its behavior. By default, as we have discussed, Docker writes all logs to a JSON-formatted log file on the disk, as well as outputting these entries to the standard output stream. We can use Docker’s logging mechanism by configuring the log driver that is used. These log drivers collect logs from the Docker system and its containers and output them to a particular location. This location could be a file (as seen in the default configuration) or even a remote API. Docker supports a few existing logging drivers. We have the choice of either changing the logging driver used for an individual container, or changing the driver used for everything we do in Docker.
To gain a better understanding of this, let’s change the log driver used for our application. For the sake of simplicity, we will change the log driver to local for now, as this will still allow us to view the logs through the remote API, but we will be able to see that no JSON-based log file will be created. Later, we will investigate more verbose log location alternatives. But for now, simply run the following command to spin up a new container for our application, using the local log driver (don’t forget to remove the old container if you are using the same name).
$ docker run -d --name logger-app --log-driver local node-log-app
[Output]
4e30346120b47883bfb5ff8a8eca555a63e48d4c4adda56453a652125b7dd22c
We can now view the logs through the remote API.
$ docker logs -f logger-app
[Output]
{"timestamp":"2020-06-28T09:25:31.668Z","eventName":"APPSTART","functionName":null,"message":"Starting application..."}
{"timestamp":"2020-06-28T09:25:35.672Z","eventName":"TICK","functionName":"tick()","message":"Tick..."}
{"timestamp":"2020-06-28T09:25:37.674Z","eventName":"TOCK","functionName":"tock()","message":"Tock!"}
{"timestamp":"2020-06-28T09:25:39.673Z","eventName":"TICK","functionName":"tick()","message":"Tick..."}
But if we inspect the container to see where the logs are written to on disk, we will see that there is no log path defined, which shows us that Docker does is not writing the logs to disk under the local log driver configuration.
$ docker inspect --format “{{.LogPath}}” logger-app
Handle High Docker Log Volumes
Logging in Docker can be handled in two ways: synchronous (blocking) and asynchronous (non-blocking). These are called log delivery modes. The blocking mode is what Docker is configured to use by default and causes an application to wait for the message to be logged before it can continue execution. In a small application, where there are likely to be infrequent and small log entries, this is fine. However, when an application becomes larger, emits regular log entries, or log entries are large, then the blocking mode will begin to slow down the application. Instead, the non-blocking, or asynchronous, the delivery mode can be used in this scenario.
Under the default configuration, Docker will write all log entries into a JSON file, as we have already seen. Since this is writing to a file on the disk locally, the chances that this form of logging will cause any performance degradation is exceedingly small. So, using the blocking delivery mode makes sense here.
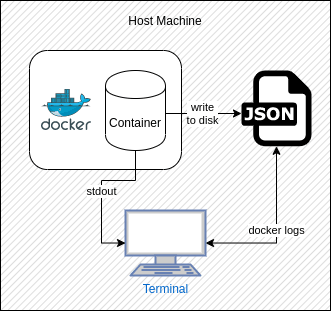
The non-blocking log delivery mode is exactly how it sounds: collecting log entries emitted from the application will not affect performance by blocking its execution. This is done using an in-memory ring buffer: a method of temporarily storing log entries in RAM before they are asynchronously passed to the log driver.
Switching to non-blocking log delivery mode
Now that we have talked about the two different log delivery modes, we will look at the non-blocking log delivery mode offered when running containers. We first need to remove the existing container (assuming you want to reuse the container name) and then spin up a new container from the same image but including some new parameters.
$ docker stop logger-app
$ docker rm logger-app
$ docker run -d --name logger-app
--log-opt mode=non-blocking
--log-opt max-buffer-size=4m
node-log-app
There are two log options we have specified here that will be passed to the container:
- mode=non-blocking – this should be self-explanatory. This is how we tell Docker that we want to use the asynchronous method of collecting log entries from the container.
- max-buffer-size=4m – since we have specified the non-blocking mode, Docker will use a ring buffer to temporarily collect our logs before asynchronously passing them to the log driver. In our case, we have specified a buffer size of 4 megabytes. The default is 1 megabyte if this option isn’t specified.
At this point, following the logs, you should see that they are being output just the same as before. When using this approach, however, loss of log entries is possible. If log messages are output quicker than Docker can retrieve them from the ring buffer, then eventually the buffer will fill up and exceed the space given. When this happens, Docker will remove the oldest entry from the buffer to make space for the latest entry. This can be mitigated by increasing the size of the ring buffer, but it is a trade-off of using this type of approach. It may also be possible for the message loss to occur if the ring buffer is too small and the log entries are too large that they may simply exceed the given memory.
Message Loss
We have just touched on one of the drawbacks of using the non-blocking log delivery mode: message loss. In our current application, we only emit a log message every 2 seconds. Since we are using either the local or JSON-file log drivers, all log collection is very quick, so we should not be experiencing any message loss as Docker will forward the messages onto the log driver before too many messages can be stored in the ring buffer. However, in larger applications, this may not be the case.
The best way for us to understand this is to simulate it. To make things easier, we will create another small application. Call this file high-volume-app.js and type in the following contents:
const logCount = 1000000
for (let i = 1; i <= logCount; i++) {
console.log(JSON.stringify({
timestamp: new Date(),
messageId: i,
message: `Message #${i} of ${logCount}`
}))
}
Now we need to change our Dockerfile so that it copies the new application file into the image rather than our “tick/tock” application. Change the contents to the following:
FROM node:10
COPY high-volume-app.js /usr/src/app/app.js
WORKDIR /usr/src/app/
CMD [ "node", "app.js" ]
Now rebuild the Docker image from this new file setup, remove any old containers if you are re-using the same container name, and spin up a new container using the following command:
$ docker run --name logger-app
--log-opt mode=non-blocking
--log-opt max-buffer-size=1k
node-log-app
[Output]
...
{"timestamp":"2020-06-28T11:36:16.282Z","messageId":999998,"message":"Message #999998 of 1000000"}
{"timestamp":"2020-06-28T11:36:16.282Z","messageId":999999,"message":"Message #999999 of 1000000"}
{"timestamp":"2020-06-28T11:36:16.282Z","messageId":1000000,"message":"Message #1000000 of 1000000"}
You may notice that we have omitted the detach option this time, which is because we want to watch all messages being printed to the console so that we can see the final messages come through. We have also specified the non-blocking delivery mode and a max buffer size of only 1 kilobyte. The reason for the tiny buffer is to increase the chances of losing the log messages.
Once the application has printed all 1 million messages, you will be able to see that they are all still in order. This is because these messages have been printed directly to the standard output stream, whilst also being stored in the ring buffer. If we now using the remote API to view the logs that have been recorded in the JSON file, we should see that some of them have been lost.
$ docker logs --tail 5 logger-app
[Output]
{"timestamp":"2020-06-28T11:36:16.282Z","messageId":999969,"message":"Message #999969 of 1000000"}
{"timestamp":"2020-06-28T11:36:16.282Z","messageId":999977,"message":"Message #999977 of 1000000"}
{"timestamp":"2020-06-28T11:36:16.282Z","messageId":999986,"message":"Message #999986 of 1000000"}
{"timestamp":"2020-06-28T11:36:16.282Z","messageId":999990,"message":"Message #999990 of 1000000"}
{"timestamp":"2020-06-28T11:36:16.282Z","messageId":999997,"message":"Message #999997 of 1000000"}
As you can see in this sample output, we get messages 999969, 999977, 999986, 999990, and 999997. This shows that a sizeable number of messages have been lost between being output by the application (and displayed in the standard output stream) and being recorded by the JSON log driver in the log file.
If you still see the correct order of log entries in the end, then you can set the max-buffer-size even smaller to a value of 0k. This will render the buffer practically non-existent.
Collecting Docker Logs
Up until now, we have looked at the two log delivery modes that Docker has to offer (blocking and non-blocking), as well as the pros and cons of each. To quickly recap: the blocking approach guarantees no message loss but may degrade application performance, while the non-blocking approach does not degrade application performance but also cannot guarantee that no messages are lost. Neither approach is ideal when we get to the larger applications.
Another drawback we have currently is that the storage of all logs is in different places. With just one or a few containers, this isn’t an issue, but as we mentioned at the start of this article when we get too many containers that may span many servers, we end up with log files that are too distributed and not really accessible. To resolve this, we need to collect our logs and store them in a central location. This will allow us to set up a dedicated area for log storage and management, and supply easy access, a single source of truth for any log analysis we may need to do that will cover our entire infrastructure.
We have a few options here that will resolve both drawbacks. For this article, each option will send our logs to a central Elasticsearch instance. We can then run Kibana over the top to view and analyze these logs. Let’s go through each option, set up an example so we can see how it would work, and then discuss the pros and cons.
Sending logs to Elasticsearch directly from the application
For our first way, we are going to look at changing our existing application to push logs directly to an Elasticsearch instance and view those logs through Kibana (both products of the Elastic Stack). I’m not going to delve too deeply into how all of these components work, as that is outside of the scope of this article. Instead, we will be looking at how the setup and architectural design can help us to solve the issues of the default logging experience in Docker.
The first step is to set up an Elasticsearch instance to store our log entries, alongside a Kibana instance to view and analyze this data. For this, we are going to use another Docker product: Docker Compose. This allows us to write a file (similar in principle to a Dockerfile) that describes the configuration of multiple (often interacting) containers. To do this, create a new file alongside our existing application files, called docker-compose.yml (this is the default name given to a Docker Compose file). This file should have the following contents:
 version: '3.0'
services:
elasticsearch:
image: elasticsearch:7.8.0
ports:
- "9200:9200"
- "9300:9300"
environment:
- discovery.type=single-node
kibana:
image: kibana:7.8.0
ports:
- "5601:5601"
Briefly, this file will instruct Docker to spin up 2 containers: Elasticsearch (image version 7.8.0) and Kibana (image version 7.8.0). Given we are using a Docker Compose file, Docker will create an internal network that both containers will live within. This allows Kibana to link to our Elasticsearch instance using the address https://elasticsearch:9200. The Elasticsearch component is an alias within the network to the Elasticsearch container defined in this Docker Compose file, while port 9200 is the port that the Elasticsearch instance listens on for HTTP traffic.
To run this file, we need to use Docker Compose from within the terminal. Enter the following command:
 $ docker-compose up –d
[Output]
Creating network "elasticsearch-direct_default" with the default driver
Pulling kibana (kibana:7.8.0)...
...
Status: Downloaded newer image for kibana:7.8.0
Pulling elasticsearch (elasticsearch:7.8.0)...
...
Creating elasticsearch-direct_elasticsearch_1 ... done
Creating elasticsearch-direct_kibana_1        ... done
This will use Docker Compose to spin up both containers. If you haven’t run it or downloaded the aforementioned images before, this may take a few minutes as Docker will pull down the images first. Once complete, you can follow the logs inside of the Kibana container until you see that it is listening on port 5601. This is how we know the applications have finished their setup. As a quick note, you can either view the logs on the container as we have before, or you can refer to the service by name in the Docker Compose file, with a command such as:
$ docker-compose logs –f kibana
To confirm that they are up and running, first run a cURL command from the terminal to verify that Elasticsearch is running:
 $ curl https://localhost:9200
[Output]
{
"name" : "c7c5ff0ec159",
"cluster_name" : "docker-cluster",
"cluster_uuid" : "ohAVaLTHQ2KBn-LFuJdf0g",
"version" : {
"number" : "7.8.0",
"build_flavor" : "default",
"build_type" : "docker",
"build_hash" : "757314695644ea9a1dc2fecd26d1a43856725e65",
"build_date" : "2020-06-14T19:35:50.234439Z",
"build_snapshot" : false,
"lucene_version" : "8.5.1",
"minimum_wire_compatibility_version" : "6.8.0",
"minimum_index_compatibility_version" : "6.0.0-beta1"
},
"tagline" : "You Know, for Search"
}
Note that we can access this container via localhost as we have mapped port 9200 inside the Elasticsearch container to the same port number on the local machine.
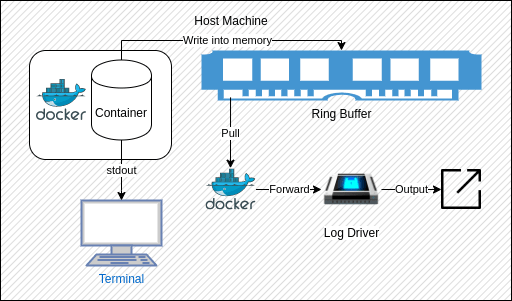
To verify that Kibana is running and is correctly connected to Elasticsearch, visit the URL https://localhost:5601/status in the browser and look for the Elasticsearch plugin to check that it has loaded successfully.
Note that in recent versions of the Kibana Docker image, the container won’t finish initializing if it cannot connect to an Elasticsearch instance, which you can see by following the logs. Therefore, you will never be able to access this page anyway.
Now we are up and running, let’s perform a quick test to make sure we can post data to Elasticsearch and view it in Kibana. To start, we will again use the cURL tool in the terminal, but this time we will post a simple JSON object to Elasticsearch (again we are using the HTTP port here).
 $ curl -XPOST https://localhost:9200/test-index/test-type/1 -H "Content-Type: application/json" -d '{"message": "This is a test document"}'
[Output]
{"_index":"test-index","_type":"test-type","_id":"1","_version":1,"result":"created","_shards":{"total":2,"successful":1,"failed":0},"_seq_no":0,"_primary_term":1}
This command will send an HTTP POST request to the Elasticsearch instance to create a new Document with the contents taken from the JSON object. This Document will be added under the “test-index” index and “test-type” type. You can read more about indexes, types, and documents in Elasticsearch here.
To check that this Document has been created inside Elasticsearch, we now need to go into Kibana and create an Index Pattern. Index Patterns allow you to match on one or more indexes inside Elasticsearch to view and analyse the data. Navigate to the following URL:
https://localhost:5601/app/kibana#/management/kibana/index_pattern
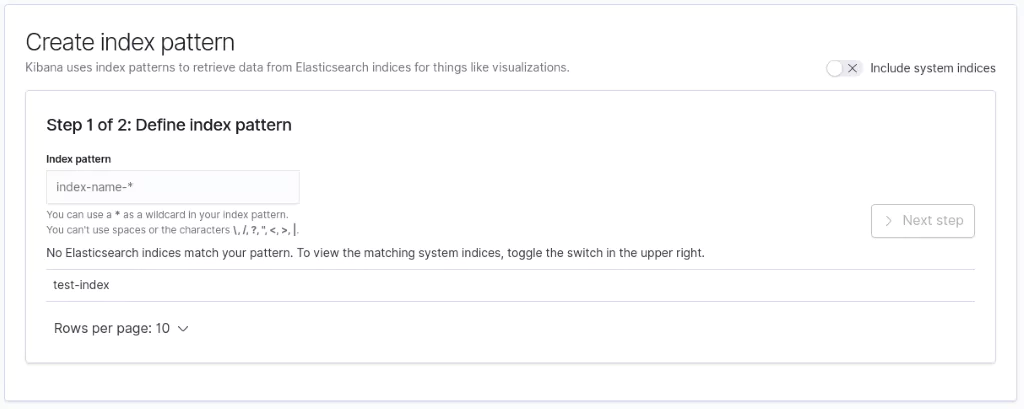
You will be presented with a page containing the above form. You can already see the Elasticsearch index (test-index) we have created noted toward the bottom of the form. To create an Index Pattern for it, simply enter a name that matches the index, or partially matches but also uses a wildcard. For example, all the following will match correctly:
- test-index
- test*
- test-*
- test-index*
Once you have entered a pattern, click on “Next Step” and then “Create index pattern” to create the pattern. After a few moments, you should be presented with the data from the Document we sent to Elasticsearch that will look something like this:
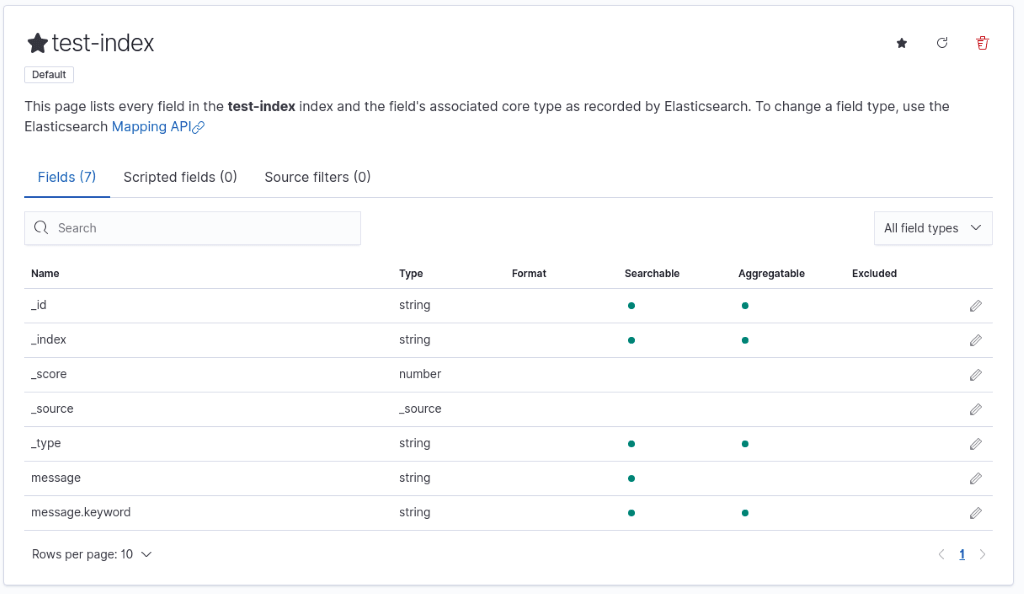
From this point, you could explore Kibana further to look at diverse ways of viewing the data. We won’t cover this here as there is already a plethora of information available to get you started.
Now we have our central log repository setup and working, let’s take it back to our application. To make life easier, there are many third-party libraries that can be used for many languages. Given we are working with a NodeJS application, we will use the latest Elasticsearch JavaScript client to send our log entries directly to Elasticsearch. You could use a more generic logging library, such as Winston, that would allow you to configure a transport to push entries into Elasticsearch. But for our setup, the Elasticsearch client is sufficient.
There are a few changes we need to make to start pushing our log entries to Elasticsearch. First, we need to create a package.json file to allow us to install the third-party library into our application. We can do this quickly using the npm init command on the terminal in the same folder as the app.js file. Then just keep hitting RETURN/ENTER on the keyboard until you get the following output:
 $ npm init
[Output]
This utility will walk you through creating a package.json file.
...
{
"name": "elasticsearch-direct",
"version": "1.0.0",
"description": "",
"main": "index.js",
"scripts": {
"test": "echo "Error: no test specified" && exit 1"
},
"author": "",
"license": "ISC"
}
Is this OK? (yes)
Now that we have enabled the installation of packages, we need to install the Elasticsearch client library for our application to consume.
 $ npm install @elastic/elasticsearch
[Output]
...
+ @elastic/[email protected]
added 10 packages from 8 contributors and audited 10 packages in 1.051s
...
Next, we need to import the client library into our app.js file, configure it to send to our Elasticsearch instance, and change our logEvent method to send our entries directly to Elasticsearch instead of logging out to the console.
 const { Client } = require("@elastic/elasticsearch")
const client = new Client({ node: "https://elasticsearch:9200" })
...
const logEvent = async (eventName, functionName, message) => {
const logMessage = {
timestamp: new Date(),
eventName,
functionName,
message
}
console.log(JSON.stringify(logMessage))
await client.index({
index: "application-logs",
body: logMessage
})
}
...
Here, we have imported the client library and configured the client to point to our Elasticsearch instance via the HTTP port. We have then replaced the use of console.log(JSON.stringify(…)) with client.index(…), which allows us to specify the name of the index (we have used “application-logs”). You may also notice that we have specified the address of our Elasticsearch node instance as “https://elasticsearch:9200” and not “https://localhost:9200”. The reason for this is that Docker containers cannot access localhost on the host as they are run inside of isolated networks. There are several ways around this for what we are trying to achieve. The approach we are going to take is to add our container to the same internal network as our Elasticsearch and Kibana instances were added to. This network was created automatically for us by Docker Compose when we span up the two instances.
Before we spin up the new container and add it to the internal network, we need to update the Dockerfile to include a step for installing the client library as part of the image build, so replace the contents of the Dockerfile with the following:
FROM node:10
WORKDIR /usr/src/app
COPY package*.json ./
RUN npm install
COPY app.js ./
CMD [ "node", "app.js" ]
To get the name of the network, run the following command to see which networks exist:
 $ docker network ls
[Output]
NETWORK ID          NAME                           DRIVER              SCOPE
bbf6c7b1d998       bridge                        bridge              local
c8f3789d7282       elasticsearch-direct_default   bridge              local
6e79cdcc7624       host                           host                 local
901d144957cd       none                           null                 local
The “bridge”, “host” and “none” networks are created by default during the Docker installation. The only other network we have here is “elasticsearch-direct_default”, which is the name of the network created by the Docker Compose step we ran through earlier.
Note: Your network name will be based on the name of the folder containing the docker-compose.yml file. In my case, this folder was named “elasticsearch-direct”, so your network will follow the naming pattern <folder-name>_default.
Finally, we can rebuild our Docker image, remove any existing logger-app containers, and spin up a new container from this updated image within this network. The application will then start emitting our tick/tock messages every 2 seconds directly into our Elasticsearch instance.
 $ docker run --name logger-app --network elasticsearch-direct_default node-log-app
[Output]
{"timestamp":"2020-06-28T17:52:43.342Z","eventName":"APPSTART","functionName":null,"message":"Starting application..."}
{"timestamp":"2020-06-28T17:52:47.353Z","eventName":"TICK","functionName":"tick()","message":"Tick..."}
{"timestamp":"2020-06-28T17:52:49.357Z","eventName":"TOCK","functionName":"tock()","message":"Tock!"}
{"timestamp":"2020-06-28T17:52:51.353Z","eventName":"TICK","functionName":"tick()","message":"Tick..."}
...
{"timestamp":"2020-06-28T17:53:58.204Z","eventName":"APPSTOP","functionName":null,"message":"Application stopped!"}
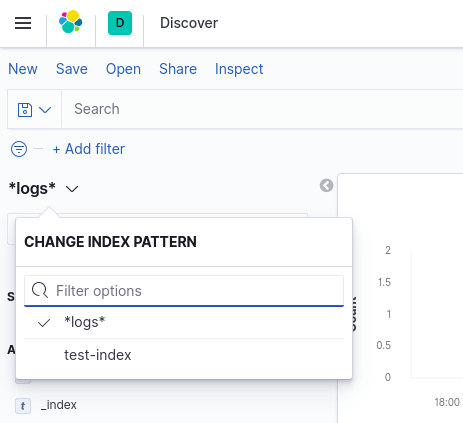
We have run this container while still being attached to it so that we can check it is working as expected: we should be seeing the logs in the console as normal (as we left this line in for visibility purposes). But if we now go back to Kibana and create a new Index Pattern (named something like “*log*”), then we will be able to start seeing logs come through from Elasticsearch. An effective way to check for this is to head over to the discover page in Kibana and select the Index Pattern we have just created.
And that’s it! We now have our application running inside Docker and pushing logs directly into Elasticsearch for us to view and analyze through Kibana. Using this approach, we could have as many applications running across as many servers as we like and have them all push logs directly into a central Elasticsearch instance. In that scenario, we would need to host Elasticsearch somewhere other than on our local machines so that the applications could send the log entries across the internet. We also haven’t had to use the non-blocking delivery mode, so we don’t risk losing any of our log messages. The Elasticsearch JavaScript client sends these messages asynchronously itself.
However, there is one drawback to this setup. Because the logs are now being sent over the wire (if the instance wasn’t running locally), and they are run asynchronously, then we could experience network errors that may result either in having to perform retries or risk losing the messages altogether.
Running a logging agent inside the container
Another approach we could take with logging is to run a separate process inside our application container that takes the log output from the application and sends it through to Elasticsearch. This way, we are reducing the load on the application as it only needs to write the logs to a file, which is a very quick process. The processing of those logs to send them across the wire to an Elasticsearch instance is then done by the second process.
To achieve this, we need to run through a few steps.
First, we are going to move the Elasticsearch part of our application into a new file. In its place, we will use the third-party logging library for NodeJS: Winston. First off, install the Winston library using the command:
 $ npm install winston
[Output]
...
+ [email protected]
added 34 packages from 29 contributors and audited 45 packages in 1.367s
...
Then replace the Elasticsearch setup and logEvent method with the following code in our app.js file:
 const winston = require("winston")
const logger = new winston.createLogger({
format: winston.format.json(),
transports: [
new winston.transports.Console(),
new winston.transports.File({ filename: "/var/log/app/log-file.log" })
]
})
...
const logEvent = (eventName, functionName, message) => {
const logMessage = {
timestamp: new Date(),
eventName,
functionName,
message
}
logger.info(eventName, logMessage)
}
Our application will now configure a Winston logger to write our logs to the console (so that we can see what is going on) as well as to the file named “log-file.log”.
Now we need a second application that will watch the “log-file.log” contents and every time a new entry is added, it will port it across to Elasticsearch. To tail a log file, we will need to install a package called “tail” using the following command:
 $ npm install tail
[Output]
...
+ [email protected]
added 1 package from 3 contributors and audited 45 packages in 0.626s
...
Next, create a second file in the same location called logagent.js and enter the following code:
const { Client } = require("@elastic/elasticsearch")
const client = new Client({ node: "https://elasticsearch:9200" })
const { Tail } = require("tail")
const tail = new Tail("/var/log/app/log-file.log")
tail.on("line", async body => {
console.log(JSON.stringify(body))
await client.index({
index: "application-logs",
body
})
})
This application will listen for new lines being entered into the log file. When an entry is received, it will output it to the console (again so we can see that it is working) and then port it to Elasticsearch directly. Again, we are referencing the Elasticsearch instance via its Docker network alias, as we will still be running our container within the same internal network.
Since this application will be running as a second process within the same container as our first application, it will have access to the same file system. As such, the log file that it is tailing will be the same as the one being written to by our first application. Docker ordinarily only supports running a single process within a container, and that is the recommended approach. So, for us to be able to run these processes in parallel, we will need a wrapper script that we can run as the entry point to our container.
Create a new file called start.sh and enter the following contents:
 #!/bin/bash
node app.js & node logagent.js
This script uses the & operator, which will push the first process to the background to allow the second process to be run.
Now, to get this running, we need to change our Dockerfile.
FROM node:10
WORKDIR /usr/src/app
COPY package*.json ./
RUN npm install
COPY app.js ./
COPY logagent.js ./
COPY start.sh ./
# Make the script executable and ensure the log file exists
RUN chmod +x ./start.sh
RUN mkdir /var/log/app/
RUN touch /var/log/app/log-file.log
CMD [ "./start.sh" ]
We now have all the components we need, so the last step is to build the image, run a new container, and check Kibana for our logs coming through.
 $ docker run -d --name logger-app
--network elasticsearch-direct_default node-log-app
[Output]
bda625c96b940b1c9d69d137c2954ce7258d72c2afb378939a469a7b1bc8aadb
Finally, follow the container logs to check we are getting some information logged to the console and then check Kibana for the endpoint.
 $ docker logs -f logger-app
[Output]
{"timestamp":"2020-06-29T13:05:24.960Z","eventName":"APPSTART","functionName":null,"message":"APPSTART Starting application...","level":"info"}
"{"timestamp":"2020-06-29T13:05:24.960Z","eventName":"APPSTART","functionName":null,"message":"APPSTART Starting application...","level":"info"}"
{"timestamp":"2020-06-29T13:05:28.964Z","eventName":"TICK","functionName":"tick()","message":"TICK Tick...","level":"info"}
"{"timestamp":"2020-06-29T13:05:28.964Z","eventName":"TICK","functionName":"tick()","message":"TICK Tick...","level":"info"}"
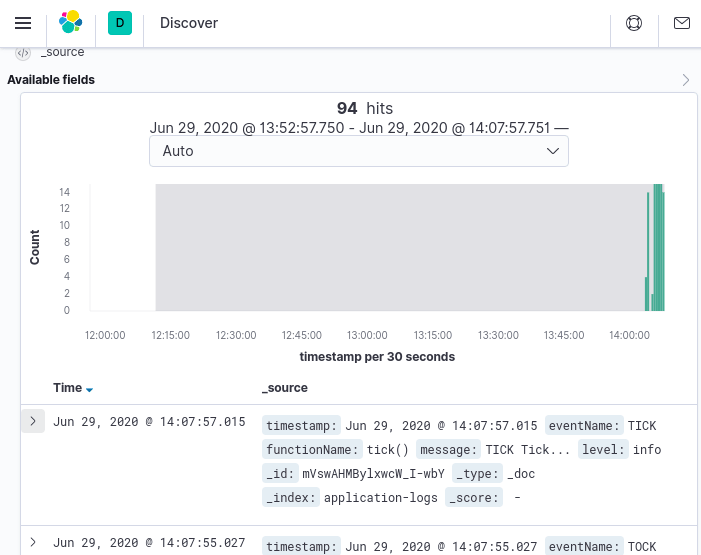
While this method takes some of the strain off our application, it still puts a heavy burden on the container itself. Docker recommends only running a single process per container for a reason, otherwise, the memory and CPU usage for each container increases unnecessarily. We also run the risk of the container failing or being removed and the internal log file could be lost, as well as the fact we won’t receive a log to say the container has stopped; we just won’t get any more logs. This also isn’t a very reusable solution, as we would need to set up this form of log agent for each containerized application for which we wanted to track logs. Using this approach also doesn’t work well with Docker, as Docker is unable to gracefully shutdown the internal applications when trying to stop the container.
Using a Sidecar logging container to collect the logs
In the earlier section, we looked at running a separate process within our application container to act as a log agent and forward all log entries to Elasticsearch. While this is a solution to earlier problems we have discussed, it comes with its own myriad of issues, stemming from it running inside of the same container as our application. As such, we will now look at a different approach that aims to solve this problem: the Sidecar container.
I won’t go into too much detail about the Sidecar architectural pattern, but from a high level, it will involve running a second container alongside our application container. For our Sidecar container, we will use a log aggregator and routing agent called Fluentd docker. Fluentd can be run in its own container, is lightweight, and very quick to setup. It supports a collection of plugins that allow us to configure different rules for collecting logs and routing them through filters to log repositories.
Using this approach, we have two different paths we can take:
- Both containers share a Docker volume. The application writes logs into this location, while the Fluentd container tails this log file and forwards all log entries to Elasticsearch.
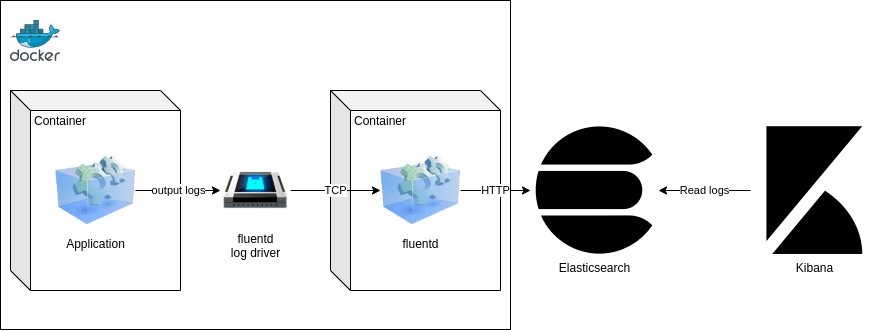
- The application container uses the Fluentd log driver. All log entries are written to the console and therefore passed to the Fluentd process running in the Sidecar container. The Fluentd process then forwards all log entries through to our Elasticsearch instance.
For this example, we will take the latter approach. The benefit here is that it separates the two processes we looked at in the earlier section into their own containers, which is the recommended approach when working with Docker. Also, by using the Fluentd log driver, we aren’t writing any log entries to disk and therefore don’t have to worry about disk space issues or log rotation.
Let’s run through a few steps to get set up with this approach.
First, we need to remove the second application from our Dockerfile, so replace the file contents with this:
 FROM node:10
WORKDIR /usr/src/app
COPY package*.json ./
RUN npm install
COPY app.js ./
CMD [ "node", "app.js" ]
The simplest way of us spinning up a Sidecar container is to change our Docker Compose file. This will allow us to reference both the Dockerfile to spin up our application container, as well as spin up a separate logging container, and manage them all through a single command. So, update the existing Docker Compose file to include the new following highlighted changes:
version: "3.0"
services:
elasticsearch:
image: elasticsearch:7.8.0
ports:
- "9200:9200"
- "9300:9300"
environment:
- discovery.type=single-node
kibana:
image: kibana:7.8.0
links:
- elasticsearch
ports:
- "5601:5601"
app:
build: .
links:
- fluentd
logging:
driver: "fluentd"
options:
fluentd-address: localhost:24224
fluentd:
build: ./fluentd
ports:
- "24224:24224"
- "24224:24224/udp"
volumes:
- ./fluentd/conf:/fluentd/etc
links:
- elasticsearch
Since we are using the same Docker Compose file to spin up our Elasticsearch and Kibana instances, as well as our Fluentd log agent and application, we can reference everything via localhost as all of the containers will be running within the same internal Docker network and thus will have visibility of one another as if they were running on our local machine outside of Docker.
You may notice that our Fluentd container is configured to build from the local folder named Fluentd, which we have not created yet. This folder will have both a custom Dockerfile, as well as another folder containing the Fluentd configuration file. Let’s create them both now.
./fluentd/Dockerfile
FROM fluent/fluentd:v1.11.0-debian-1.0
USER root
RUN gem install fluent-plugin-elasticsearch -v 4.0.9
USER fluent
./fluentd/conf/fluent.conf
<source>
@type forward
port 24224
bind 0.0.0.0
</source>
<match *.**>
@type copy
<store>
@type elasticsearch
host elasticsearch
port 9200
logstash_format true
logstash_prefix fluentd
logstash_dateformat %Y%m%d
include_tag_key true
type_name access_log
tag_key @log_name
flush_interval 1s
</store>
<store>
@type stdout
</store>
</match>
Briefly, this configuration file will receive Docker log files on port 24224 (direct from the Docker log driver in our application container). All entries are then matched (using the wildcard pattern) and sent both to Elasticsearch (via HTTP on port 9200) and the standard output stream (so we can see the output as it arrives in Fluentd).
Once you have added these files, your file structure should look like this:
├── app.js
├── docker-compose.yml
├── Dockerfile
├── fluentd
│   ├── conf
│   │   └── fluent.conf
│   └── Dockerfile
├── package.json
└── package-lock.json
2 directories, 7 files
Finally, we need to remove the file transport from our Winston logger in our application. This isn’t necessarily important, but it just means that we no longer need to worry about a file being written to disk and taking up space. Remove the following line from app.js:
new winston.transports.File({ filename: “log-file.log” })
That’s it! Now spin up the containers using the following command:
$ docker-compose up
This will take a little while. If you prefer, you can use the –d option to detach from the process and then follow the logs for the Kibana instance until you see that it is now listening on port 5601. That way you know everything should be up and running and you can then browse to https://localhost:5601 to view the logs coming through. Again, go to the Index Patterns and create one for fluentd-*, then go back to the Discover page and you should be able to see all the logs coming from the application, routed through Fluentd.
This is a great way to mitigate some of the issues we have seen so far. However, it is not without its own drawbacks. Most notably, this approach requires a Sidecar container to be spun up for each other container you want to receive logs from. Under a larger architecture of microservices, this would effectively double the number of containers you are running and managing.
Running a logging agent on the host machine(s)
As we discussed in the last approach, the biggest drawback of the Sidecar pattern was that we would need a Sidecar container for every container from which we wanted to collect logs. To tackle this, the final approach we are going to look at is to use a single Docker log agent running on the host machine. This drastically reduces the number of log collection containers you would need, as you would only need one per machine.
Having just a single log collection agent also means that all logs can be viewed by the one process, therefore simplifying the configuration process. Using something like Fluentd, we would have a rule to collect all logs and another to forward to Elasticsearch. We could optionally also include filters to apply different rules and tags to the log data as it comes through. This approach also means we reduce the configuration and maintenance to an individual location per machine.
Update the Docker Compose file to have the following contents. Note that we have reverted the “app” service to use the default json-file log driver and we have also mapped the log path for the containers to the “fluentd” service.
version: "3.0"
services:
elasticsearch:
image: elasticsearch:7.8.0
ports:
- "9200:9200"
- "9300:9300"
environment:
- discovery.type=single-node
kibana:
image: kibana:7.8.0
links:
- elasticsearch
ports:
- "5601:5601"
app:
build: .
fluentd:
build: ./fluentd
ports:
- "24224:24224"
- "24224:24224/udp"
volumes:
- ./fluentd/conf:/fluentd/etc
- /var/lib/docker/containers:/fluentd/log/containers
links:
- elasticsearch
logging:
driver: "local"
Note: We have specified that the “fluentd” service use the local log driver. This will mean it does not output its own logs to a log file. The reason for this is that otherwise, it will pick up its own log files in a circular dependency fashion.
Make sure you double-check the location of your logs. Remember, you can do this by inspecting an existing container and looking for its Log Path.
Next, we need to replace the source within the fluentd configuration file. Currently, it forwards all log entries it receives in the 24224 port. Instead, we want to tail any log file contained within the Docker log directory. So, update the fluent.conf file to have the following:
 <source>
@type tail
read_from_head true
path /fluentd/log/containers/*/*-json.log
pos_file /tmp/container-logs.pos
tag docker.*
<parse>
@type json
</parse>
</source>
...
Finally, spin up the containers using docker-compose up and after a short wait for all containers to be fully initialized, you should start seeing the container logs appear in Kibana. If you experience some issues, check through the following tips:
- If you get permission issues, try removing the USER fluent line from the fluent/Dockerfile. This will allow Fluentd to run under the root user. This isn’t necessarily recommended for production, but for the purpose of this tutorial, it is sufficient.
- If you have further problems with Docker logs not coming through, try to run docker-compose build to ensure that the images are up to date. Additionally, you can try removing all containers and images from Docker to make sure you have no cached layers.
While this is another potential solution and solves the problem of having multiple sidecar containers, it does mean that this single process could act as a bottleneck or single point of failure. If this container itself incurs an error, then the collection of the host log files could all stop. There are ways to mitigate this, but they are outside the scope of this article for now.
Debugging the Docker Daemon
So far, we have covered collecting and analyzing Docker log output from Docker containers. However, what do we do if the container fails, or there is an issue with the Docker system itself, or we just cannot see any useful information in the container logs? The last part to cover that will help us here is looking at logs that Docker itself produces. These logs are output from the Docker Daemon: the process that runs the core of Docker as we know it.
Depending on the operating system you are using, these logs may be stored in different locations or viewed using different methods. For the official list, refer to the official Docker documentation. Since this article is written for Mac OS X users, we are running our samples assuming that system.
In some cases, on Mac OS X, the log file does not exist where the documentation suggests: ~/Library/Containers/com.docker.docker/Data/vms/0/docker.log. In this scenario, the following command may help to extract these logs:
$ pred=’process matches “.*(ocker|vpnkit).*”
|| (process in {“taskgated-helper”, “launchservicesd”,
“kernel”} && eventMessage containers[c] “docker”)’
$ /usr/bin/log stream --style syslog --level=debug
--color=always --predicate “$pred”
For more information around this approach, read this documentation on the Docker website.
Before we wrap up, let’s run a few commands through Docker to see what logs we get. Start by running something simple like docker info or docker ps. If you look at the logs now, you should see something that looks like this:
$ docker info
[Output]
proxy >> HEAD /_ping
proxy << HEAD /_ping (1.922484ms)
proxy >> GET /v1.40/info
proxy << GET /v1.40/info (15.333159ms)
Note: I have omitted the timestamp and extra information preceding each line for brevity.
You can see the calls to the Docker Remote API have been logged. Both the request and response (including response time), as well as the API endpoint can be seen here. Now run another test by spinning up a new container.
$ docker run alpine sh –c “echo Hello, World!”
[Output]
proxy >> HEAD /_ping
proxy << HEAD /_ping (1.739898ms)
proxy >> POST /v1.40/containers/create
HTTPHandler: Received request: POST /usage
...
This is a useful place to go when you are experiencing issues with the Docker system, images not building properly, containers not starting for no obvious reason, and so on. These logs should supply some additional insights into what the system is doing around the times concerned.
Conclusion
In this article, we have covered a lot of different angles relating to logging in Docker. We started by looking at what Docker has to offer when it comes to logging, out of the box, which introduced us to the remote API and log files written to disk. We also looked at a few more advanced approaches to taking logging to another level to solve a range of issues you may experience. Namely, we looked at making log entries more useful by outputting structured event logs from our application and then collecting these entries within a central log repository, such as Elasticsearch. From there, we briefly looked at the benefits of this when it came to analyzing the log entries using a system such as Kibana. Finally, we have taken a quick look at the logs output by the Docker system itself and when this may be useful.
We haven’t covered everything that can be achieved here, but this should serve as a good foundation for you to have an understanding of some of the options available when it comes to working with Docker and logs. Now that you have a better understanding of what is possible, you can make your own judgment as to the right path for your own situations.