Supercharge your Android app
In today’s technological landscape, mobile applications are on the rise, boosting efficiency, portability and accessibility in daily life, across a spectrum of industries, from financial services to food delivery. As mobile apps become more essential, the quality of their features, performance, and user experience is critical.
Why observability for mobile applications?
There are numerous challenges, but we’ll focus on the three most important:
- Monitoring in production: Simulators and QA environments miss real-world network latency, device fragmentation, and unpredictable user behavior.
- Fast fixes: Without RUM, hidden bugs can hurt your app’s rating. Observability helps you get ahead of negative reviews.
- User-focused view: Having the app up and running is not enough—you need to know how it performs for every user in every city or country.
Modern mobile applications produce a wealth of observability data, but the challenge is consolidating it into one tool to get a complete picture of performance and the digital user experience—especially when data is siloed within teams. Imagine the insights when all that data comes together. With Coralogix, you can unify your observability data and get a holistic view of application performance.
In this blog, we’ll explore ways to monitor your mobile application effectively using Coralogix Mobile Monitoring. Android alone currently holds a staggering 71.42% market share, so our focus here will be on Coralogix mobile monitoring capabilities for Android.
How to get started
Pre-requisites: Supported platforms and features
- Supported Android version: Android 7.0+ (API level 24 and above).
- Features: The SDK captures errors (including ANRs), intercepts network calls, sends log messages with custom severity, reports errors, and tracks page transitions in your app. Coralogix Android SDK Overview
Analyze your Android applications, get insights, in under 10 minutes.
Step 1:
Add the SDK to your build.gradle dependencies and sync your project:
dependencies {
		implementation 'com.coralogix:android-sdk:2.2.x'
}
Make sure you also enable Java 8 features, which are required. You can follow troubleshooting for further steps if you encounter issues.
Step 2:
Initialize your SDK early in your application lifecycle – typically in your Application class:
import com.coralogix.android.sdk.CoralogixRum
import com.coralogix.android.sdk.model.CoralogixDomain
import com.coralogix.android.sdk.model.CoralogixOptions

private val coralogixOptions = CoralogixOptions(
    applicationName = "YourAppName",
    coralogixDomain = CoralogixDomain.<Region>,
    publicKey = "RUM_API_KEY",
    version = "AppVersion"

    instrumentations = mapOf(
        Instrumentation.Error to true,
        Instrumentation.Network to true,
        Instrumentation.Custom to true,
        Instrumentation.MobileVitals to true,
        Instrumentation.Anr to true,
        Instrumentation.Lifecycle to true,
        Instrumentation.UserInteraction to true
    ),

class DemoApplication : Application() {
    override fun onCreate() {
        super.onCreate()
       CoralogixRum.initialize(this, config)
    }

}Note: The instrumentations property is optional; set booleans to turn specific instrumentation on or off. Default is true.
Done! Your application is instrumented to send the data to Coralogix.
What can you monitor?
Once the SDK is running, you will be able to see the telemetry data automatically, which includes:
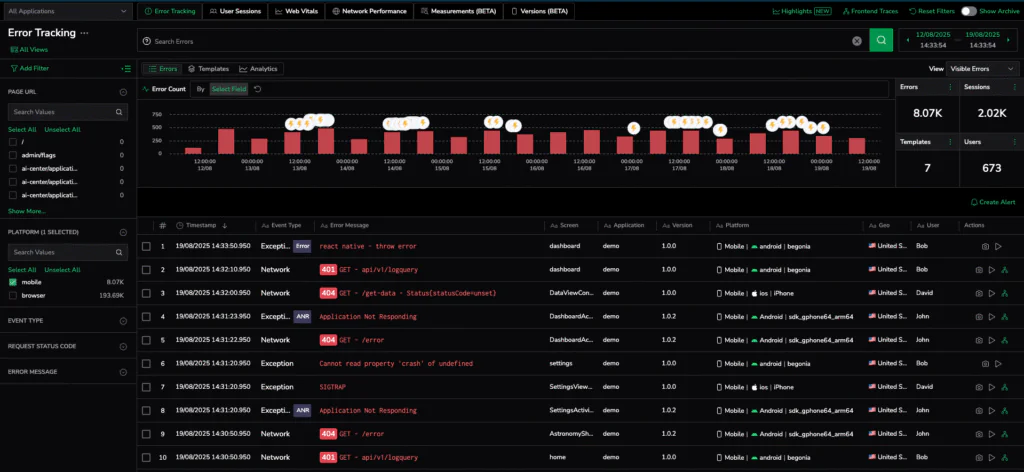
Error Tracking
This combines related errors or events into a single “error tracking” entry in order to effectively identify and prioritize issues. Multiple issues are automatically combined into a single error template if they have the same fingerprint. Because each template contains comprehensive contextual information, it is simpler to review and fix issues throughout the whole tech stack.
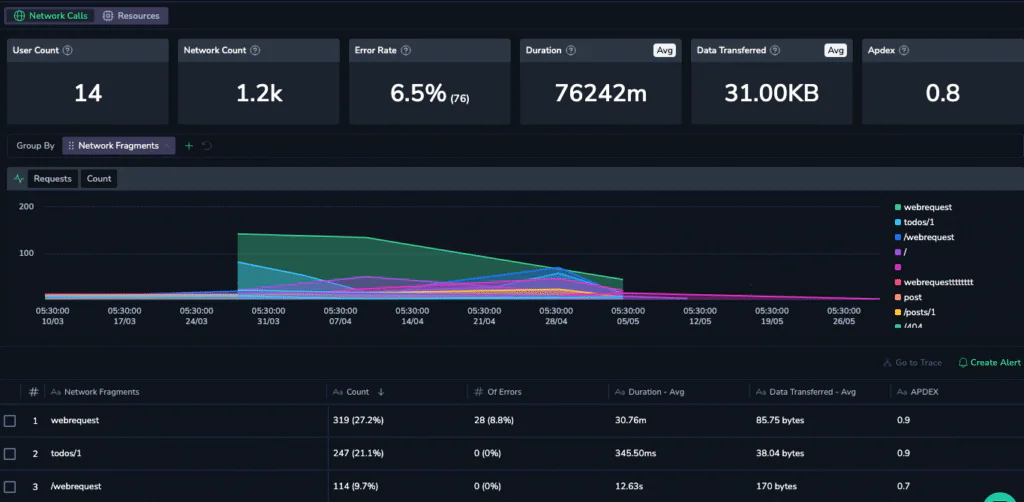
Network Performance
This provides real-time information on network call performance as perceived by users and tracks real user interactions with your application. It makes it more straightforward for developers to identify and fix concerns regarding network performance.
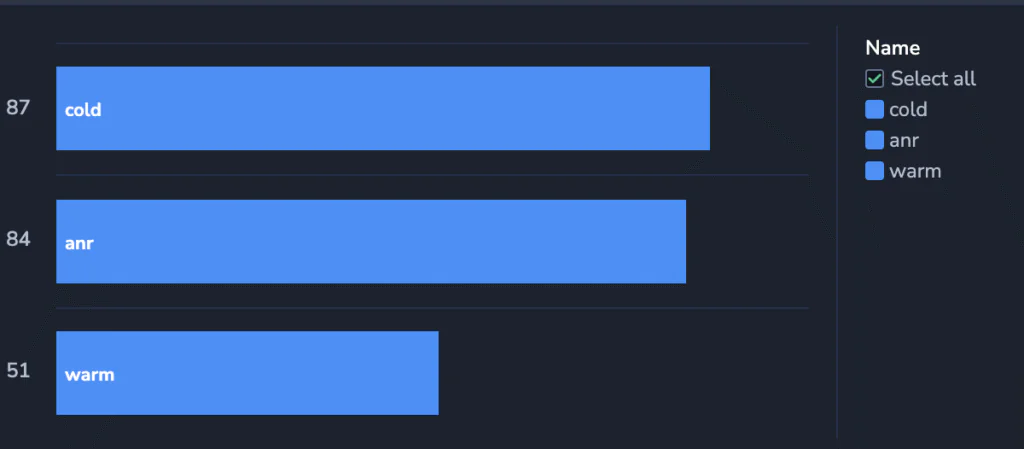
Mobile Vitals
Automatically tracks how fast your application launches, both from a completely fresh state and from a partially active state (cold/warm start times), and how smoothly its visuals appear to the user (frame rates).
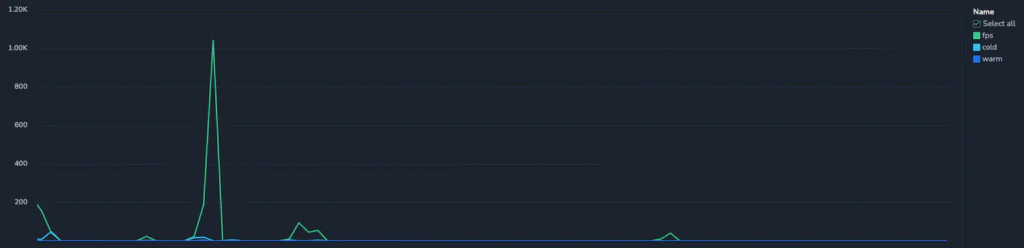
Cold Start: When the app launches from a completely stopped state — not running in memory.
Hot Start: When the app resumes while still active in memory, making startup faster.
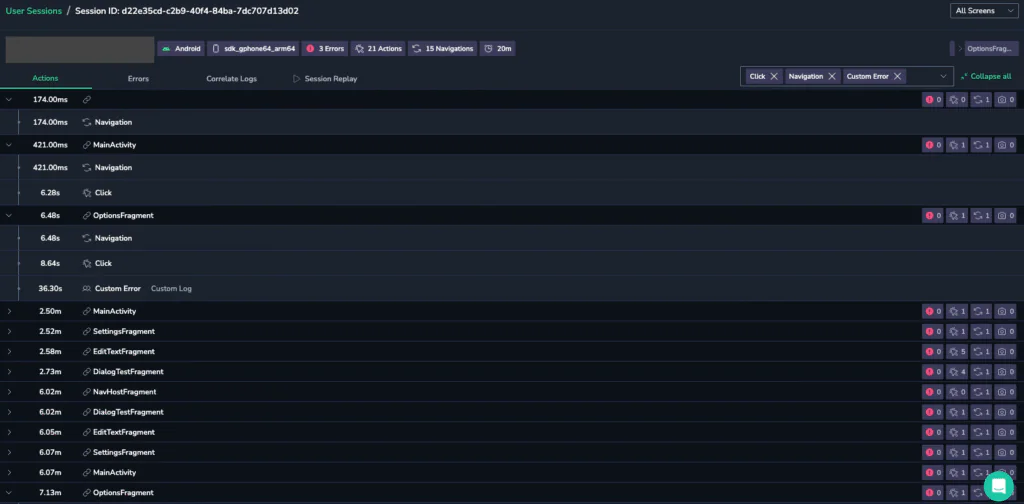
User Session and Interactions
A user session defines the period of continuous engagement; it begins when a user opens an app and typically ends when they close it, or after a period of inactivity (session timeout). It also helps identify unique users and sessions, as well as the unique pages a user has visited.

User interactions specifically define the actions users take within those sessions. This is the granular detail of user behavior, such as navigation paths, taps and swipes, clicks, and inputs.
Distributed Tracing
Adding traceParentInHeader lets you follow a user’s request as it jumps between different parts of your service. Think of it like a digital breadcrumb trail. You can see exactly how each component communicates with the others and pinpoint where things might be slowing down or encountering errors.
This gives you a complete, start-to-finish view of what a user is doing. It makes it much simpler to spot slowdowns, network issues, or errors that legacy monitoring methods might completely miss.

Geo Distributions
The geographic distribution report helps you identify where your application’s users are coming from—whether by country, business region, or broader geographic area. It enables you to assess performance and usage trends across different regions.


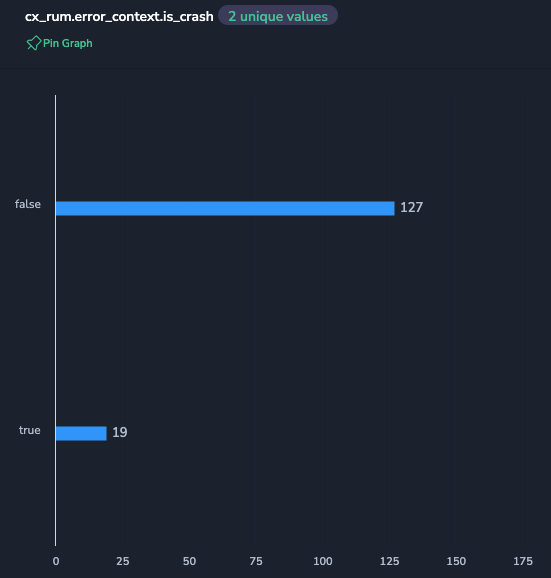
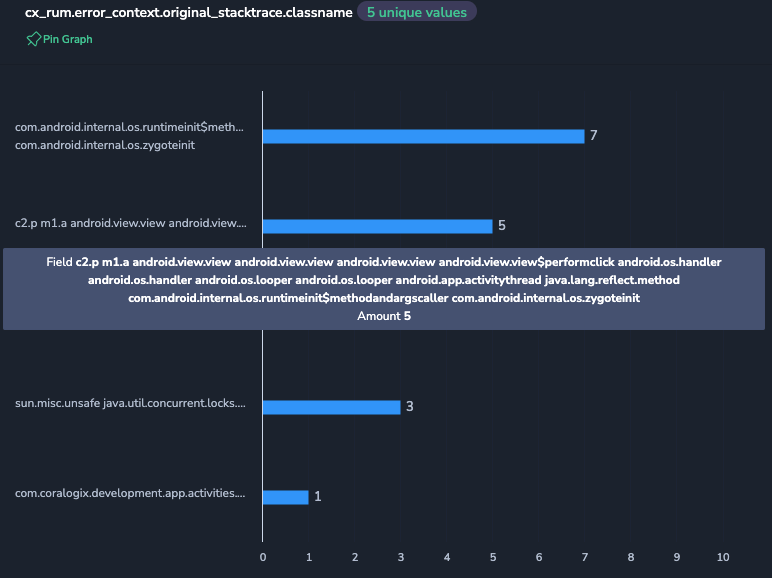
Crashes
It is common for mobile applications to crash. Instrumenting the mobile application with Coralogix helps you identify high-crash rates and find the functions or methods that are causing issues. It will provide you with a quick distribution of how many crashes occurred and their causes.
ANR Detections
One essential metric to gauge your application’s performance is understanding exactly when and where users are facing delayed UI or ANR (application not responding) errors.
Conclusion
With the Coralogix Android SDK, achieving end-to-end observability for your Android apps takes just minutes. The insights you gain empower you to monitor performance, understand dependencies, and proactively address issues. You also unlock Coralogix’s full APM capabilities, along with custom instrumentation and dashboards, for a truly tailored monitoring experience.