Uptime Monitoring with Heartbeat


Whenever you build a service and expose a set of endpoints to provide API access to that service, you’ll likely need to track their availability and response times, aside from ensuring their functionality. But to actually know that “something is down” or just “not performing” you need to consistently monitor your services day in day out and that’s how Heartbeat from the Elastic Beat family helps you with Uptime Monitoring.
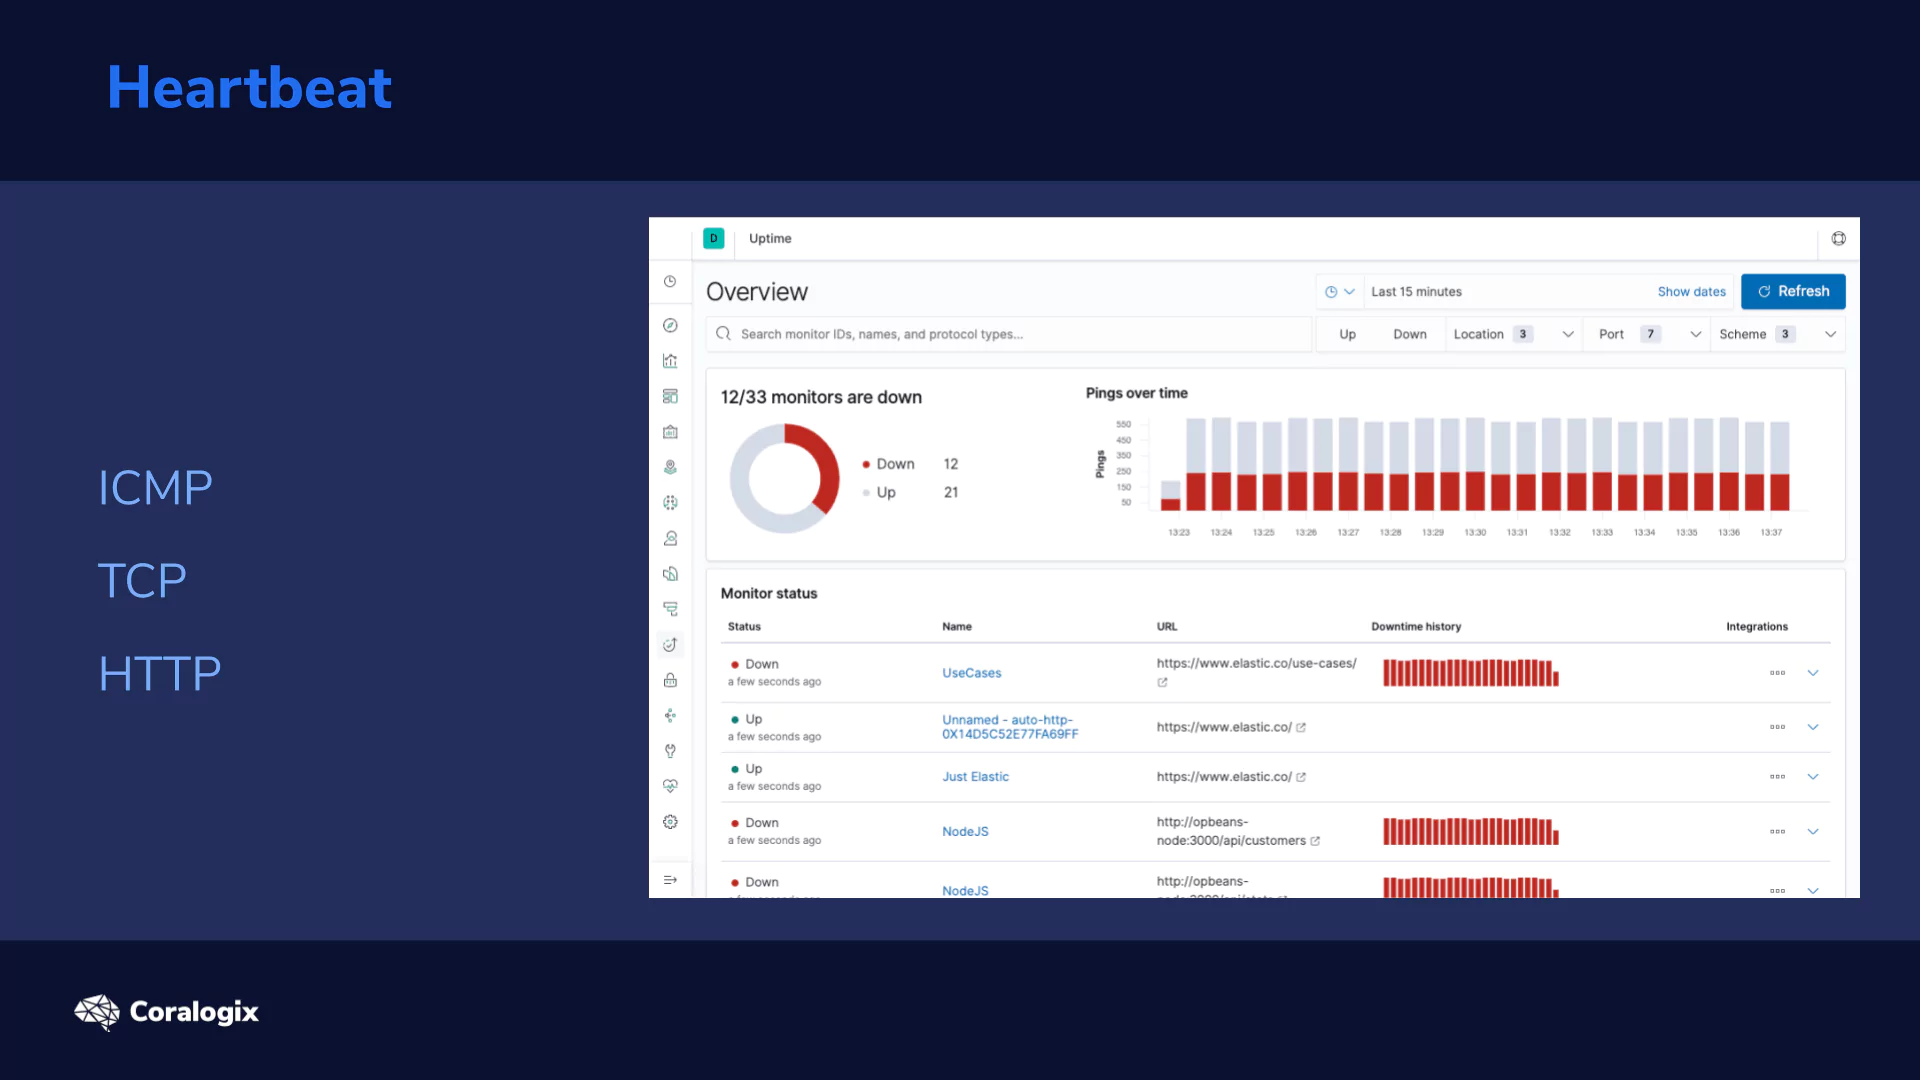
Heartbeat helps you monitor your service availability. It works by defining Monitors that check your host to ensure they’re alive.
When discussing Monitors, there are three main monitor types to consider. Each one refers to the underlying protocols that’s utilized for the monitor. Each of these protocols operate at a different network level and thus each has varying options of what it can check.
So let’s go one by one and explore them in more detail:
- ICMP
-
- ICMP (sometimes referred to as ping) is the lowest level protocol of the three and works by firing “raw” IP packets (echo requests) to the end host/ip address. It operates mostly at the layer 3 Network of the standardized OSI Model.
- If successful you basically know that the network device you were contacting is powered and alive, but not much else.
- We won’t focus this lesson on ICMP because it’s more for network level monitoring. Nevertheless, all of the principles outlined here are equally applicable.
- TCP
-
- With TCP we are directing our monitoring requests not just to the host, but also to a specific service by defining a port on which it should be reachable. TCP operates at the OSI layer 5 (Transport) and powers most of the internet traffic.
- This monitor works by creating a TCP connection (either unencrypted or encrypted) on the host:port endpoint and if “something” listens to the socket it considers the check to be successful.
- HTTP
- The HTTP monitor uses the highest level protocol of the three which operates at the OSI layer 7 (Application). It is based on a request-response communication model.
- By default, the monitor validates the ability to make an HTTP connection which basically means if it receives any status code that is not negative after a request. But it doesn’t end there. It offers a wide range of options to define the monitoring logic. For example, we can inspect a returned JSON for a specific value etc.).
Now that we know the toolkit at our disposal, let’s dive deeper and see it in action!
Hands-on Exercises
Installing Heartbeat
First we need to start with the installation of Heartbeat. It is a very similar process to the installation of Elasticsearch, but let’s reiterate the main steps here.
We’ll use the APT repositories to do this, so we need to install and add the public signing key. This command should result in an OK confirmation:
wget -qO - https://artifacts.elastic.co/GPG-KEY-elasticsearch | sudo apt-key add -
Next install apt-transport-https so that we can use https exposed repositories:
sudo apt-get install apt-transport-https
And now let’s add the Elasticsearch apt repository to our list of available repositories:
echo "deb https://artifacts.elastic.co/packages/oss-7.x/apt stable main" | sudo tee -a /etc/apt/sources.list.d/elastic-7.x.list
Finally you can install Heartbeat with apt-get in a desired version:
sudo apt-get update && sudo apt-get install heartbeat-elastic=7.5.2
As an option, you can set the Heartbeat to start with the boot of the system like this:
sudo systemctl enable heartbeat-elastic
Configuring Heartbeat
Now that we have the prerequisites covered we should review the main configuration file for Heartbeat:
sudo vim /etc/heartbeat/heartbeat.yml
Here you’ll find a ton of options, but don’t worry we’ll manage to get by leaving most of them on their defaults. First and foremost, let’s define Heartbeat’s output which is the Elasticsearch host. Here we are ok with the default as we are running on localhost:9200
#-------------------------- Elasticsearch output ------------------------------
output.elasticsearch:
 # Array of hosts to connect to.
 hosts: ["localhost:9200"]
Pro Tip: In production setups you’ll likely need to pay attention to the SSL and authentication sections.
The second part is the path to the Monitors directory. Although you can define your Monitors straight in the heartbeat.yml file it’s not a very good idea as it can get messy. So it is better to have them separated in a defined directory where every yaml file (*.yml) will get picked up.
For the configuration we’ll just enable Monitor reloading by setting it to true.
############################# Heartbeat ######################################
# Define a directory to load monitor definitions from. Definitions take the form
# of individual yaml files.
heartbeat.config.monitors:
 # Directory + glob pattern to search for configuration files
 path: ${path.config}/monitors.d/*.yml
 # If enabled, heartbeat will periodically check the config.monitors path for changes
 reload.enabled: true
 # How often to check for changes
 reload.period: 5s
Great! Now all potential changes will automatically be reloaded every 5 seconds without the need to restart Heartbeat.
Lastly to have our config file clean. Comment out everything under the field heartbeat.monitors. We will define our monitors separately.
#heartbeat.monitors:
#- type: http
 #urls: ["https://localhost:9200"]
 #schedule: '@every 10s'
We can now start up our Heartbeat instance like this:
sudo systemctl start heartbeat-elastic.service
If you want to watch the logs of Heartbeat to be sure everything went smoothly, you can do so with journalctl utility (if you are running Heartbeat in systemd).
sudo journalctl -u heartbeat-elastic.service -f
Everything should be ready to define our first Monitor!
Anatomy of a Monitor
Let’s start easy and create a simple Monitor of the TCP type.
For the lack of a better shared option in our local environment, we’ll perform our tests against the Elastic stack running in our vm.
We will start by changing our monitors.d directory and creating a new yml file like this:
cd /etc/heartbeat/monitors.d/
sudo vim lecture-monitors.yml
Let’s define a very basic TCP monitor:
- id: elasticstack-tcp-monitor
  type: tcp
  hosts: ["localhost"]
  ports: [9200, 5601]
  schedule: '@every 10s'
The key parts are:
- id – this is a unique id of the monitor (within the heartbeat instance)
- optionally you can also give it a name for a more human-readable description
- type – we need to define a type of the monitor (icmp, tcp, http)
- hosts, ports – we can pass in an array of items that will later be combined into pairs
- we will be checking connectivity with TCP of our instances of Elasticsearch and Kibana running on default ports on localhost
- schedule – Finally, we’ll define how often to perform monitoring
- we can either use this logical notation with @every keyword
- or we can use a cron expression (*/10 * * * * * * being equivalent to the above example)
And that’s it, we have our first Heartbeat monitor!
Now save your yaml file and just wait a while 🙂
:wq
Then if you request the list of your indices…
curl localhost:9200/_cat/indices/heartbeat*?v
… you should see a new heartbeat index and that it already has some documents.

We can quickly review them with the following query.
curl --silent localhost:9200/heartbeat-7.5.2/_search | jq -c '.hits.hits[]._source | [ .url.full, .monitor.status ]'
With the jq utility, we are just unpacking two fields from the search query the url.full field (for the host:port combination) and monitor.status.
As you can see both Elasticsearch and Kibana seem to be up, or in other words they can be connected to:

Playing with HTTP Responses
Now we can test out the HTTP monitor, which will likely be the one used with your set of HTTP/REST services. Generally you need to define what it means for your specific service to be “alive and well” in order to design the Monitor properly.
It may be a specific status code or JSON response with specific contents, or all of these conditions combined.
To try this let’s define a Monitor that will watch the _cluster/health endpoint of our Elasticsearch cluster. It is a good example of a “status” endpoint.
- id: elasticsearch-cluster-health
  type: http
  urls: ["https://localhost:9200/_cluster/health"]
  schedule: '@every 10s'
  check.request:
    method: GET
  check.response:
    status: 200
    json:
      - description: check status
        condition:
          equals:
            status: green
You can see that it is fairly similar to our TCP one we did earlier, but besides the different type, it also adds some extra parameters:
-
- urls – as we are on the HTTP protocol we need to specify one or more HTTP endpoints in the form of a url
- check – this is the fun part where we can specify the request properties and expected respone
- request – to be clear, we specified the GET method here, but it’s actually the default as well. Optionally, you can specify various request headers.
- response – here we define the logic of the response parsing and expected results.
- we are checking specifically for the HTTP status 200 (otherwise any non 4xx/5xx would be acceptable) and we expect a json string in the response where the field status complies with the condition of being green.
You can combine multiple conditions with or, and, not and you can perform various checks such as equals, contains, regexp, etc.
Let’s save the yaml file, and wait a bit.
:wq
Afterwards, you can check the monitoring data points. For example, the last 30 seconds with the following command:
curl -g --silent localhost:9200/heartbeat-7.5.2/_search?q=@timestamp:["now-30s"+TO+"now"] | jq -c '.hits.hits[]._source | [ .url.full, .monitor.status ]'
Note: it is the same query as before but it adds a time condition. Also, notice the -g flag for curl which allows us to use the square brackets in the query.
This should now yield the results from both of our Monitors. And as you can see our HTTP monitor is informing us that the service is down… you can think why that should be 🙂

Hint: We have some unassigned replicas which you can resolve with by changing the dynamic settings to index.number_of_replicas: 0
curl --request PUT 'https://localhost:9200/date*/_settings'
--header 'Content-Type: application/json'
--data-raw '{
   "index.number_of_replicas" : 0
}'
Kibana
Finally we can also try visualizing the collected data. To save some initial setup work we will use a predefined Heartbeat dashboard that is available as an open source project in this github repo.
You can download the config file with wget:
wget https://raw.githubusercontent.com/elastic/uptime-contrib/master/dashboards/http_dashboard.json
Now let’s go to Management → Kibana / Saved Objects → Import, find the downloaded JSON file and import it.
In the Saved Objects you can see what was created via the configuration file. It is a set of visualizations in a dashboard, and importantly, an index pattern that is an interface for our data in the heartbeat-* indices.
Now go to the Uptime section (in the left menu of Kibana) and pick the Heartbeat HTTP monitoring dashboard.
The out-of-the-box dashboard should look something like this. It shows the distribution of status codes, round-trip times of requests and other related data.
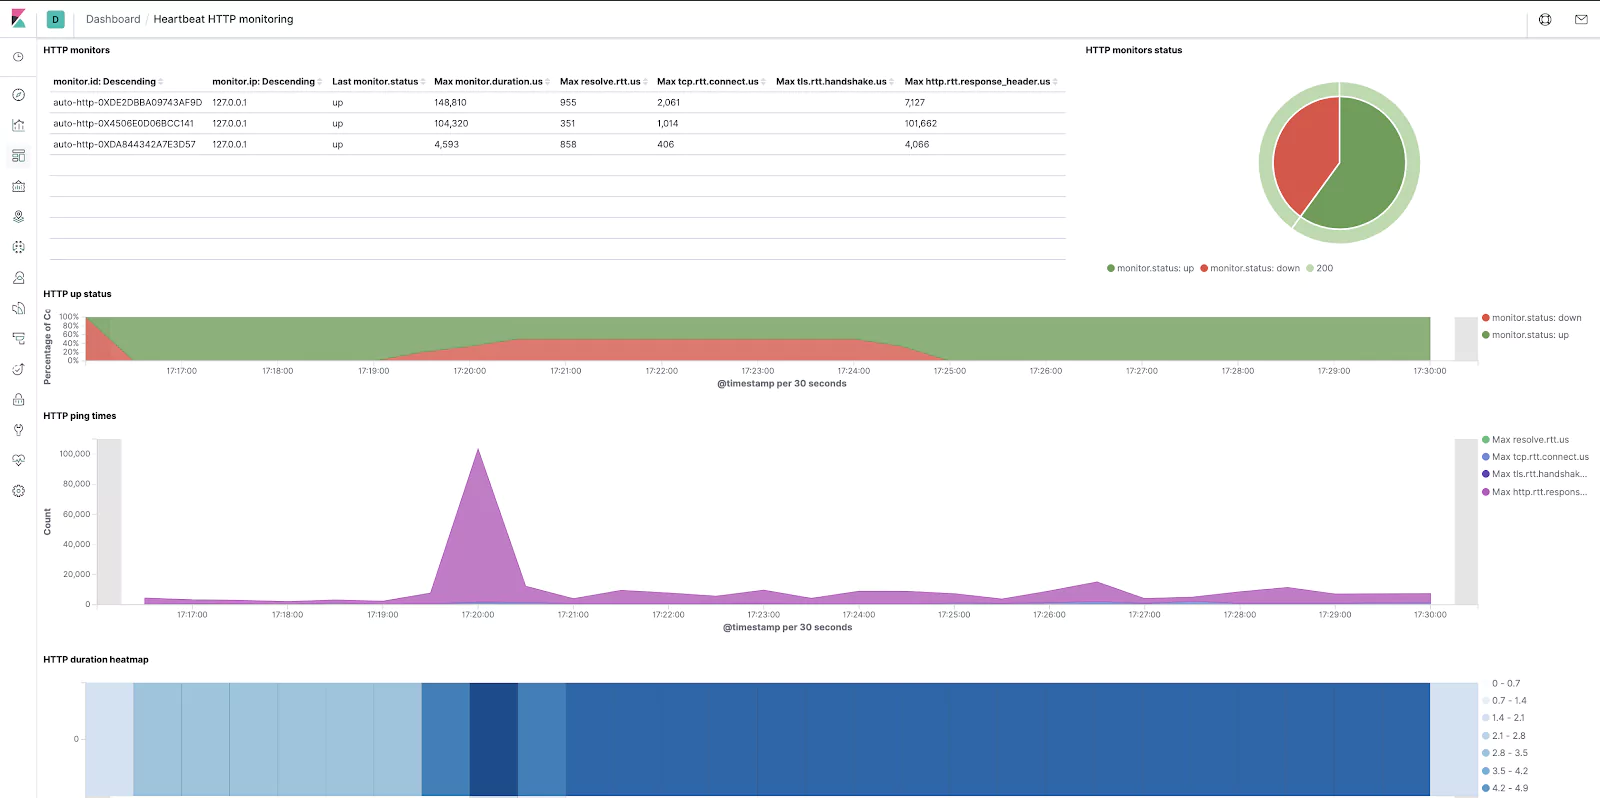
Not bad at all, if you want to dazzle your colleagues after only 5 minutes of work!
If you need to add or tweak the individual visualizations you can do so in the Visualize section. Also remember that in the Discover section you can inspect the raw data points.
Now, as a final step you should stop the Heartbeat instance like this:
sudo systemctl stop heartbeat-elastic.service
… and optionally (if short on space) remove its indices to have your table clean :).
curl --request DELETE 'https://localhost:9200/heartbeat*'
Very good! Now you know how to keep the availability and response times of your services under control and how to quickly visualize the collected data to get valuable insights.
Learn More
-
- definitely go through the configuration options of the monitors (eg SSL parameters may come handy)
- you can review also the conditions that you can define in the HTTP monitors
- reference heartbeat.yml file with all non-deprecated config options