10 Observability Tools to Know in 2024

Observability Tools vs Observability Platforms
Observability tools are often specialized, focusing on narrow aspects like metrics, logs, or traces. They provide deep insights into particular segments of the system but might require integration with other tools to offer a holistic view.
Observability platforms offer an integrated suite of functionalities, combining metrics, logs, traces, and more into a single solution. These platforms provide a unified view, making it easier to correlate data across different sources and achieve observability. By reducing the need for multiple point solutions, platforms can simplify management and improve overall system insights.
Key Features of Observability Platforms and Tools
Observability tools and platforms usually offer the following capabilities.
Metrics Collection and Monitoring
Observability platforms offer tools that gather quantitative data to reflect the system’s performance, such as CPU utilization, memory usage, or request latency. This data helps teams to track resource consumption and detect performance bottlenecks.
Effective monitoring systems provide real-time insights that alert teams to deviation or anomalies. Metrics collection tools can integrate with alerting mechanisms to notify relevant personnel of potential issues immediately.
Log Aggregation and Analysis
These platforms can consolidate logs from various components into a single repository for unified analysis. Logs provide detailed records of system activity, which are crucial for diagnosing and understanding issues when they arise. Aggregation tools normalize and categorize logs, making them easier to search and analyze.
Log analysis involves parsing and contextualizing logs to extract meaningful patterns and correlations. By applying machine learning and analytics, modern log aggregation tools can automatically detect anomalies and provide actionable insights. This capability is useful for reducing mean time to resolution (MTTR) and improving operational efficiency.
Tracing and Distributed Tracing
Tracing, and more specifically distributed tracing, follows requests as they traverse multiple services or components in a system. It helps in visualizing service interactions, identifying latency issues, and understanding the service dependencies that can affect overall application performance.
Distributed tracing is especially critical in microservices architectures where interactions across numerous services can complicate debugging. By providing an end-to-end view of requests, tracing tools highlight performance bottlenecks and failure points across distributed systems, enabling faster troubleshooting.
Alerting and Notifications
Alerts and notifications keep teams informed about critical events and potential issues. Effective alerting mechanisms allow for the configuration of thresholds and conditions that automatically trigger alerts when surpassed. These alerts can be routed to various channels, such as email, SMS, or collaboration tools like Slack.
Timely notifications enable teams to respond quickly to anomalies or failures, minimizing the impact on users and business operations. Alerting systems can also incorporate escalation policies and on-call schedules to ensure the right individuals are notified and can take immediate action.
Visualization and Dashboards
Visualization tools and dashboards provide a graphical representation of collected data, making it easier to interpret and analyze complex information at a glance. These dashboards can display metrics, logs, and traces through various charting and visualization options, offering a view of system health and performance.
Customizable dashboards allow teams to focus on the most relevant data points, enabling quick identification of trends, outliers, or areas requiring attention. Visualizations help in making informed, data-driven decisions and communicating insights to stakeholders.
Notable Observability Platforms and Tools
1. Coralogix

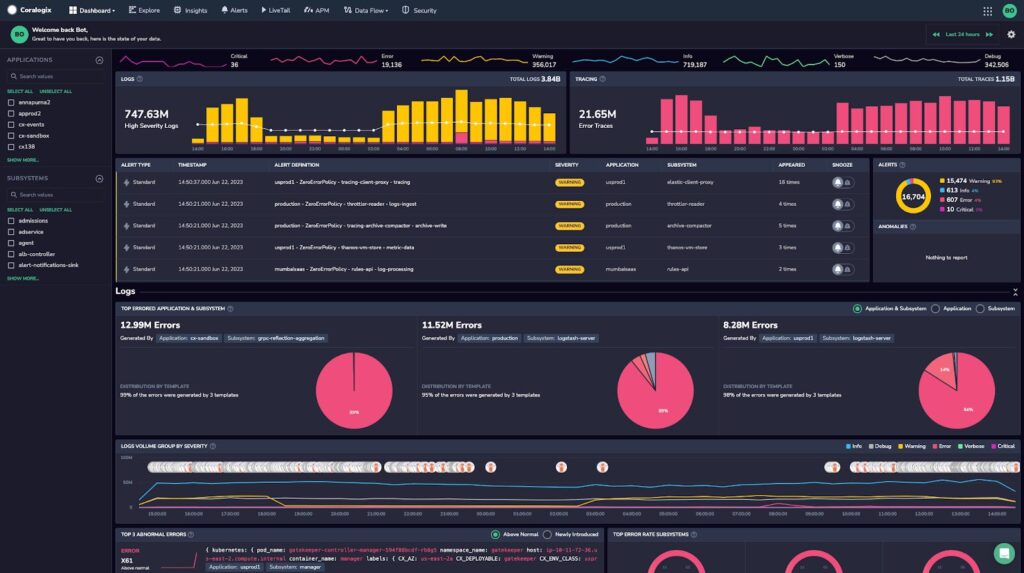
Coralogix is a powerful, unified observability platform that provides full visibility into application performance, infrastructure health, and security threats. With advanced alerting, hundreds of pre-built integrations, and fully customizable dashboards, Coralogix simplifies monitoring across your entire tech stack. Whether you’re focusing on logs, metrics, or traces, Coralogix delivers comprehensive insights to help you manage performance, security, and reliability efficiently.
Key Features of Coralogix:
- APM: Monitor your services, databases, and APIs in real-time. Trace interdependencies and troubleshoot performance issues, all while staying aligned with your SLOs.
- RUM: Track user experiences across web and mobile applications, replay user sessions, and view performance metrics to identify and resolve frontend issues.
- Infrastructure Monitoring: Gain full visibility into your underlying infrastructure with real-time monitoring of metadata, metrics, and system dependencies for optimal performance.
- SIEM: Ensure security with comprehensive log visibility, threat detection, and pre-built integrations, parsing rules, and dashboards, all customizable for your needs.
- Log Analytics: Analyze log data in real-time with in-stream processing and advanced querying from archive storage. Benefit from lightning-fast alerting and a customizable pipeline.
2. IBM Instana

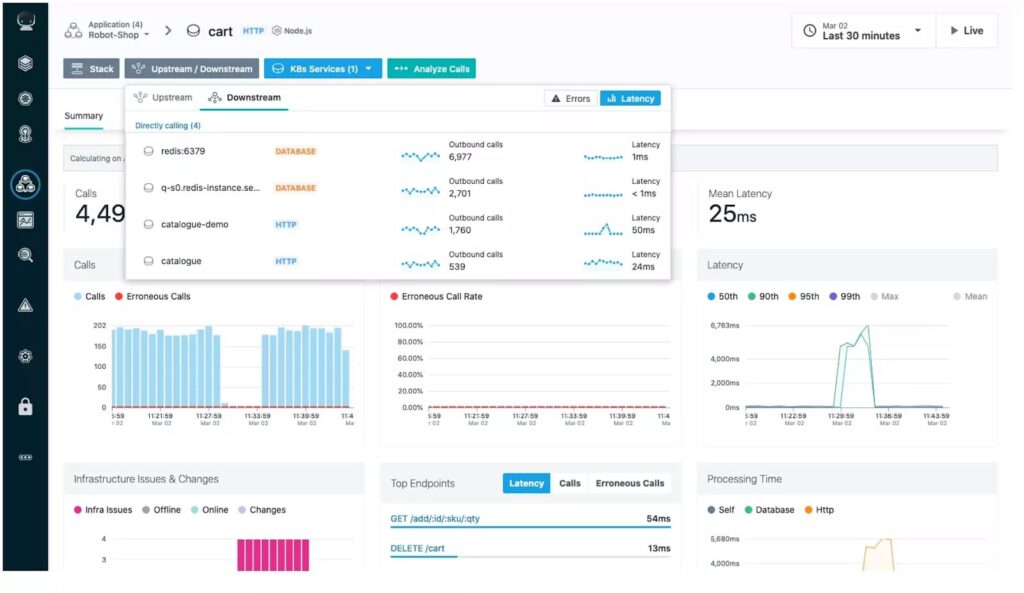
IBM Instana observability is a solution for managing application performance in real time with automated full-stack observability. It provides visibility across services and infrastructure components, capturing traces and detecting changes in real-time. The platform automates root cause detection and resolution.
Key features of IBM Instana Observability:
- Built-in automation: Automation spans from instrumentation to discovery, mapping, grouping, data visualization, and analytics.
- Application and infrastructure context: Provides insights into how issues with one component affect others, helping shape an understanding of the system.
- AI-powered intelligent actions: Uses AI to recommend timely mitigation actions and automate issue remediation.
- Transparent pricing: Simple and predictable pricing model based on the number of hosts monitored, whether physical or virtual.
- Real-time, high-fidelity data: Offers visibility into dynamic application and infrastructure environments, allowing for effective management of cloud-native environments.
Source: IBM
3. Splunk Observability Cloud

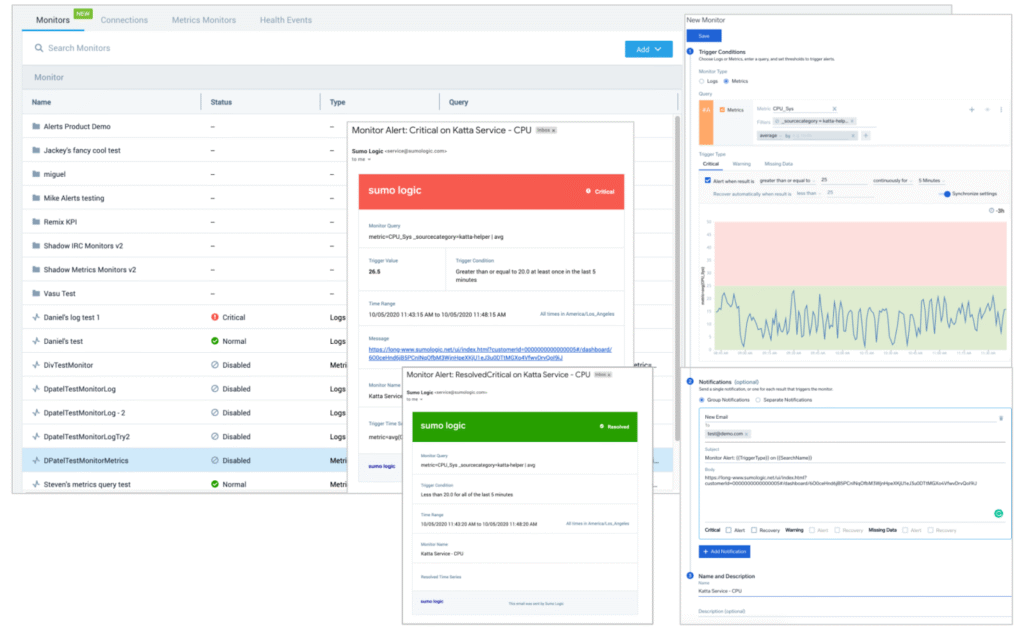
Splunk Observability Cloud provides monitoring and troubleshooting across infrastructure, applications, and user interfaces in real-time, at varying scales. It collects data from on-premise and cloud infrastructure, applications, services, and user interfaces, transforming raw metrics, traces, and logs into actionable insights.
Key features of Splunk Observability Cloud:
- Data integration: Supports over 100 integrations with common data sources, enabling data ingestion from various environments.
- Monitoring: Supports data capture across all layers of the stack, providing real-time insights and enabling accurate troubleshooting.
- Actionable insights: Transforms raw data into dashboards, visualizations, alerts, and more, allowing teams to respond to issues and optimize performance.
- Real-time alerts and dashboards: Offers customizable alerts and visualizations to monitor system health and performance.
- Infrastructure monitoring: Provides analytics on infrastructure and resources across hybrid and multi-cloud environments, supporting a range of data collection.
Source: Splunk
4. Datadog Observability Pipelines
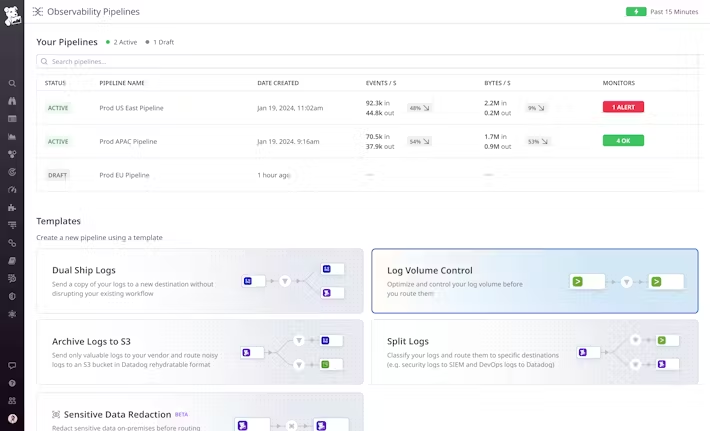
Datadog Observability Pipelines enable organizations to control log volume, reduce vendor lock-in, and secure sensitive data at scale. By aggregating, processing, and routing logs within the organization’s infrastructure, it allows for secure and flexible data management.
Key features of Datadog Observability Pipelines:
- Log processing and routing: Can filter and reduce log sizes before routing, retaining only relevant fields to stay within budget. Applies rule-based daily quotas or sampling strategies and routes noisy logs to an archive based on priority and needs.
- Simplified migrations and vendor lock-in reduction: Dual-ships logs to ensure business continuity when migrating between vendors or using multiple solutions. Offers easy routing for different logging use cases to leverage different solutions.
- Compliance and security: Offers the Sensitive Data Scanner to redact sensitive data (e.g., credit cards, email addresses, IP addresses) before it leaves the environment. Helps maintain compliance with regulations like PCI, GDPR, HIPAA, and CCPA by controlling data routing and applying built-in or user-defined rules.
- Centralized pipeline management: Lets users build, monitor, and manage log pipelines through a single control plane. Offers templates for common use cases such as dual shipping logs, reducing log volume, and archiving data.
Source: Datadog
5. Sumo Logic Observability

Sumo Logic Observability ensures application reliability by providing a cloud-native monitoring and observability platform. It helps improve digital experiences, modernize applications and architectures, and enhance application release cycles and quality.
Key features of Sumo Logic Observability:
- Infrastructure monitoring: Reduces downtime and resolves customer-impacting issues quickly by integrating all application data into a single observability platform.
- Log analytics: Breaks down silos with a log management solution that improves monitoring, troubleshooting, and security.
- Application observability: Enriches and analyzes traces, logs, and metrics with automatically generated application topology.
- Cloud infrastructure security: Provides increased threat visibility and deep security context with use-case-driven queries, dashboards, and alerts.
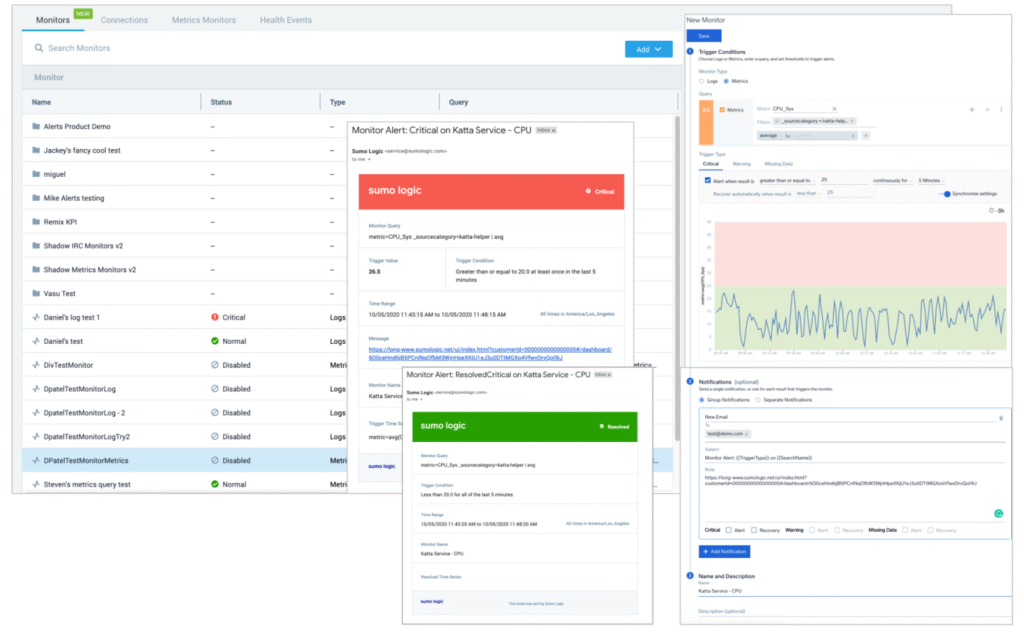
Source: Sumo Logic
6. Grafana Cloud Frontend Observability
Grafana Cloud Frontend observability is a hosted service that provides real user monitoring (RUM) to deliver actionable insights into the end-user experience of web applications. It enables organizations to monitor real-time frontend health, track frontend errors, and resolve issues with end-to-end visibility across the stack.
Key features of Grafana Cloud Frontend Observability:
- User monitoring insights: Provides data on frontend health, helping understand the end-user experience. Monitors and reports on Web Vitals to optimize website and application performance.
- Troubleshooting user-facing issues: Reconstructs user behavior leading up to an issue and correlates this data with backend requests. This helps in debugging performance issues by providing a view of user interactions.
- Reducing MTTR: Automatically groups similar errors, enabling users to investigate issues down to specific lines of code.
- Monitoring end-user experience: Measures metrics such as page load times, user interactions, and cumulative layout shifts. This helps in maintaining the user experience by aligning performance metrics with business goals.
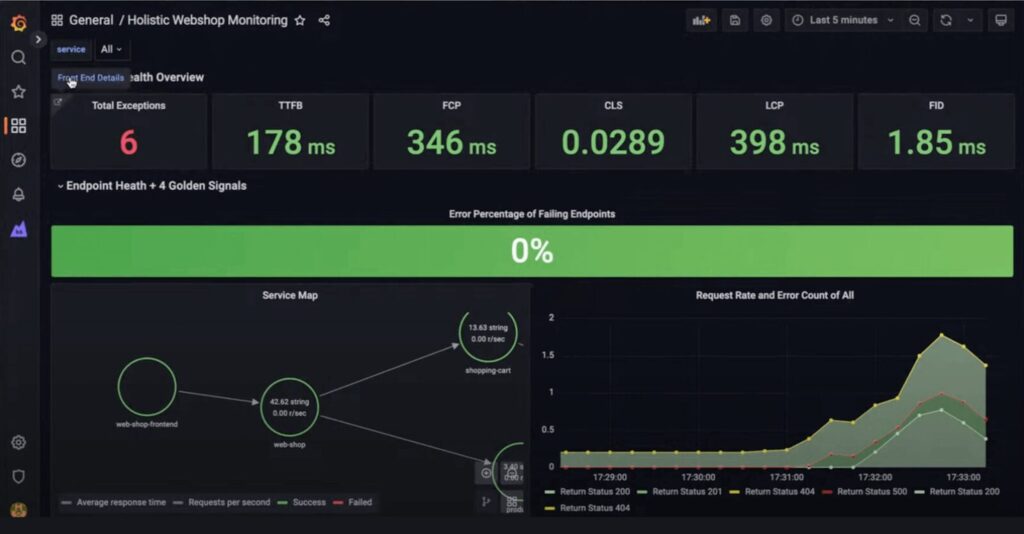
Source: Grafana
7. SolarWinds Observability

SolarWinds Observability is a SaaS-delivered platform that provides full-stack visibility across cloud-native, on-premises, and hybrid environments. It aims to ensure optimal service levels and user satisfaction for custom and commercial applications.
Key features of SolarWinds Observability:
- Unified visibility: Eliminates tool sprawl by providing a single-pane-of-glass view of the environment.
- Accelerated issue resolution: Uses data-driven insights to speed up problem resolution.
- AIOps and machine learning: Reduces alert fatigue through AIOps enhanced with machine learning. This feature automatically prioritizes and surfaces critical issues.
- Cloud modernization support: Offers a cloud-native, multi-tenant observability solution that integrates with SolarWinds hybrid cloud observability tools, offering a view across multi-cloud, hybrid, and on-premises environments.
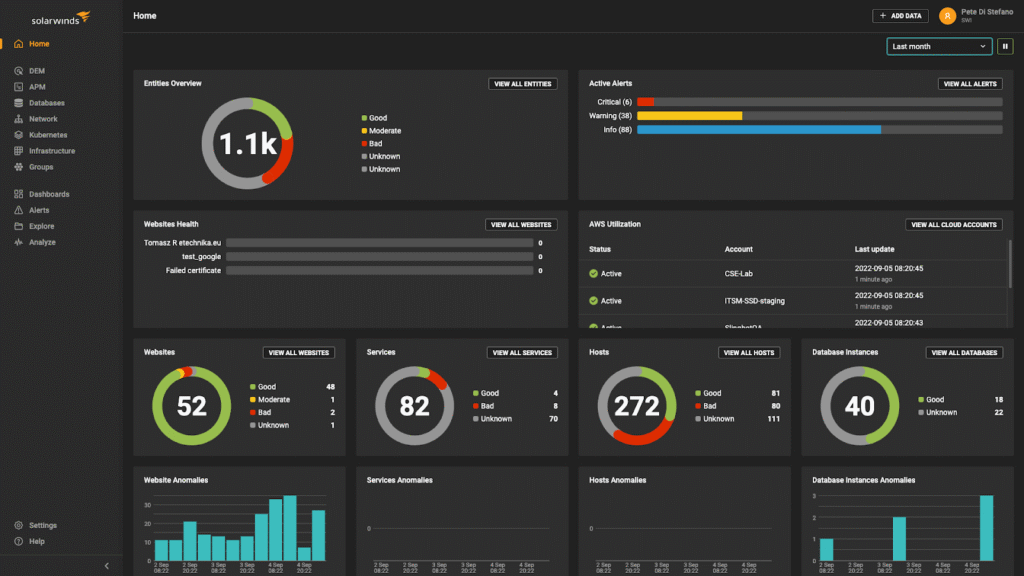
Source: SolarWinds
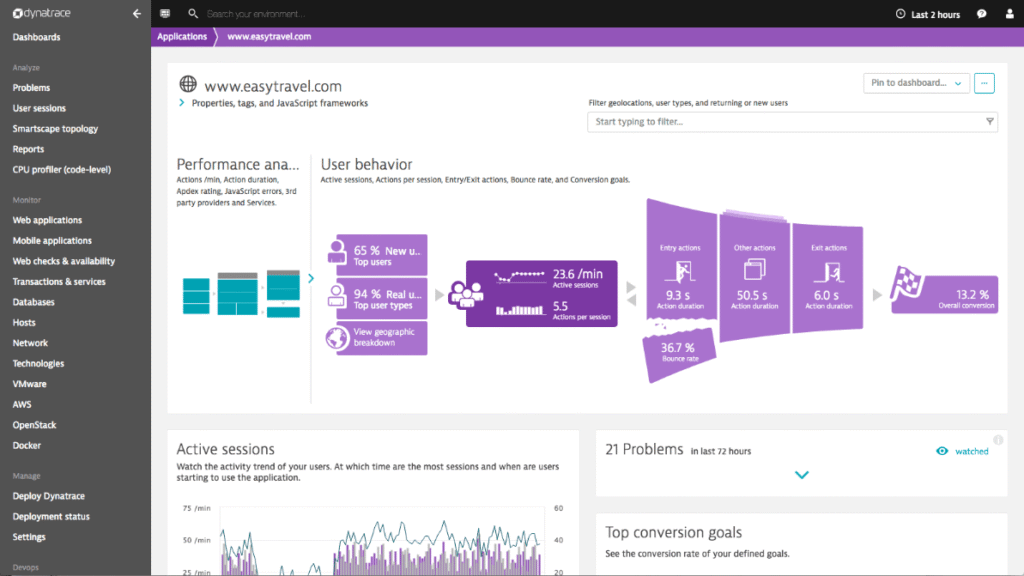
8. Dynatrace Full Stack Observability

Dynatrace provides a unified platform for monitoring the IT environment. It integrates all components, ensuring visibility and control across cloud-native, on-premises, and hybrid ecosystems, making it easier to resolve issues quickly.
Key features of Dynatrace Full Stack Observability:
- Unified monitoring solution: Eliminates tool sprawl and provides a single source of truth for IT teams, enhancing their ability to resolve issues early.
- In-context monitoring: Monitors every component of the hybrid cloud environment, helping understand relationships and interdependencies. This allows Dynatrace’s AI engine to provide causation-based answers and actionable insights.
- User experience focus: Integrates real user monitoring, synthetic transaction monitoring, and session replay to help understand customer behavior and user experiences.
- Code-level observability: Supports code-level monitoring across all applications, regardless of the languages used or deployment environment.
Source: Dynatrace
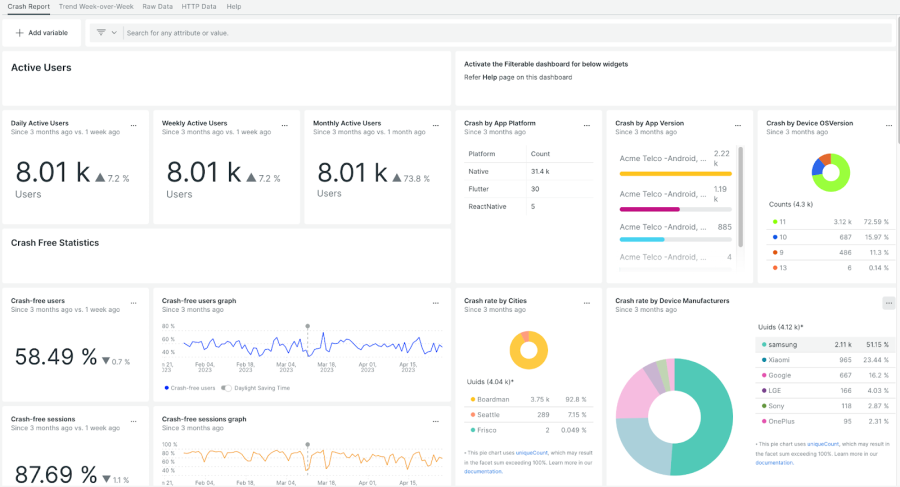
9. New Relic Observability Platform

New Relic offers a platform that combines observability and security, offering visibility across the stack. Its access to an open-source ecosystem helps provide scalable, AI-powered insights to eliminate silos in data, tools, and teams.
Key features of New Relic Observability Platform:
- Unified visibility: Integrates multiple capabilities into a single, unified experience.
- Open-source ecosystem: Supports a large open-source ecosystem, providing flexibility and avoiding vendor lock-in.
- AI-powered insights: Offers actionable insights through AI-powered analytics to help address issues across systems.
- Cost efficiency: Offers lower per-GB pricing compared to traditional host-based pricing models.
Source: New Relic
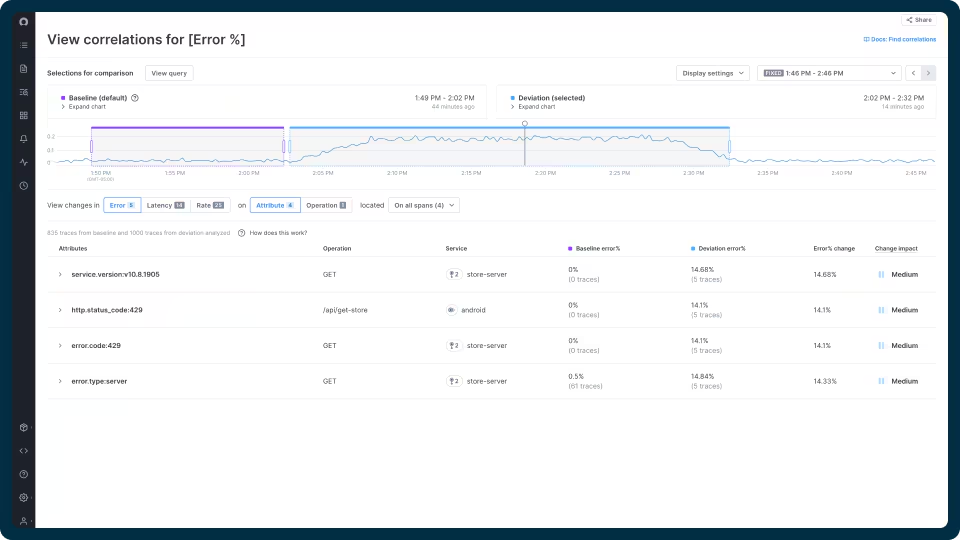
10. ServiceNow Cloud Observability

ServiceNow offers a cloud observability platform that provides AI-powered insights to detect and quickly respond to changes in cloud-native and monolithic applications. It offers system visibility and context at scale, providing a unified platform for enterprise automation.
Key features of ServiceNow Cloud Observability:
- AI-powered insights: Uses AI to detect and respond to changes in real-time, helping manage various applications.
- Unified platform: The Now Platform® integrates various observability capabilities, optimizing productivity, cost, and resilience.
- Scalable solutions: Adapts to changing needs, ensuring that observability tools grow with the organization.
- Investigative notebooks: Reduces investigation time, allowing teams to focus more on development and less on troubleshooting. These notebooks help simplify the problem-solving process.
Source: ServiceNow
Conclusion
Observability is essential for maintaining the reliability and performance of modern systems. As infrastructure grows more complex, the ability to effectively monitor, troubleshoot, and optimize operations becomes increasingly critical. By leveraging observability tools and platforms, organizations can gain comprehensive visibility into their systems, enabling them to proactively identify issues, reduce downtime, and ensure seamless user experiences.


