The cross-stack
observability platform
-
In-stream analysis & alerting

-
Stored on your cloud
-
Remote, index-free querying
-
Infinite retention
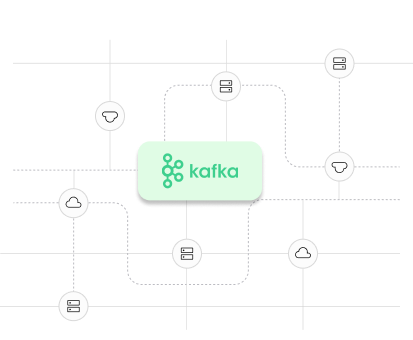
Unique architecture, built for scale
We’ve combined logs, metrics, traces, security and AI observability into a single platform. Our unique index-free architecture frees you from bloated storage and slow queries so you can focus on what matters most: communicating and solving problems in real time.
A single prompt injection or data leak can expose sensitive info and trigger compliance violations.
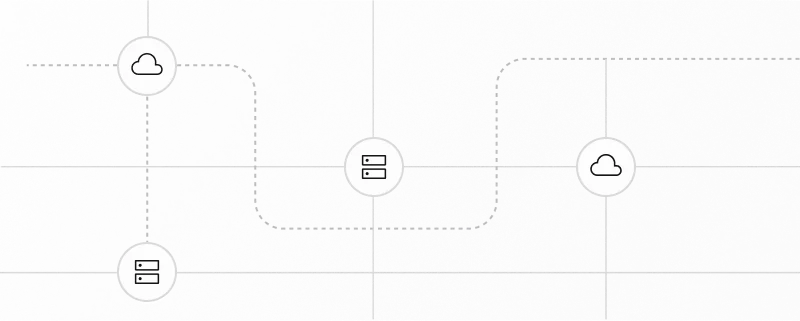
Your cloud
Observability data stored on your S3 bucket
Your tools &
/ data
Stored on your cloud,
Queried from remote

Send data to backends Open standards: OTel, Prometheus


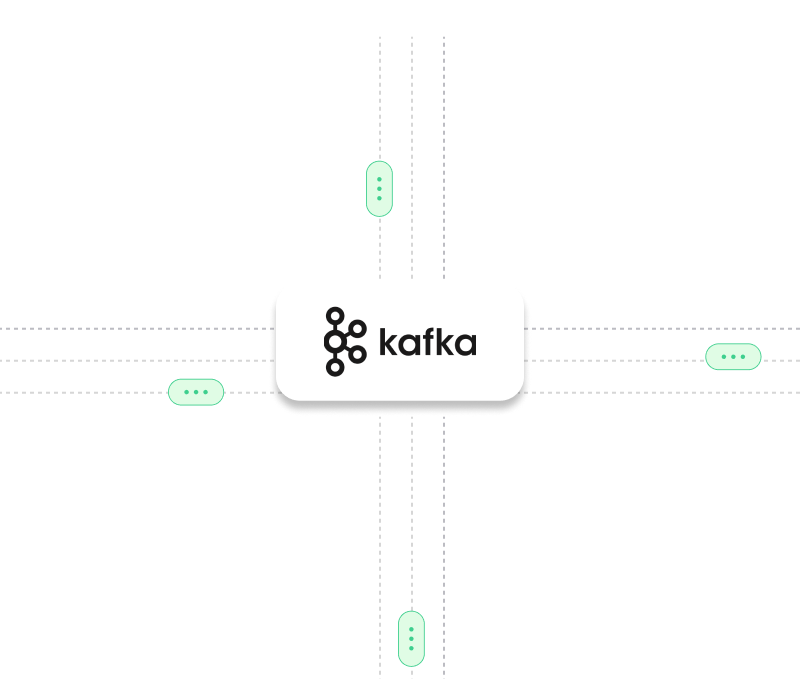
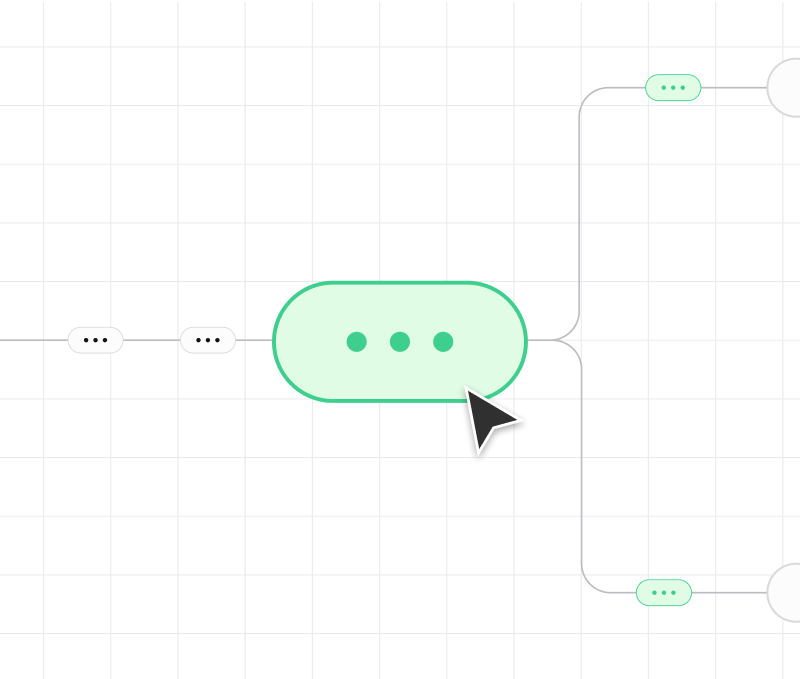
Source, stream, sink
-
Source
Data is ingested from any external source using Kafka Connect which produces events and state-storage to Kafka topics & k-tables.

-
Stream
Events flow to Kafka for stream analysis and are automatically parsed, enriched, and clustered using machine learning algorithms.
-
Sink
Data and insights are sent to any external source once it’s passed through the stream analysis engine.