
Fair, fixed pricing for all
Pay for your data and nothing more. All features & support included.
Log everything. Access anytime.
-
 Infinite retention
 -
 Stored in your bucket
Full trace visibility, 0 trade-offs.
-
Infinite retention
-
Stored in your bucket
Every metric, instantly queryable.
-
Infinite retention
-
Stored in your bucket
Log everything. Access anytime.
-
Infinite retention
-
 Evaluate AI in real-time
- Every account includes:
- 24/7 real human support
- Unlimited sources
- Unlimited users and hosts
- Daily quota renewal
- Enterprise features
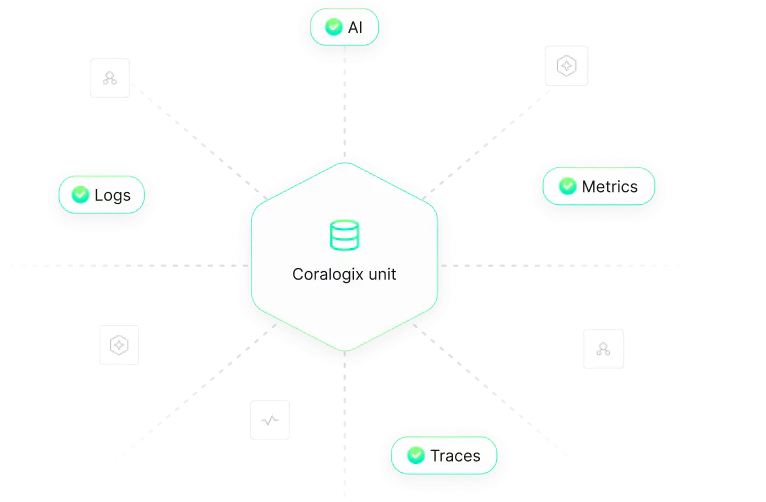
We use units as our
currency system
No need to plan usage in advance
Mix and match logs, metrics, traces and AI across any of our data pipelines- with units, your pricing stays consistent, no matter how your needs shift.
Simple pricing for all
- Amount
- Units
- Price
Daily amount of ingested data
Amount of units charged/month
$ per month, billed annually
- GB
- TB
- PB
- GB
- TB
- PB
- GB
- TB
- PB
- M
- B
- T
Why we’re different
Unlimited sources
Ingest data from as many sources as you need—without restrictions or extra costs.
Enterprise features included
Get built-in access to advanced capabilities like RBAC, SSO, audit trails, and compliance controls.
- RBAC & SSO with SAML
- Audit trail & IP access control
- Cross-team quota manager
- Full security & compliance
Unlimited users included free
Enable seamless collaboration across your entire organization with no user limits.

Unlimited hosts
Monitor and manage infrastructure at any scale, with no cap on the number of hosts.
Built for scale
Process 3M+ events per second across 500K+ applications worldwide.
24/7 customer support
Included in every account, at no extra cost

Support from real software engineers
17s median response time for all support requests
Median 1 hour resolution time for all support requests
FAQ
How do units work?
At Coralogix, units serve as our system of currency to provide you with the most flexible, tailored pricing model. Units are based, however, on volume; so you’re still paying based on the amount of data you ingest.
1 unit = $1.50 worth of logs, metrics, and traces, across varying data pipelines.
For example, 1.3GB of logs in frequent search ($1.15/GB) is equivalent to 1 unit. 3GB of logs in the monitoring pipeline ($0.50/ GB) is also equivalent to 1 unit.
Are there different pricing tiers?
Nope! You pay for how you use your data, and that’s it.
Your plan is for a determined number of units which you can use however you want according to your data and monitoring needs. Regardless of how you prioritize your data, you have full access to all Coralogix features.
Use the TCO Optimizer to designate your data to different pipelines according to use case. This way, you can optimize and reduce your spend without losing critical visibility or feature functionality.
Is there a free trial?
Yes, you can sign up for a free trial (no credit card needed) and get full feature access for 14 days with a quota of 8 units.
How much extra will I pay in S3 costs?
When we send data to S3 for archiving, we compress logs and traces by a factor of 5. This means that if you send 5GB of data to Coralogix, only 1GB is stored in S3, yet all the data remains fully accessible. For logs and traces, the effective cost per GB for S3 storage is $0.003.
We compress metrics by a factor of 30, so if you send 30GB of data to Coralogix, 1GB will be stored in S3, yet all the data remains accessible. This means that the effective cost per GB for metrics storage in S3 is just $0.000033.
What are the data retention options?
With all data being written to your S3 bucket, you essentially get infinite retention. You can directly query your archive from the Coralogix UI (at no additional cost) and send that data back for further analysis at any time.
For Frequent Search data that is being indexed to our hot storage, you can choose any retention you want to maintain lightning-fast queries. We don’t generally recommend a retention of longer than 7 days as your data will always be available in your S3.
Metrics generated from log and trace data are simultaneously cached in Coralogix and stored in your S3 bucket. Thanks to our compression and unique query engine, your data footprint is small yet you maintain rapid access to S3-stored metrics. As a result, you can retain data in S3 for as long as necessary without sacrificing performance.
What happens to my data when the retention period is over?
The retention period is relevant only for log data assigned to the Frequent Search pipeline which supports lightning-fast queries.
All data is written to your own Amazon S3 bucket upon parsing and enrichment. You choose how long to store your data in S3 and you can remote query directly from the Coralogix platform without using additional quota.
How is the data usage calculated?
Based on the distribution of your data to the different pipelines, your usage will be converted to units and counted against your daily quota. Admins can view and manage quota from the Settings page.
What happens if I exceed my plan?
When you reach 80% of your daily plan, you will be alerted via email. We recommend activating our Pay-As-You-Go feature which allows you to continue ingesting data up to 2X your daily plan quota.
If you reach your plan quota and haven’t contacted us, upgraded, or decreased/reprioritized your data, you will be notified that your data has been temporarily blocked until 00:00 UTC when we will automatically release it.
Note: Data ingested as part of the ‘Pay As You Go’ plan will be charged at a rate 25% higher than the standard plan.
How much do support and professional services cost?
Nothing!
Our dedicated Customer Success team is available 24/7 to help you with data integrations, onboarding, dashboard setup – you name it. Any member of your team can use the in-app chat to send them a message and someone from our team will get back to them in under a minute.