Prometheus and Docker: 2 Ways to Use Them Together

What Is Docker?
Docker is an open-source platform that automates the deployment of applications inside software containers. By providing an additional layer of abstraction and automation of operating-system-level virtualization on Linux, Docker enables developers to package their applications and dependencies into a portable container, which can then be published to almost any platform.
Containers are lightweight, standalone, and executable software packages that include everything needed to run a piece of software, including the code, a runtime, libraries, environment variables, and configuration files.
Two Ways to Use Prometheus with Docker
1. Installing Prometheus with Docker
The Prometheus Docker image provides an easy way to monitor your applications. You can deploy Prometheus in your containerized environment and immediately start collecting metrics from Docker containers. Here are some benefits of deploying Prometheus with Docker:
- Ease of deployment: Deploying Prometheus within Docker containers simplifies the installation process, ensures consistency across different environments without worrying about dependency conflicts.
- Scalability: Both Prometheus and Docker are designed with scalability in mind. Docker’s containerization approach allows for efficient resource use, while Prometheus’s architecture can handle large volumes of metrics, making it ideal for monitoring applications at scale.
- Flexibility: Docker containers can run anywhere, providing the flexibility to deploy Prometheus across various environments, from local development machines to production servers in the cloud.
- Isolation: Running Prometheus in Docker containers ensures that its environment is isolated from the host system. This reduces the risk of conflicts with other applications and simplifies version upgrades and rollback.
- Persistent storage and configuration: Docker volumes can be used to persist Prometheus’s data and configuration across container restarts, ensuring that your monitoring data and Prometheus configuration survives, regardless of container lifecycle events.
2. Using Prometheus for Docker Monitoring
Prometheus can be used to collect metrics from Docker containers. Prometheus is natively supported by Docker, avoiding the need for complex integration. This can provide several important capabilities:
- Dynamic service discovery: Prometheus seamlessly integrates with Docker, providing dynamic service discovery. This is essential for monitoring in environments where containers frequently start and stop, ensuring that all instances are automatically discovered and monitored.
- Fine-grained metrics: Prometheus collects detailed metrics about Docker containers, including CPU usage, memory consumption, I/O rates, and network usage, vital for understanding the performance and health of applications running in Docker containers.
- Flexible alerting: Prometheus’s alerting rules allow teams to define complex conditions on collected data. If these conditions are met, Prometheus sends alerts, making it easier to detect and respond to issues quickly.
- Scalability: Prometheus is designed to handle large-scale deployments. Prometheus’s efficient time-series database can store vast amounts of metrics, making it suitable for monitoring any number of Docker containers.
Quick Tutorial #1: Installing Prometheus Using Docker
Note: Before proceeding, please install Docker on your system.
Installing Prometheus as a Docker container is a straightforward process that can enhance the monitoring capabilities of your applications, especially those deployed in Docker environments. Here’s a step-by-step guide to getting Prometheus up and running using Docker, including code snippets to illustrate each step.
Running a Simple Prometheus Instance
The most basic way to get Prometheus running on Docker is to use the following command:
docker run -p 9090:9090 prom/prometheus
This command starts a Prometheus instance with a sample configuration and makes it accessible on port 9090. It’s an excellent way to quickly deploy Prometheus for testing or development purposes.
Using Volumes for Persistent Storage
For production environments, it’s crucial to ensure that your Prometheus data persists across container restarts and upgrades. This is achieved by using a named volume, which can be managed more easily than anonymous volumes. The command below illustrates how to create a named volume for Prometheus data:
docker volume create prometheus-data
Once the volume is created, you can start Prometheus with persistent storage by mounting this volume into the container:
docker run
    -p 9090:9090
    -v prometheus-data:/prometheus
    prom/prometheus
This setup not only persists your metrics data but also allows you to provide a custom configuration via the prometheus.yml file.
Providing Custom Configuration
Prometheus allows for extensive customization through its configuration file, prometheus.yml. To use a custom configuration, you can bind-mount the file or the directory containing it into the Docker container. Here are two methods to achieve this:
Let’s create a very simple prometheus.yml file as shown below:
global:
  scrape_interval:     15s
  evaluation_interval: 15s
Here is how to bind-mounting a single file:
docker run
    -p 9090:9090
    -v /path/to/prometheus.yml:/etc/prometheus/prometheus.yml
    prom/prometheus
Here is how to bind-mount a directory:
docker run
    -p 9090:9090
    -v /path/to/config:/etc/prometheus
    prom/prometheus
Note: If you add a trailing slash at the end of /path/to/config or /etc/prometheus, it will treat the path as a file.
These commands allow Prometheus to use the configuration file located on your host machine, giving you the flexibility to adjust monitoring and alerting rules as needed.
Creating a Custom Prometheus Image
For environments where the Prometheus configuration does not change frequently, you can create a custom Docker image that includes your configuration. This approach simplifies deployment by eliminating the need for bind mounts.
The steps to create a custom Prometheus image are as follows:
- Create a new directory and add your prometheus.yml file to it.
- Create a Dockerfile in the same directory with the following content:
FROM prom/prometheus
ADD prometheus.yml /etc/prometheus/
- Build your custom Prometheus image:
docker build -t my-prometheus .
- Run your custom Prometheus image:
docker run -p 9090:9090 my-prometheus
This method encapsulates your configuration within the Docker image, making it easy to deploy across different environments without additional configuration steps.
Quick Tutorial #2: Collect Docker Metrics with Prometheus
To efficiently monitor your Docker instances using Prometheus, configure your Docker daemon for Prometheus metrics collection and run Prometheus within a Docker container. The process involves configuring the Docker daemon, setting up a Prometheus configuration file, and executing Prometheus as a container. Let’s see how to accomplish this.
Configuring the Docker Daemon
Firstly, configure your Docker daemon to expose metrics in a format that Prometheus can collect. This involves editing the daemon.json configuration file to specify the metrics-address. Depending on your operating system, the location of daemon.json may vary:
- Linux: /etc/docker/daemon.json
- Windows Server: C:ProgramDatadockerconfigdaemon.json
- Docker Desktop: Access through Docker Desktop settings under “Docker Engine”.
Add the following configuration to daemon.json:
{
  "metrics-addr": "127.0.0.1:9323"
}
After adding the configuration, restart Docker to apply the changes. Docker will now emit metrics on port 9323 on the loopback interface, making them accessible to Prometheus.
If you want these metrics to be accessible via remote Prometheus instance, you can use the following:
{
  "metrics-addr": "0.0.0.0:9323"
}
Setting Up Prometheus Configuration
Next, prepare a Prometheus configuration file. This file instructs Prometheus on how to collect metrics from your Docker daemon. Create a file, for example, /tmp/prometheus.yml, and include the following configuration:
global:
  scrape_interval: 15s
  evaluation_interval: 15s
  external_labels:
    monitor: "codelab-monitor"
scrape_configs:
  - job_name: 'prometheus'
    static_configs:
      - targets: ['localhost:9090']
  - job_name: 'docker'
    static_configs:
      - targets: ['host.docker.internal:9323']
For a remote host, use the following:
- targets: ['IP-ADDRESS:9323']
This configuration sets Prometheus to scrape metrics every 15 seconds and includes a job for collecting metrics from the Docker daemon.
Running Prometheus in a Container
With the configuration file in place, start Prometheus as a container using the command:
docker run --name my-prometheus
    --mount type=bind,source=/tmp/prometheus.yml,destination=/etc/prometheus/prometheus.yml
    -p 9090:9090
    --add-host host.docker.internal=host-gateway
    prom/prometheus
If using Docker Desktop, the –add-host flag ensures that the host’s internal IP is accessible to the Prometheus container as host.docker.internal, aligning with the target defined in the Prometheus configuration.
If you want to use the IP address 0.0.0.0, use the following command:
docker run --name my-prometheus
--mount type=bind,source=./prometheus.yml,destination=/etc/prometheus/prometheus.yml
-p 0.0.0.0:9090:9090
--add-host host.docker.internal:host-gateway
prom/prometheus
Verifying the Configuration
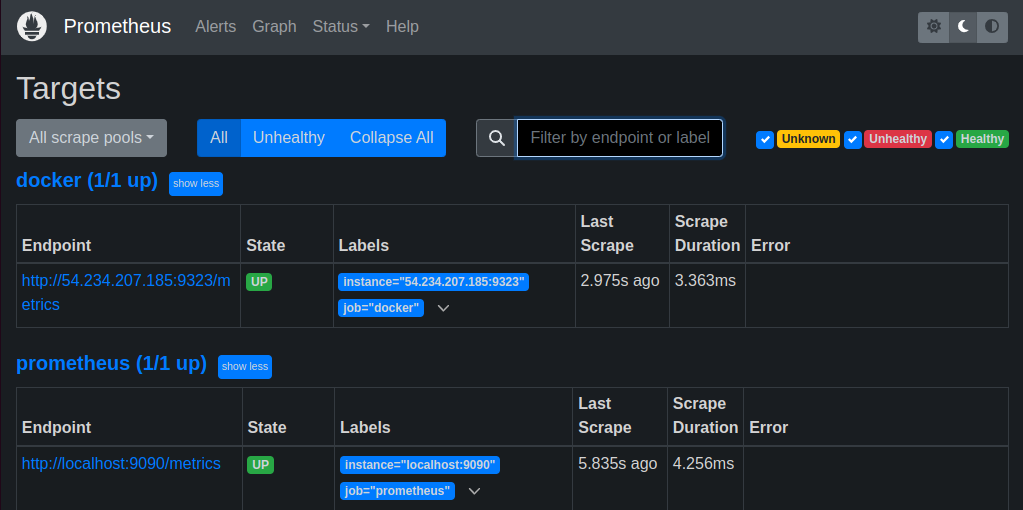
After starting Prometheus, you can verify that it’s correctly collecting metrics from Docker by accessing the Prometheus dashboard at http://localhost:9090/targets/ or http://<your-ip-address>:9090/targets.
You should see your Docker target listed, indicating successful configuration:
Utilizing Prometheus for Docker Metrics
With Prometheus now collecting metrics from your Docker instance, you can begin monitoring your container’s performance.
Access the Prometheus UI, navigate to the “Graphs” section, and execute queries to visualize metrics. For instance, querying engine_daemon_network_actions_seconds_count will display network activity over time. You can further explore the impact of running containers on network traffic by starting a temporary container and observing the changes in network activity metrics on the Prometheus dashboard.
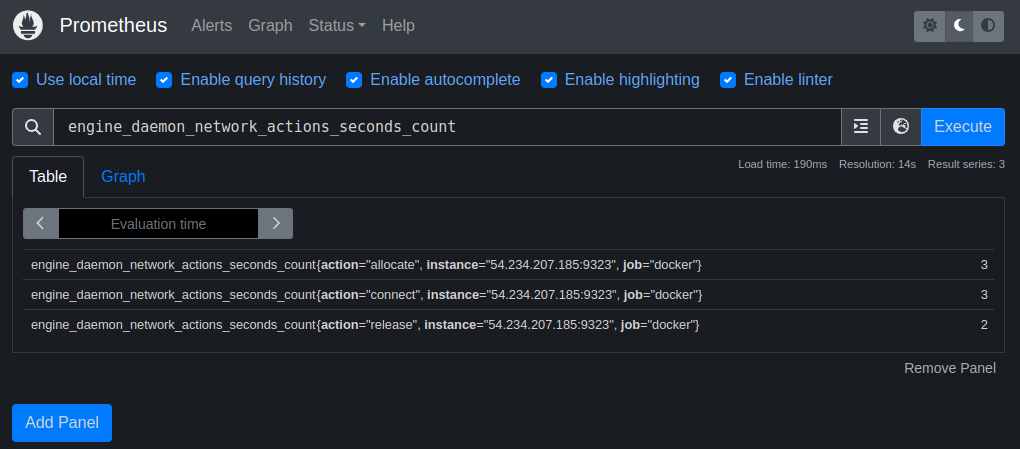
This setup allows for real-time monitoring and analysis of Docker metrics, offering insights into the performance and health of your containerized applications.
Managed Cloud Native Monitoring with Coralogix
Coralogix sets itself apart in observability with its modern architecture, enabling real-time insights into logs, metrics, and traces with built-in cost optimization. Coralogix’s straightforward pricing covers all its platform offerings including APM, RUM, SIEM, infrastructure monitoring and much more. With unparalleled support that features less than 1 minute response times and 1 hour resolution times, Coralogix is a leading choice for thousands of organizations across the globe.