Coralogix SLO Center & SLO Alerts are now available

Coralogix has released a new flagship service management product, the SLO Center. The SLO Center allows customers to define service level objectives (SLOs) for their teams. SLOs can be defined across multiple services or metric streams. Powered by the Coralogix Streama© engine, this unlocks full coverage SLOs for every team, regardless of volume and with very high cardinality limits.
What are SLOs and why are they important?
Service level objectives have a rich history in software engineering and site reliability engineering. First invented in Google, they were designed to help teams to think more clearly about their service availability.
Google found that when measuring simple metrics, like latency, and aligning a team around this, the team will optimize around the simple metric, to the detriment of others. Likewise, if a team aimed for 100% uptime, with 100% service availability, they would be terrified of making any change.
To combat this, SLOs are defined as a ratio. For example, a classic service level objective is to ensure that 99% of requests respond in under 500ms over a one month period. If a team is currently trending at 150ms for 99.9% of requests, then they may decide to experiment more, and include some more complex processing. Conversely, if a team is measuring 499ms for 99% of requests, then they are very close to breaching their SLO, and they may focus on performance.
SLOs create a framework for teams to ensure availability is maintained, but not at the detriment of innovation or experimentation. This can cover user facing metrics, like latency, or deep technical measures, like host availability, failover resilience, CPU utilization and so on.
Coralogix is proud to contribute to this tradition by bringing the SLO Center and SLO alerts to its customers.
How does the SLO center work?
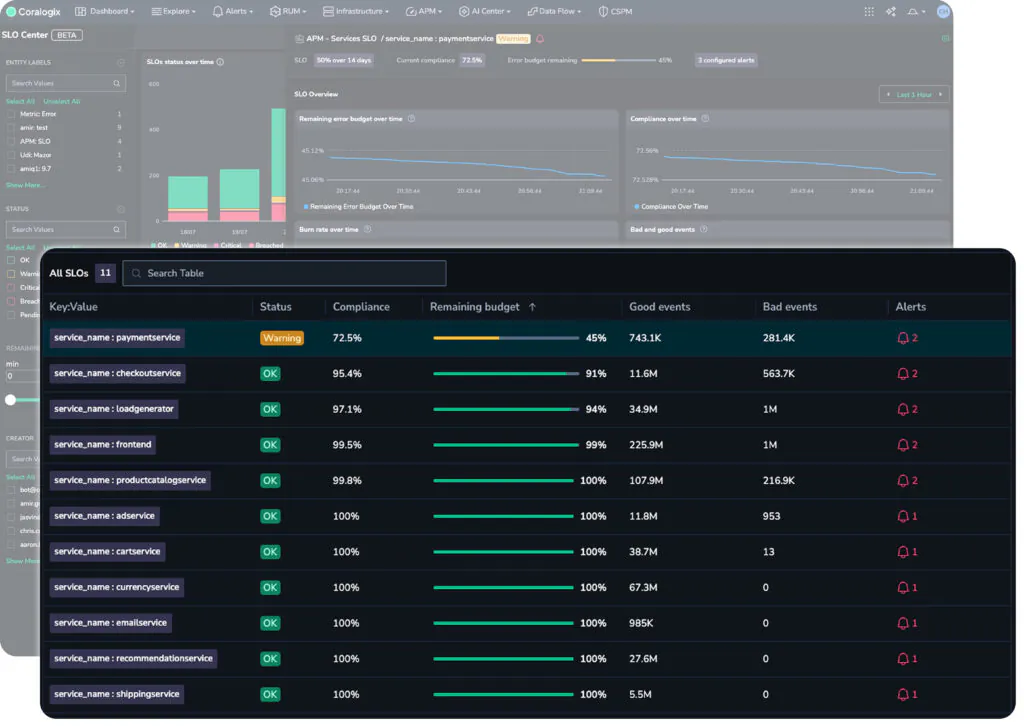
The Coralogix SLO center is defined under the APM tab in the navigation. Immediately, customers can see a high level overview of the trend of SLOs, and their associated breaches and alarms. Individual SLOs can maintain multiple simultaneous statuses. This means that an SLO has been grouped by a specific field – for example, track a status for every service name, customer ID or web page. This initial view is perfect for managers, or engineering leadership, who need to understand the overall efficacy of the SLO strategy at play within your organization.
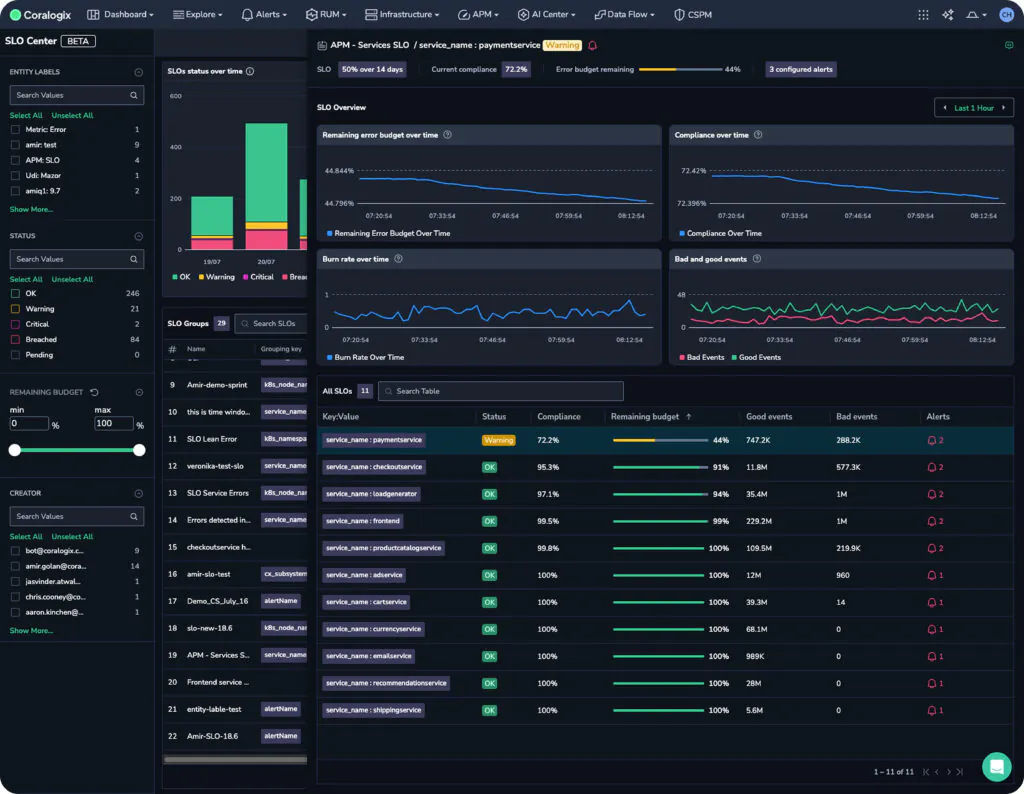
Selecting an SLO brings users to a much more detailed breakdown of the contributing factors to an SLO, providing a view over time, as well as snapshot compliance and error budget views. A team lead or SRE within a team can use this view to keep track of the health of a particular SLO. At the top, we can see a note, indicating that our payment service has a warning state.
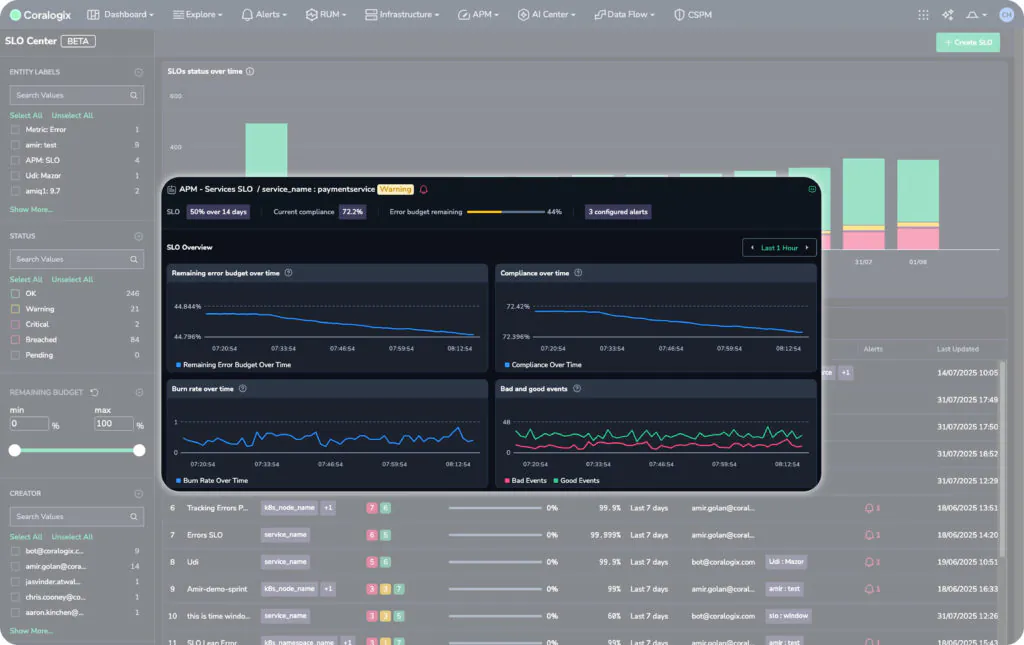
This warning state indicates that the payment service is dangerously close to breaching its SLO, but how close? We can see the remaining error budget for this service at the top and for each grouping.
So while all other services are healthy, it appears that the payment service is burning down its error budget, and will soon be in breach of its SLO. The SLO center has surfaced this information so that we can proactively solve the issue. In addition, we can define an entirely new alarm type, SLO, to ensure that we never miss an SLO breach or the warning signs.
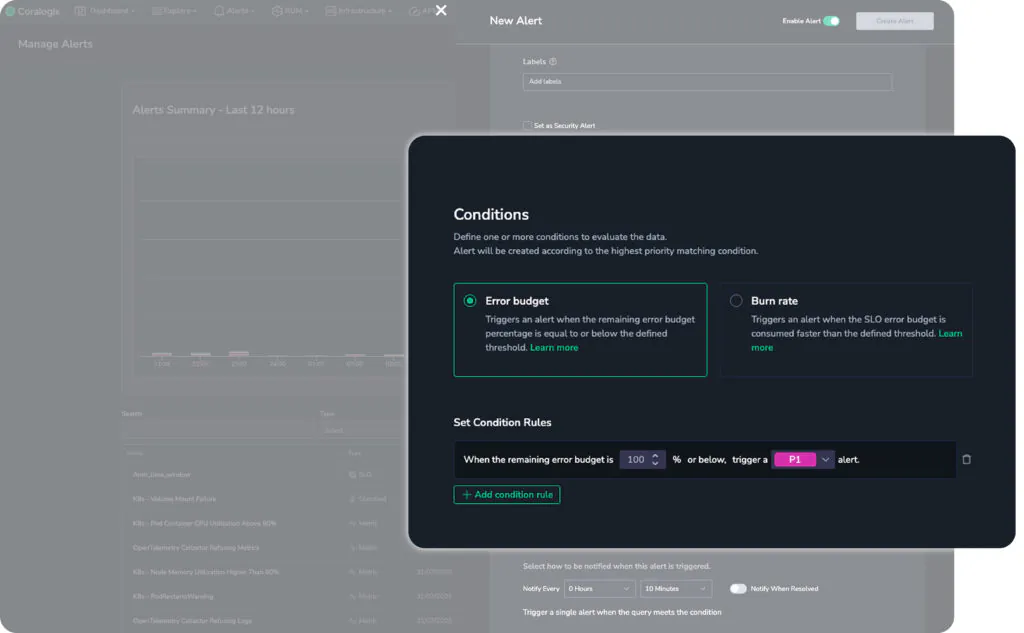
Note too that customers can define two different types of SLO alert. The first is the error budget. An error budget is the margin for error. For example, if an SLO demands 99.9% uptime for a service, the error budget is the remaining 0.1%. In the above image, a P3 severity alarm will trigger when there is 15% of the error budget left, P2 when there is 5% and P1 when there is 1%. This means, if the 0.1% margin for error is your total error budget, 15% remaining means that you have used up 0.085%. This is a clean implementation of the Google SRE recommendation to have ticket, notify and page alarms.
Second is Burn rate. This alarm will trigger on the rate of change of the error budget. This is an excellent early warning signal if something has changed. The error budget may be high, but it may be changing sharply, which is a clear signal that something has happened. Rather than waiting until the error budget is already very low, Coralogix will notify users that a change is occurring. Again, this enables proactive operations and more sophisticated alerting.
What about defining a new SLO?
Defining an SLO is as easy as writing two PromQL queries and specifying your error budget. In the following example, we can see a Good event query, which captures all successful APM requests. Secondly, we have an All events query, which captures all APM events. This is using the sum of a counter, which means that these metrics indicate the total calls within a given timeframe.
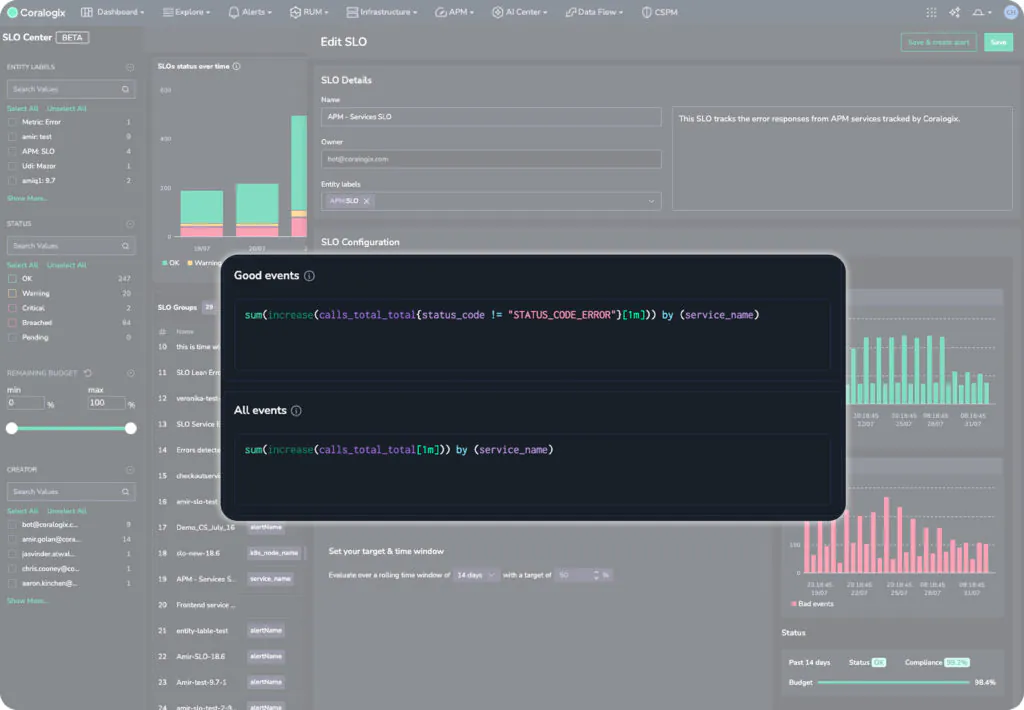
Notice how the metric is grouped by service name, meaning that this one SLO is split into an individual metric stream for each service in the APM catalog. This allows users to natively define their groupings.
Finally, customers simply need to define their target. For example, they may wish to indicate that 90% of requests in APM, over the past 2 weeks, were successful. This would be expressed in the following target:
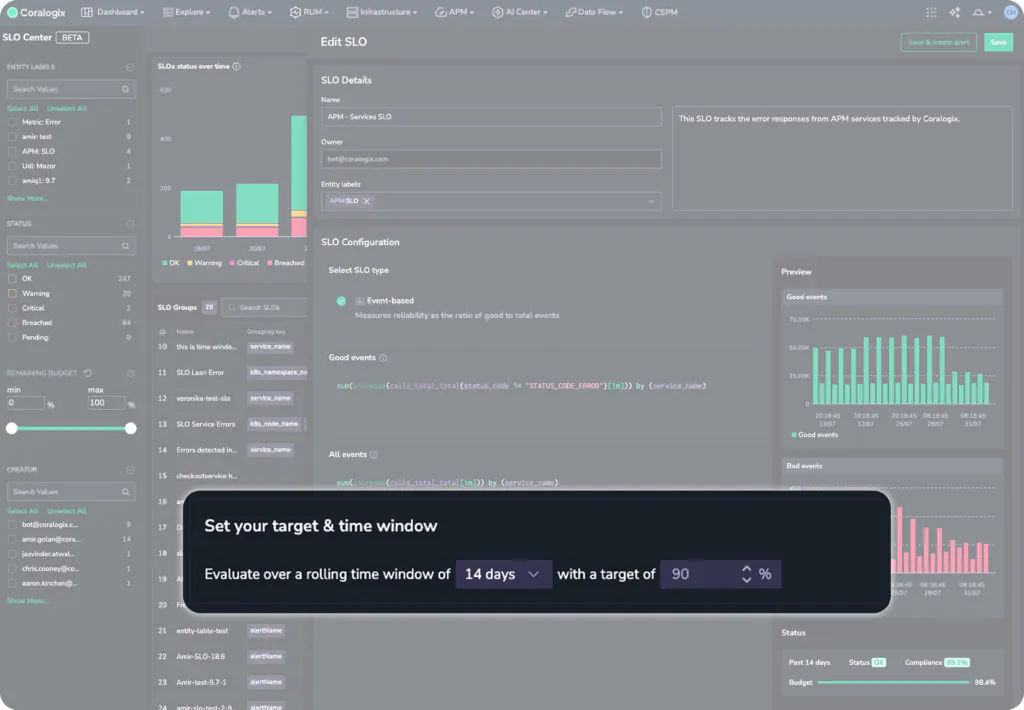
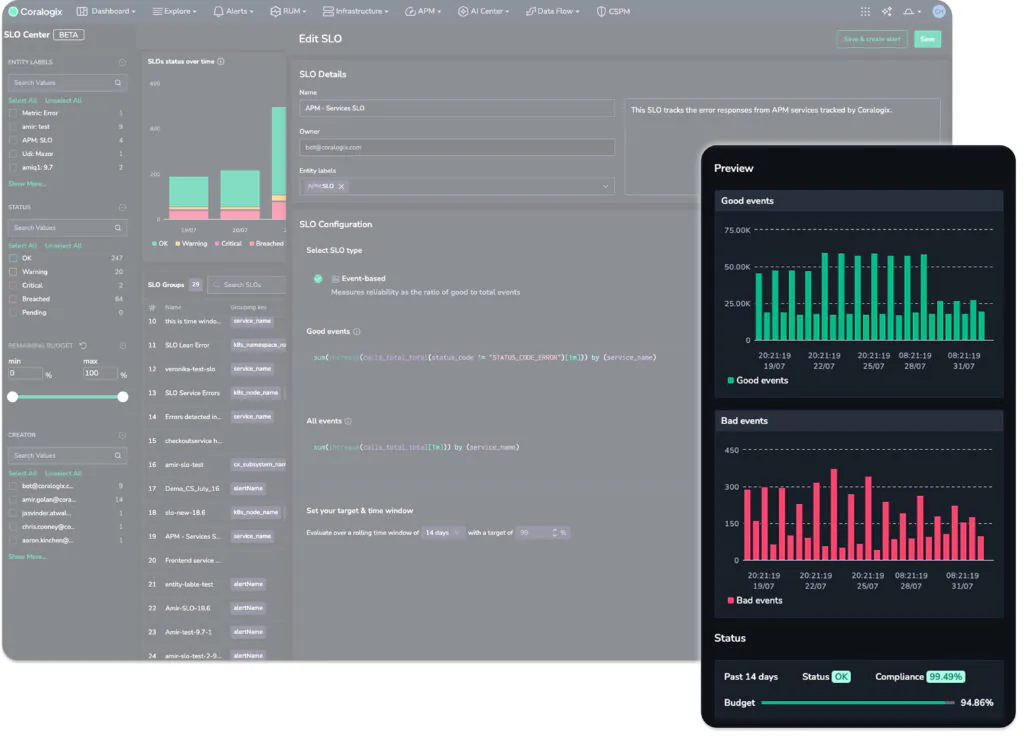
When the user updates their target, the previews on the right will change, to give the user an idea of how compliant they are with their SLO targets. This allows teams to define realistic SLOs that are based on the performance of their software today. If we change the threshold to something more stringent, say 99.9%, the UI responds to indicate today’s compliance with that goal:
In practice: Handling an SLO alarm in Coralogix
We’ll begin with a triggered alarm, as is often the case with operators of complex systems. An SLO alarm has triggered, indicating that only 50% of the error budget remains.

We can see that the alarm has sent a slack message, with a clear explanation of the alert itself, as well as links to relevant deep dives. When we select “View Alert”, we’re taken to the incident management view in Coralogix, which gives us an interactive exploration of the factors that triggered the alarm.
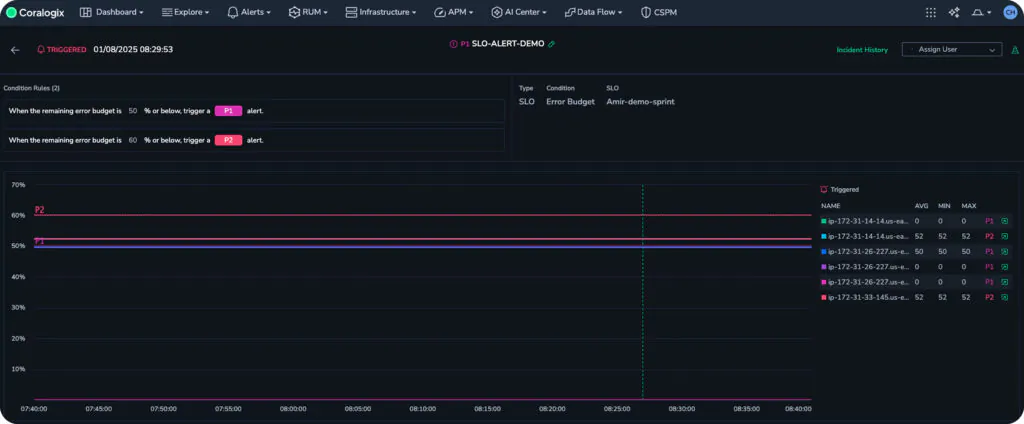
We can see that some time ago, we crossed the P2 threshold, and now we’re in breach of our P1 threshold. We need to understand why this SLO alarm has triggered. In Coralogix, this is now one click.
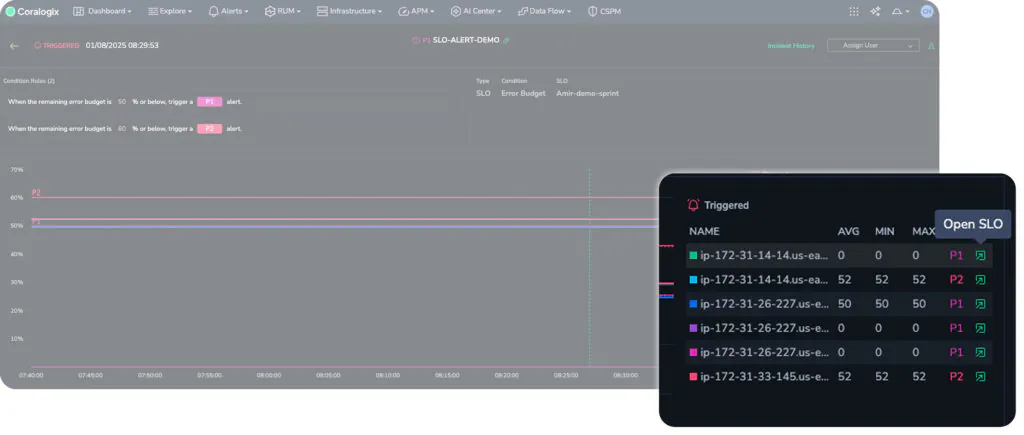
The “Open SLO” button will automatically take the user to the breached SLO, which gives rich information as to the root cause of the issue. From here, we have a clear trend over time, including all of the groupings and triggered alerts. We can clearly see the status of the SLO, the remaining error budget and more. We can even see, because of the grouping, the specific service whose uptime is degrading. Now we have a solid place to begin investigating.
How do I get started?
The SLO center is powered by Coralogix metrics. If you have metrics in your account, then you have everything you need to get started. You can check out the documentation here to learn more about how to configure SLOs, or if you would like to see a demo, please reach out to our sales team.