RUM measurements: Start with the data, discover the story

Rethinking how we investigate performance
When something breaks in your application, a slow page, a spike in errors, or a drop in engagement, the typical response is to chase the symptoms. But what if we flipped that process? What if we started not from user complaints, but from actual performance measurements, collected from real sessions in real time? That’s exactly the idea behind Coralogix RUM Measurements.
RUM Measurements give teams a focused, unified view of both standard and custom frontend measurements. This includes everything from web vitals like Large Contentful Paint or Cumulative Layout Shift to business-specific measurements like time-to-checkout or checkout conversion delay. Every measurement is tied to real users, including browser, device, OS, location, and more. It’s not synthetic testing or simulation. It’s real-world performance at full fidelity.
You don’t need to redeploy your app, define complex pipelines, or spend hours building queries. Measurements are processed in stream and become available instantly, with a single line code change:
CoralogixRum.sendCustomMeasurement('amount-money-spent', 1200);You’ll start with over 40 out-of-the-box measurements, which can be easily extended with any custom measurements that reflect the key insights you need to maintain an excellent digital experience for your customers.
From measurements to insight in minutes
As an SRE, you need to understand how real users are experiencing your site, particularly around page performance. If a page is loading slowly, you need to know not just that it’s happening, but why. By opening the RUM Measurements tab, it’s possible to immediately see key measurements like page load time and its distribution across sessions.

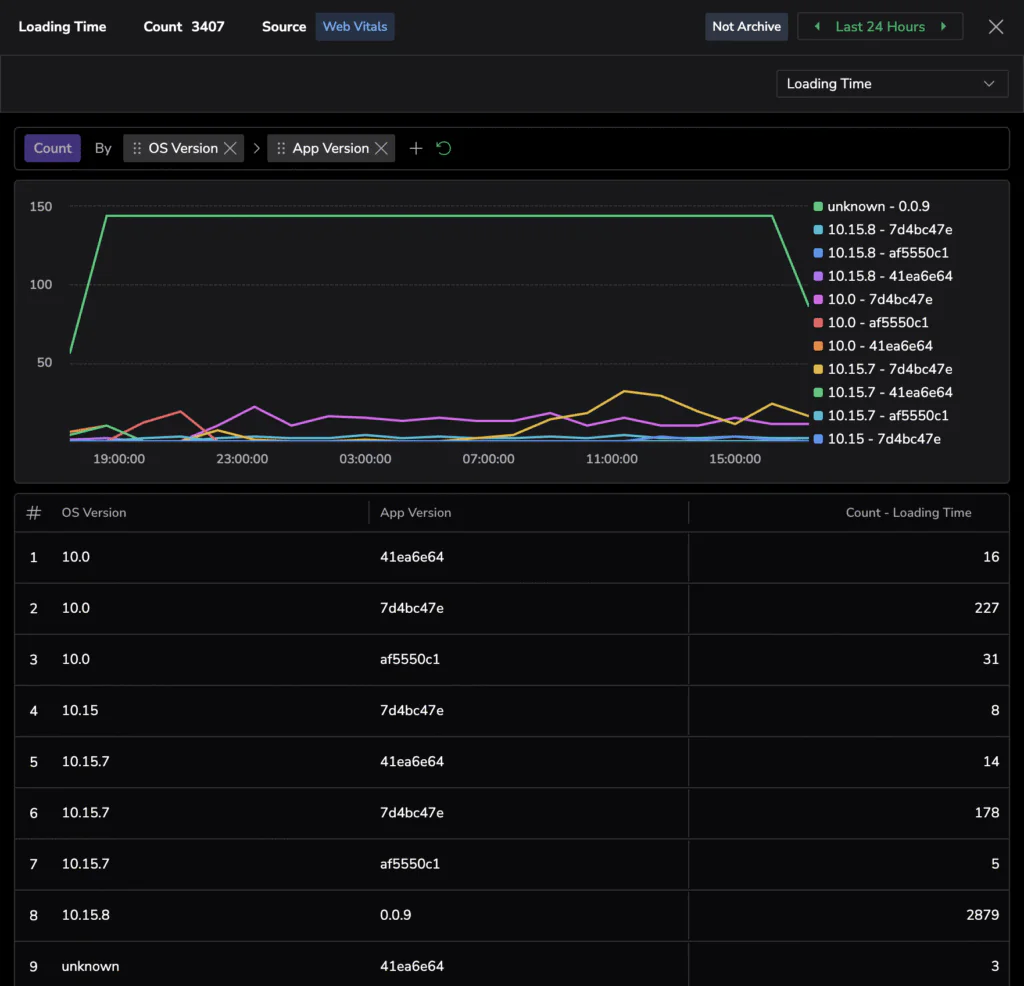
Suppose you’re investigating load time. You click on the measurement and instantly get a distribution view, grouped by browser. You can filter by time range, zoom in on a specific segment like Chrome on mobile, and explore whether the slowness is widespread or localized. You can also drill straight into the sessions that contributed to this value. Each session includes full context: navigation steps, device type, location, and even associated logs and traces.

Before jumping into session replays, it’s useful to analyze the measurement itself in more detail. In the measurement detail panel, you can use the distribution chart to group and compare values by browser, device, OS, or location. This view helps spot whether an issue is widespread or isolated to a specific segment. For example, you might see a spike only on Firefox for MacOS, which immediately narrows your investigation. From here, you can pivot directly into the relevant sessions for that segment, armed with the context of where and how the problem appears.
This is where the view shifts from purely quantitative to qualitative. By reviewing the session, it’s possible to see what the user was doing, what requests were made, and where time was lost. It’s the difference between seeing that something is slow and understanding the experience that caused it. And because this is all live data, the feedback loop between detection and diagnosis is nearly instant.

Long-term trends and smarter decisions
To go further and examine trends over weeks or months, you can toggle on archive mode to include historical data. While it may take a moment longer to load, this view enables validation of long-term regressions, seasonal patterns, and the impact of past releases. It’s perfect for performance reviews or pre-mortem planning.
Why it matters
RUM Measurements is an essential tool for teams to define the metrics that mean the most to them, and actually track them. By bringing key KPIs alongside deeply technical measures, teams can build an understanding of the causal relationships between their technical decisions and the business outcomes. Instead of waiting for alerts to fire or dashboards to spike, teams can proactively explore real-time measurements, understand their meaning, and take meaningful action before users ever notice.
Because when you begin with real performance data, you don’t just respond to issues. You improve the experience.
Learn more about RUM measurements here.