Introducing the Coralogix Transactions processor

Coralogix Transactions are a trace segmentation strategy, unique to the Coralogix platform. They allow users to analyze the performance, over time, of a collection of related spans, across billions of traces. Coralogix has introduced a transactions processor into the OpenTelemetry contrib image, enabling users to activate this unique feature using nothing more than OpenTelemetry configuration.
What is a transaction?
Coralogix Transactions are a segmentation strategy for Coralogix customers. To begin, we need to think about how our services actually work. Consider a payments API endpoint. When we think about this endpoint, it’s tempting to think about every stage in this endpoint as a single activity. In fact, this API endpoint is likely covering for a number of different tasks. These tasks together form all of the processing necessary to fulfil the API response.

However, it’s most likely that the /pay endpoint will be accessed by many different clients and services. This means that we have a challenge. We need to track a subset of related spans (called a segment), monitor their performance over time, and explore how they behave, regardless of the overall trace path. This is the problem that Coralogix Transactions solves.
Coralogix Transactions – Powered by OpenTelemetry
Coralogix has now introduced the Transaction processor to the OpenTelemetry contrib image, meaning Coralogix users can now enable this feature using pure OpenTelemetry configuration, for any language or platform, with no need for custom libraries or invasive instrumentation.
This means that Coralogix Transactions are also compatible with OTel auto-instrumentation.
Customers can install transactions by adding the processor into their OpenTelemetry config:
processors:
 ...
 groupbytrace/transactions:
   wait_duration: 5s
   num_traces: 1000
 coralogix:
   transactions:
     enabled: true
These two processors work together to form a high performance telemetry processing pipeline that can scale to enormous volumes. The groupbytrace processor will ensure that related spans in the same trace are processed at the same time. This minimizes the need for buffering or searching for spans over long time periods or large datasets. The coralogix processor enables transactions, which annotates spans with transaction data.
NOTE: For customers utilizing the Coralogix Complete Observability helm chart, this will be enabled by default and there is no YAML fatigue to deal with.
Which Coralogix features does this processor unlock?
Coralogix transactions underpin some key APM capabilities that take tracing and span analysis to the next level.
- Database Dependencies – Use transactions to understand the dependencies between your databases and their dependent transactions. Understand the scope of an outage, find out which transactions are issuing failing queries, or find out which transactions are taking up the most processing time on your DB server.
- API Dependencies – Explore the relationships between your services and 3rd party APIs. Capture weak links in your infrastructure, understand which particular process is slowing down your downstream APIs, or find out which transactions are consuming all the credits for your 3rd party API.
- Transaction Analysis – Comb through the transactions in your system, understanding how they perform over time and identify the root cause of any performance issues or error spikes. Replace manually combing through traces with a simple, sharp interface, that compresses billions of spans into simple, clean insights.
Transactions in action – Segmented trace analysis
Consider the following trace, visualised using our Coralogix trace explorer. This trace originates in our frontend application and communicates with our checkoutservice, where an error occurs. Within this error, we can see that the error occurs in the /Convert endpoint in the same service, and it is invoked by the /PlaceOrder endpoint.

By looking at this in the context of a trace, we are seeing what went wrong in one specific instance. The problem is that we’ve got thousands of such requests. Using DataPrime, we can actually find out how many we have received:
filter $l.operationName == 'oteldemo.CurrencyService/Convert'
| count into invoke_count
When we run this, we can see ~246,000 invocations of the Convert endpoint, but in doing this, we don’t know a few key things:
- Which operation was upstream from this? Was it invoked along the same path as the trace we were investigating?
- Are all of these errors? If they are, are all of these the same errors? Does the error vary over time and we’re missing some if we filter too much?
We can try to go line by line, but realistically, we’re not going to be able to analyse more than a few before time constraints and the preservation of our sanity end the investigation early. This is not a good basis for engineering decisions.
Instead, we use Transactions
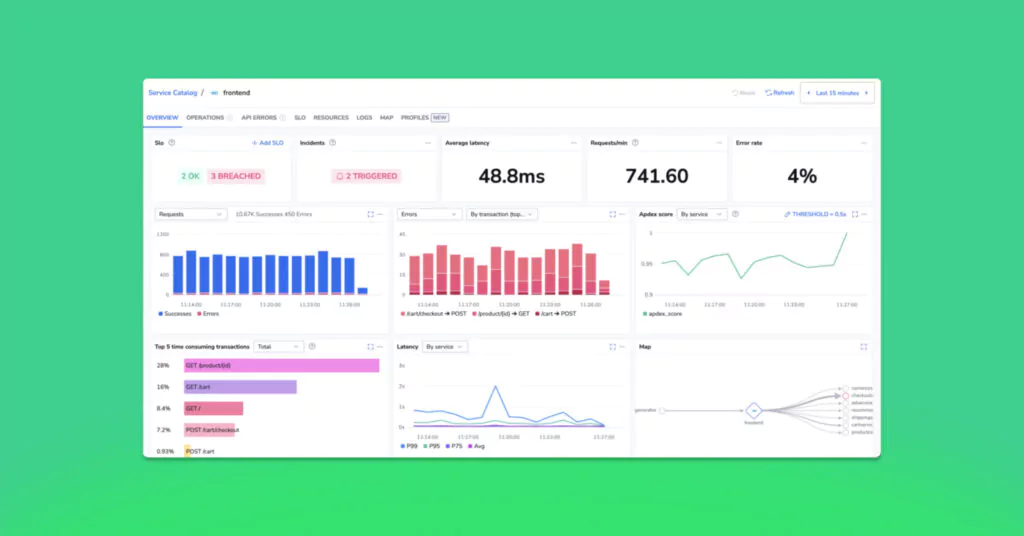
Transactions allow us to look at the specific spans related to our /PlaceOrder endpoint, and most importantly, it allows us to explore the behaviour of the /Convert endpoint over time. Within the Coralogix Service Catalog, we select the service we want, in this case it’s the checkoutservice.

There are some clear causes for concern – every single request is failing with some error. We’ll switch over to the Transactions tab, to explore further. This gives us a view of all of the Transactions that originate from the given service. This is perfect for us, since we’ve used the APM tools to narrow down the root of the issue. When we open the Transaction for our /PlaceOrder endpoint, we get a great breakdown of everything that this particular transaction is doing. In other words, we’re looking at the segments that make up the entire flow of the /PlaceOrder endpoint.

Now, we can see the root cause of every error within the timeframe. Rather than trying to guess what keeps causing the issues in our /PlaceOrder, we can see that our Convert segment is failing every time, but it is only a small part of the problem. Analyzing this transaction also reveals something we weren’t even looking for, a huge spike in latency.

Notice that on the left, overall throughput did not increase, in fact it fell sharply, but the total response time (the sum of the time spent processing) increased sharply. This does not correlate with the errors, but is clearly pertinent to our investigation. We would never have surfaced this by going line by line in our traces. Only through transaction analysis would we have discovered this issue before a customer did.
Exploring the root cause of this slowdown can be done visually, by selecting our PlaceOrder segment in the table. This gives us a breakdown of every operation and how long it took,

By abandoning exhaustive investigation through millions of spans, or guesswork based on a tiny sample, and instead focusing on data-driven analysis of transactions, we’ve begun investigating an error, and discovered not only the source of the error, but also a performance problem that we weren’t even aware of.
How do I get started?
The Coralogix documentation explains clearly how to install, whether you’re an existing customer, you have an existing OpenTelemetry collector, or you’re just starting out and need to go step by step. If you’d like to speak with our sales team, get in touch via our demo form.
Coralogix Transactions are a new level of trace analysis that transforms millions of disparate datapoints into an intuitive user interface that will surface performance issues, identify problems and give your engineering teams the information they need to bring your systems to the next level.