Advanced SLO Alerting: Tracking burn rate

Service Level Objectives (SLOs) are a cornerstone of modern software engineering. Defining alerts around SLOs has become standard practice, but many of the common patterns in use today miss the early signals that can tell a customer before an SLO breach has occurred.
A quick primer – what are SLOs?
Before SLOs, teams were often given simple but unhelpful targets, like maintaining 100% uptime. Teams found that they were never functioning for 100% of the time. These metrics drove undesirable behaviours, like fear to deploy or over-testing, greatly slowing release cadences. Organizations needed a way for teams to have realistic uptime goals that didn’t discourage experimentation.
SLOs are made up of a few simple components, that tackle this:
- A time window, for example 30 days, in which to measure activity.
- An error budget, for example, 0.1% of requests can have an error over a 30 day period.
- Service level indicators (SLIs), which are the true metrics that we wish to track. For example, we may wish to track the API response time, and ensure that 99.9% of requests from our API respond in under 500ms, over a 30 day period.
Our SLIs combine into a picture of our overall compliance with our SLO, within a given period of time. If a team has used very little of their error budget, they may wish to experiment more. If they have used almost all of their error budget, they may wish to experiment less and focus on testing. SLOs allow teams to make autonomous decisions that don’t endanger overall user experience.
Why do we define alerts on our SLOs?
Put simply, like any important metric, we do not want to rely on checking a dashboard to understand if a value has crossed a threshold. It’s much more efficient to have the system inform us when we’re at risk of breaching our SLO. Alerting enables us to focus on what matters and rely on our alerts to wake us up if something goes wrong.
How do we take SLO alerting strategies to the next level?
It is very common to define an alert that operates on a threshold, for example: “Trigger this alert when my error budget is below 30%”. This is useful to inform engineers of an in-progress outage or ongoing emergency, but where many of our systems have become more predictive in their alerting, SLO alerting has remained static. So what is the alternative?
Coralogix SLO Alerts – Burn Rate
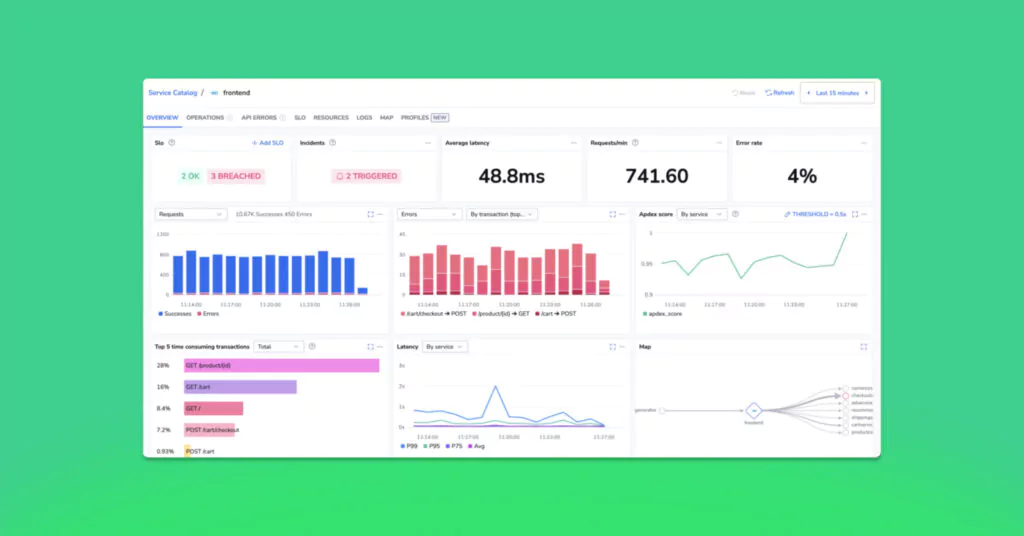
Coralogix offers, in conjunction with a comprehensive SLO center that enables customers to define SLOs on any metric, a specialised SLO alert, that gives customers the option to build alerts using two different approaches.
- Error budget – Error budget alerts trigger when the remaining error budget percentage is equal to or below a defined threshold – i.e Error budget is below 20%
- Burn rate – Triggers when the SLO error budget is being consumed faster than an expected rate.
In other words, a complete SLO monitoring strategy requires two different types of alerts, proactive and reactive. Proactive alerts provide an early warning signal to inform operators that some negative behaviour is occurring, well before it has negatively impacted the SLO budget. Reactive alerts add new information by giving an increasing scale of severity, to help operators understand the priority of the issue they’re facing.
So when should you use a burn rate alert?
In general, there are some simple guides you can use when deciding whether to implement a burn rate alert vs an error budget alert.
Use Burn Rate Alerts when:
- You need early detection of spikes, even if the total budget is still mostly unused. For example, 5% of the budget used in 30 minutes could indicate a major outage in progress.
- You want to catch fast regressions before they deplete the budget. This is great for proactive response before end users are significantly impacted.
- You care about high-frequency monitoring using rolling windows (e.g., every 5 min, 1 hour).
Use Error Budget Alerts when:
- You care about cumulative risk over the full SLO window. For example: “I want to know if we’ve used 90% of our error budget, regardless of how fast.”
- You want to track slow-drip issues that may not spike but could cause a breach over time, like gradual error accumulation that may go unnoticed in burn rate windows.
- You’re making go/no-go decisions (e.g., feature rollouts, compliance reports). For example, you may decide that if 95% of the error budget has been used, non-essential changes must halt.
- You wish to change team collaboration models when the error budgets run low, for example ensuring that during the daily stand up, teams are reflecting on the error budget and how they might contain further burn.
How do burn rate alerts work in Coralogix?
Burn rate alerts have many configurable options. We expand all of these in our documentation, so we’ll focus on a simple example of how the burn rate alerts triggers. Let’s consider the following burn rate over a fixed period of time:
We can see that the error budget is slowly reducing. We can assume this is our baseline. So, our error budget is consuming data at a known rate, but then, we see a sudden drop in our available error budget:
What began as a steady decline over time (possibly due to common background API errors) has suddenly become a rapid drop, however all error budgets are still quite high. If we only have a threshold based alert, then we may trigger something like a low priority alert, indicating that the error budget is close to or below 50%.
This misses the full picture. It is not the absolute error budget that is concerning, but the sudden rate of change of the error budget. This rate of change, known as the burn rate, gives operators the power to predict the direction of travel for their error budgets, and do something about it early.
A burn rate of greater than 5 indicates a faster than usual rate at which error budget is consumed for a given SLO. We can directly define this when we build our SLO alerts in Coralogix:
With this, Coralogix users are able to get ahead of SLO impacting issues, and subsequently ensure that their team remains within their error budgets and delivers an outstanding quality of service to their customers.
But aren’t proactive alerts sometimes noisy?
Predictive or proactive analytics can be noisy, because sometimes the signals that correlate with an issue don’t always result in an issue. An API could have a sudden spike in errors, but the change is immediately rolled back, so the problem does not escalate.
In these situations, something significant has happened and so an alert should trigger, but when the danger passes (i.e the version is rolled back and errors stop), the alert should also resolve. This means that when alerts are triggering, the operator knows with certainty that this is an ongoing issue.
Dual-window alerting reduces noise in proactive alerts
Error budget based SLOs include a time range by definition. Consider the following SLO: 99.9% of requests must complete without error in a 30 day period. If we define an alarm that triggers if the error budget use exceeds 90%, then we are running our alert over a 30 day period.
For burn rate alarms, we are not necessarily tracking the entire SLO time period. More commonly, we track a shorter time range. For example, if burn rate is 3x normal within a one hour time period, trigger an alarm. So what if we get a sudden 5 minute spike of errors, and then they stop?
In the following graph, we can see an enormous spike for only a few seconds in errors. If we define an alert within a one hour time period, the alert may remain active for up to an hour, depending on the size of the spike. This means that the issue has resolved itself, but the alert is still demanding the attention of an operator. To put this into perspective, the highlighted area in red indicates the time for which the alert may remain active.
To overcome this, we need to add a second, shorter window. For an alert to trigger and remain active, both windows must still match the condition of the alert. If we define a second window that is set to 5 minutes, it effectively means that every five minutes, the alert is constantly evaluating itself to see if the condition is still true.
In practice, this breaks up the 1 hour time window into lots of smaller 5 minute time windows. The longer, 1 hour window helps to ensure that the spike is significant, since 5 minute windows will vary wildly and it will be difficult to establish a baseline. The 5 minute window helps to ensure that the issue is still happening.
Now, the lifecycle of the alert matches with the lifecycle of the problem. Operators know that if they’re looking at an active alert, it represents an active issue. This unlocks proactive SLO alerting while allowing users to compensate for potential noise, or fluctuations in errors that don’t have a consequential impact to SLOs or user experience.
Define a complete SLO alerting strategy
Coralogix is a platform that is designed to do more than tell you when something is going wrong. Our mission is to help engineers do the best work that they possibly can, and to help businesses make better decisions.
SLOs are a core part of that mission, by giving engineers a framework within which they can make high quality, autonomous decisions that enshrine continued quality of service, without taking focus away from the crucial experimentation, learning and testing that high performing teams need to thrive.


