Coralogix adds OTel-based service dependency tracking for distributed systems

Coralogix has released its APM Dependencies feature. This feature automatically surfaces and maps the relationships within and between your software and external services. It allows fine grained tracking of which endpoints within your APIs, depend on other endpoints, or external services and database tables.
Why is dependency tracking so important?
Our software is an interconnected network of services, some within our control, and others beyond it. For example, an external payments API, or the AWS S3 API for storage. Over time, these external services have become integral to the operational health of our systems. Without dedicated observability, an external failure, like a misconfigured database, could have widespread impact before a root cause has been identified.
Coralogix Dependencies allows customers to track the communications with both internal and external services, and understand which endpoints depend on which other endpoints. This allows operators to deeply understand the flow of a particular transaction through a system, reducing investigation time and accelerating time to recovery.
How does it work?
Coralogix already builds a detailed picture of the connections between services, with granularity that permits users to explore each event, span by span, to find the patterns that represent a growing outage. Now, Coralogix automatically highlights those connections that link between our services, databases or external APIs. By leveraging OpenTelemetry, these insights are created using a simple plugin, giving customers the freedom to keep their code clean, without sacrificing on performance or feature availability.
Coralogix is underpinned by its remarkable Streama© Architecture. The Streama© engine allows customers to ingest huge volumes of data and perform analyses without relying on traditional indexing. In real terms, this means customers can ingest up to 10x the volume of OpenTelemetry spans for the same price. When coupled with tail sampling and span metrics, Coralogix users are able to build unrivalled production intelligence, and remove gaps in their observability.
Dependencies in Action – Tracking APIs impacted by a common database
A use case that frequently recurs in modern, stateful infrastructures is the distributed impact of a failing database. We often don’t find out about the database failure first. Most likely, its dependent APIs begin to slow down or error, and our investigation begins there.
Tracking this down to the database can take precious minutes, and then the work is still ahead of you – identifying the rogue query or understanding which code paths are impacted in a service are more complex, and require deeper analysis. This is the exact problem that Coralogix Dependencies were built to solve.
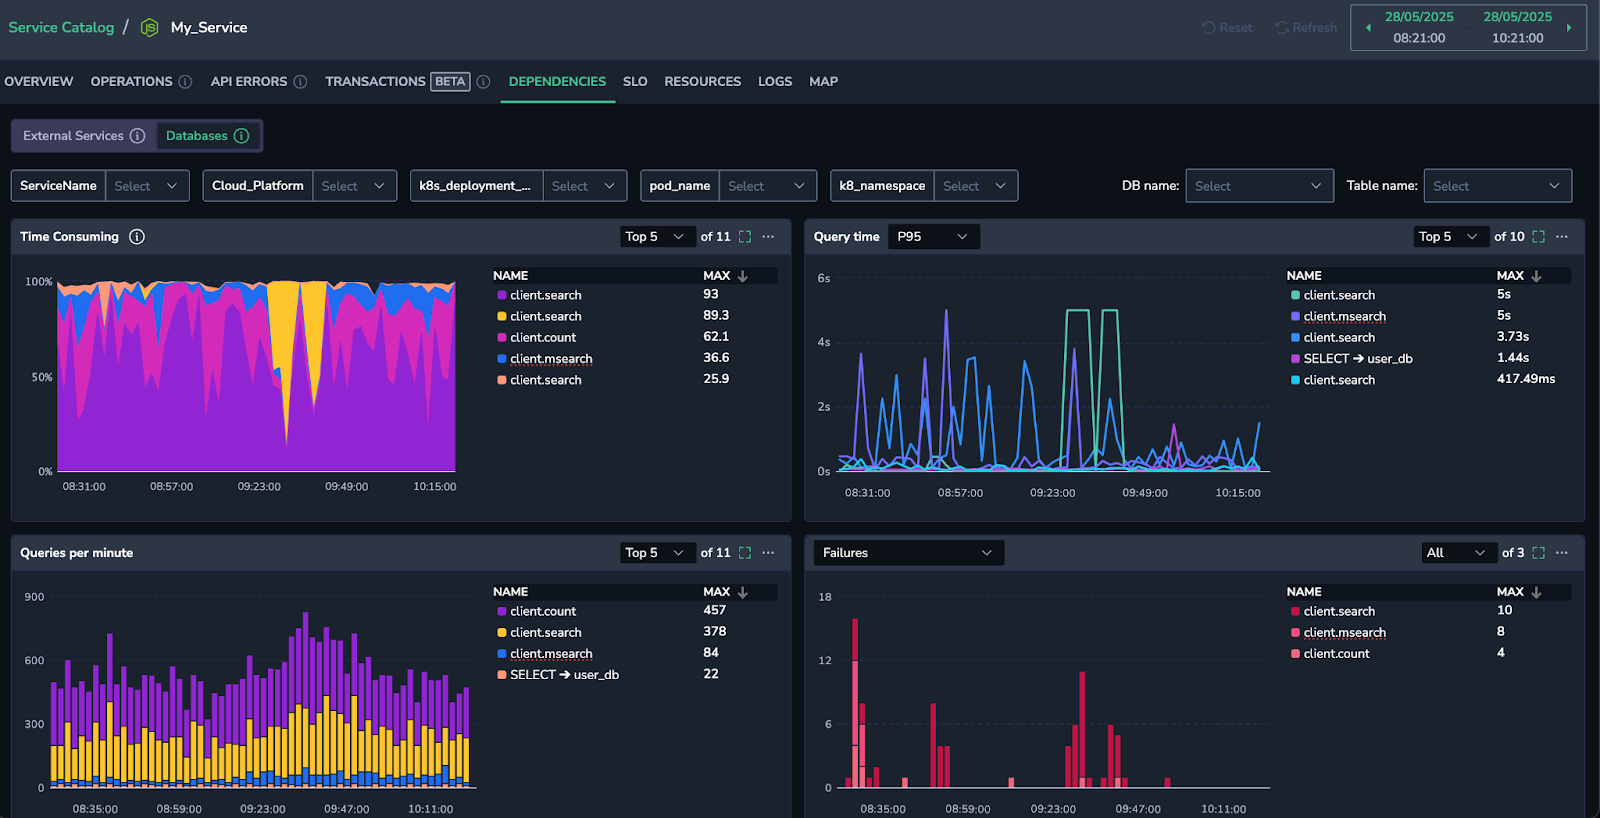
When exploring the dependencies view for our API, we immediately see insights that lead us to the root of the problem. On the Database overview page, we get a breakdown of activities, and immediately, we can see a latency spike in a specific query type. This overview tells us what is going wrong, but Dependencies excel at going deeper. We now know that an issue with the database is impacting the API, but databases can be part of multiple transactions, by multiple APIs in many different services.
This view is valuable because it highlights the dependencies of a single service across all the databases it interacts with. On this screen, you’ve pinpointed the database call, the target database, and the specific table involved.
In the screen below, you’ll identify the particular root transaction, among all transactions of the service, that is most affected or contributing most significantly to the issue.
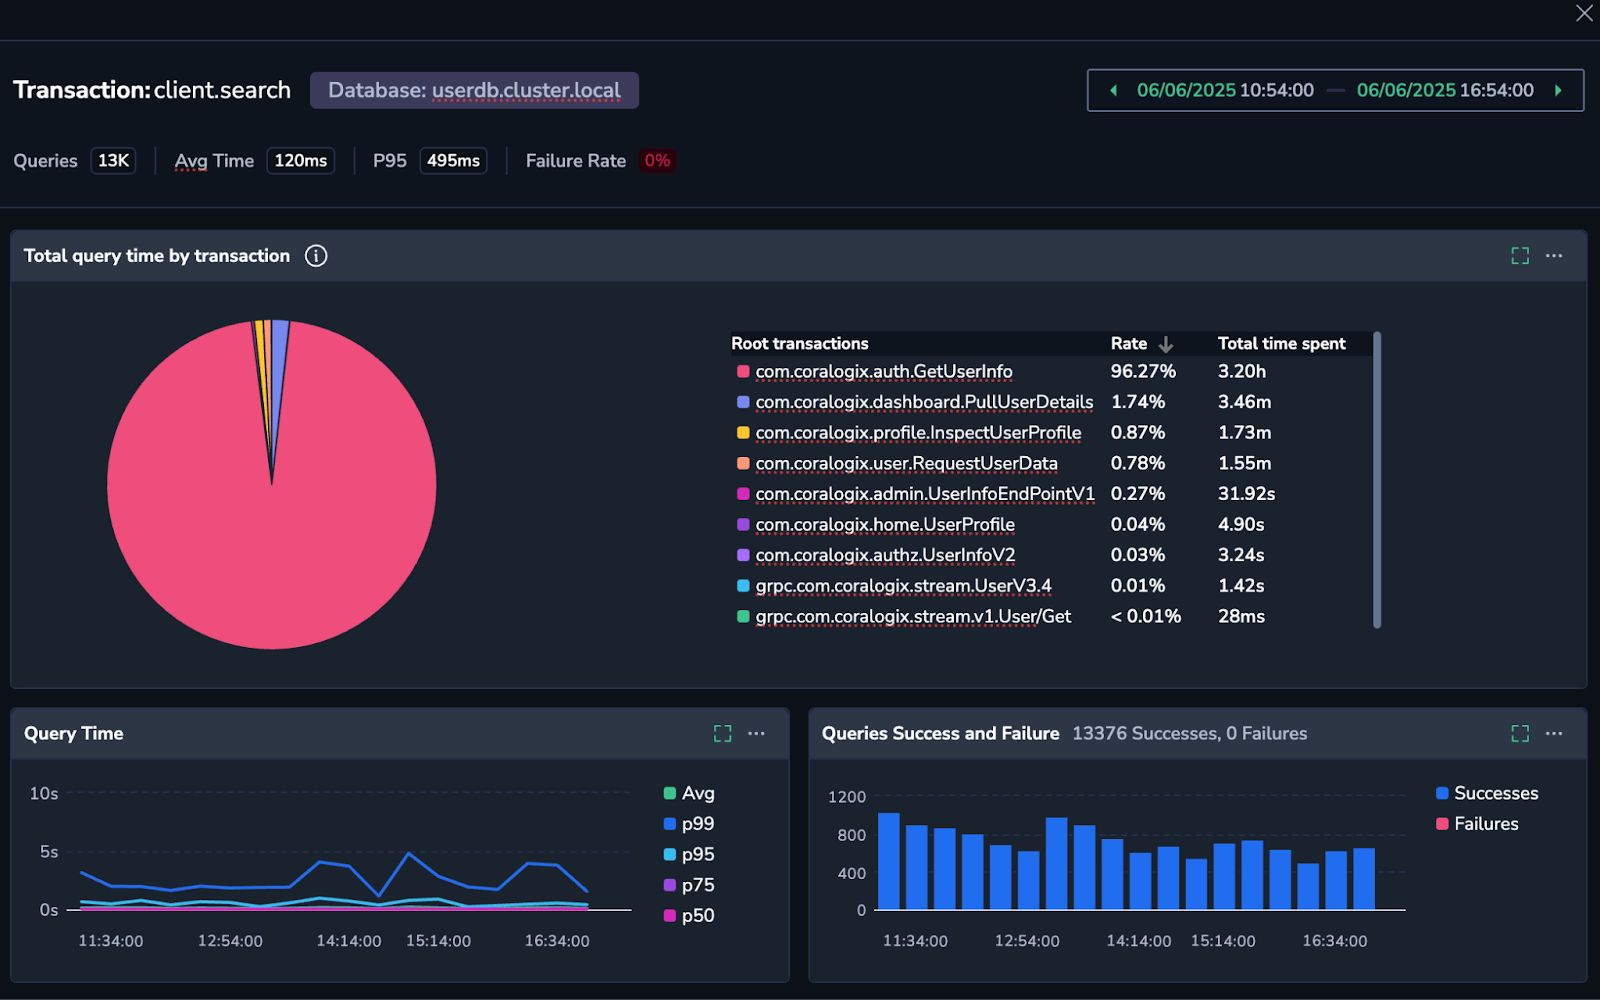
By exploring the failing client.search request, we can see every single API that depends on this. From here, we can see every endpoint within the service that may be impacted, with the com.coralogix.auth.GetUserInfo API being impacted most heavily, since it makes up 96.7% of the invocation time for this database.
Tracking the root of the invocation
This is not the request adjacent to the database, for example the specific line of code that invoked the query. This is the root API call for each service. For example, com.coralogix.auth.GetUserInfo might have done a lot of processing before invoking the database, but we still see the root of the request anyway. This is extremely important. It allows us to see which API is being impacted, or which overall function is being delayed. This eliminates the need to manually walk through hundreds or thousands of trace views to understand the code paths, and instead visualises the business impact.
Dependencies in Action – Troubleshooting SaaS API Issues
Modern software architectures are a combination of custom built software, licensed software running internally and SaaS solutions. A notoriously complex observability challenge is tracking the ongoing health of an external API. This is difficult for a number of reasons:
- The API doesn’t always expose the data that we need.
- We do not control error or failure modes of an external solution, meaning failures can sometimes happen quietly.
- There may be a pattern to the failures that it is difficult for us to track, because we can’t see inside the solution.
Coralogix Dependencies excel at revealing issues with external APIs. When services begin reporting issues, such as increased latency or an anomalous error rate, users are able to view all of the dependencies of this service to quickly isolate the failing component.
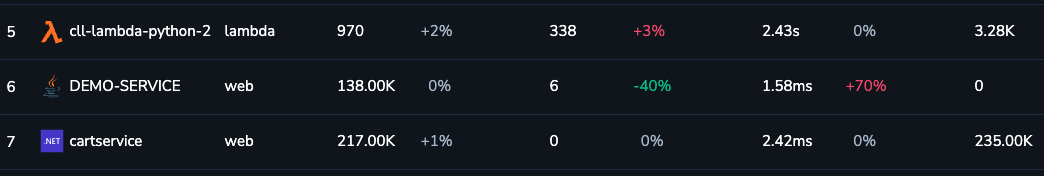
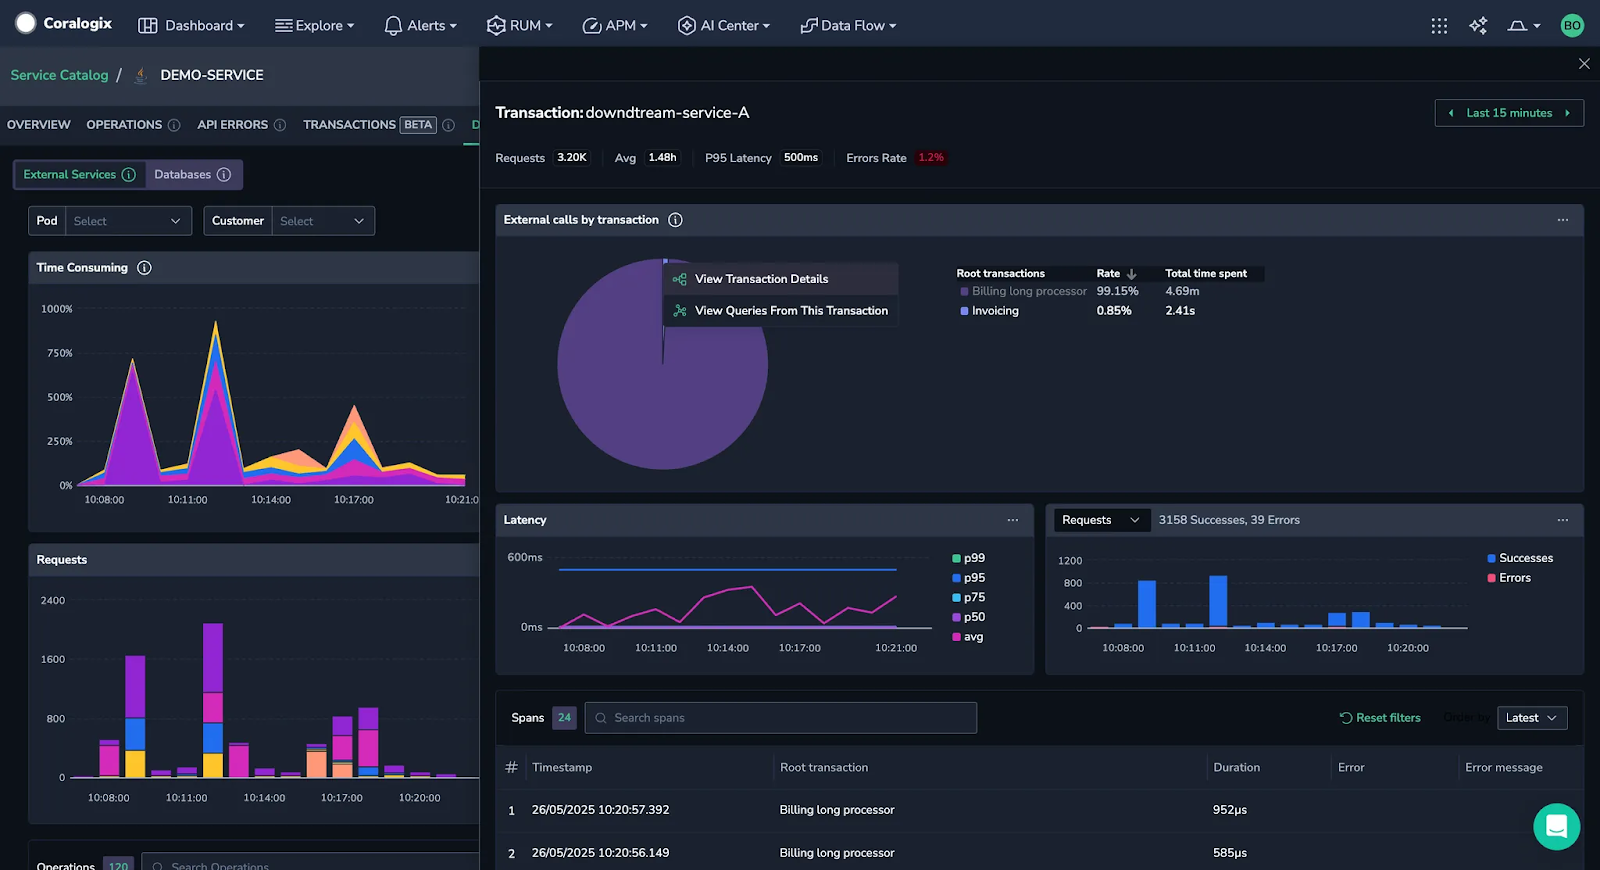
We can see that our demo service has an increased latency compared to yesterday. This can be for a number of reasons. The Coralogix APM Service Catalog gives a great high level indication, but it’s time to drill deeper. Dependencies give us an instant view of the root cause. We can not only see that an external service is causing us trouble, but we can understand which specific call is impacting the performance of our application (downstream-service-A in this example) and which business transaction within the service is using the most this call (the ‘Billing processor’ in the following example).
These use cases highlight the power of dependency tracking in modern observability, and how a solid understanding of the dependencies within a distributed architecture can accelerate MTTR, and turn lengthy investigations into a few simple clicks.
To find out more, you can check out the documentation, or reach out to our team today for a demo, to understand how transaction analysis, and dependency mapping, can elevate your APM stack.