Don’t count integrations, count dashboards and alerts

Vendors often compete by saying how many extensions or quick start packs they have. The implicit promise is: more integrations equals better observability. But that misses the point. What really matters is the quality and coverage of dashboards and alerts that you actually use to maintain system health, prevent outages and improve user experience.
At Coralogix we believe that what you do with integrations is far more important than how many you have.
Why “more packages” can be misleading
It’s easy to rack up numbers. A vendor can claim dozens of integrations, many quick start packs or extension bundles. But often those packs:
- include generic dashboards that don’t reflect real environments
- generate only a small number of alerts, many of which are noisy or irrelevant
- leave gaps across logs, metrics, traces, or miss mobile and web UX signals
So while the numbers look impressive, you still spend weeks customizing, filling gaps, and tuning thresholds. That delay means slower detection of issues, delayed fixes, and in the case of gaming or consumer apps, immediate churn.
What customers actually need
Dashboards and alerts are what give observability its value. The right coverage delivers:
- Retention and reliability. Players or users churn instantly when they encounter friction. Monitoring and high-quality alerts are the first line of defense.
- Real observability coverage. It is not enough to know a service is up. You need to see what users see, from front end to backend, with mobile session replay, error tracking, CPU and memory usage, network latency, and custom flows.yea
- Low overhead. Dashboards should be relevant and alerts should be actionable, not noise.
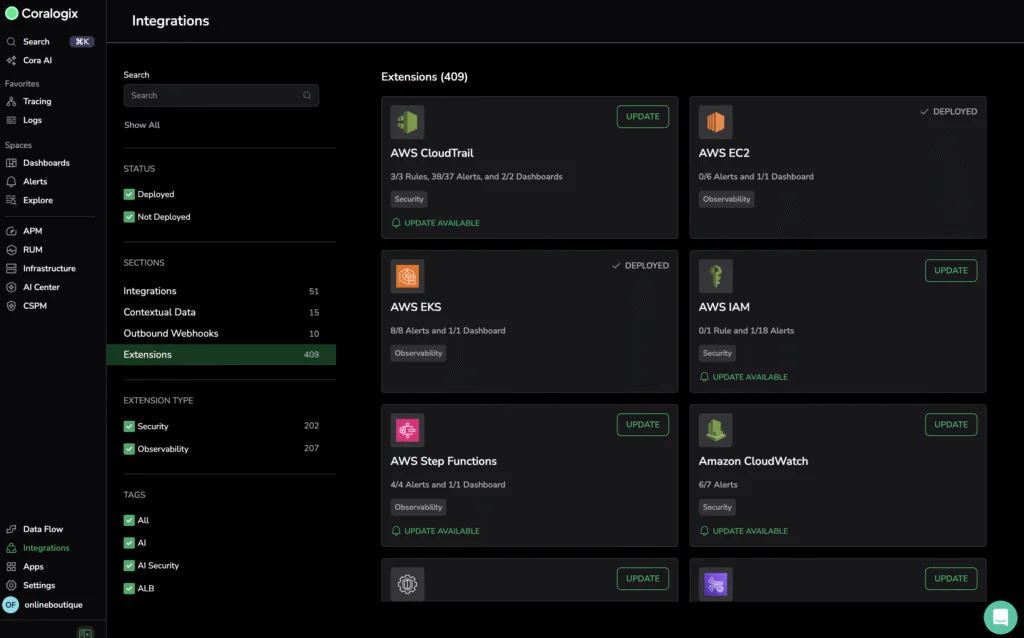
The Coralogix approach: quick start packs that deliver value
Coralogix offers quick start packs too, but they are built differently. Each one contains multiple dashboards and many alert rules designed for production use. They are not shallow wrappers; they are full, usable resources that cover logs, metrics and traces from day one.
These packs include advanced features like iOS and Android session replay, error templating, CPU and memory monitoring, network latency tracking, version comparisons, and custom user flows.
Quantifying coverage (and comparing to competitors)
Here is what Coralogix provides:
- More than 4,400+ production-grade dashboards and alerts (as of October 16th 2025)
- End-to-end coverage across logs, metrics, traces, and mobile and web UX
- A proactive team building and improving packs as new technologies emerge
Datadog: 629 dashboards, 846 alerts*
New Relic: 453 dashboards, 506 alerts*
This makes the gap clear. Coralogix isn’t just counting packs. We are delivering resources that matter.
The bottom line
Integrations and packages are not the outcome. Dashboards and alerts are. They are what show you what matters and let you act before things break.
With Coralogix, customers don’t just get integrations. They get real dashboards, meaningful alerts, and end-to-end coverage from the moment data arrives.
*As of date of publication, is subject to change over time