Olly for SREs: 3 ways I actually use it in production

A practical breakdown of how I use an autonomous AI agent to investigate production incidents.
There’s a moment after an alert where you’re not fixing anything yet. You’re trying to answer a much simpler question: Is it actually down?
Sometimes it’s obvious. Sometimes it’s 20 alerts at once with no clear starting point. Sometimes it’s a small upstream degradation that might cascade. Sometimes it’s just a spike that resolves on its own.
That first phase is orientation. Is the signal real or transient? Is it isolated or spreading? Root cause or symptom? Those first 10–15 minutes shape the entire incident.
For me, that’s where using an autonomous agent actually made a difference, because it shortens the time it takes to get from scattered signals to a working understanding of the problem. Olly evaluates logs, metrics, traces, alert context, and code together and returns a structured summary of what happened and leads me to the root cause within minutes.
I recently got a checkout error spike alert, which was flagged by someone in my org because we were getting slammed with customer complaints.
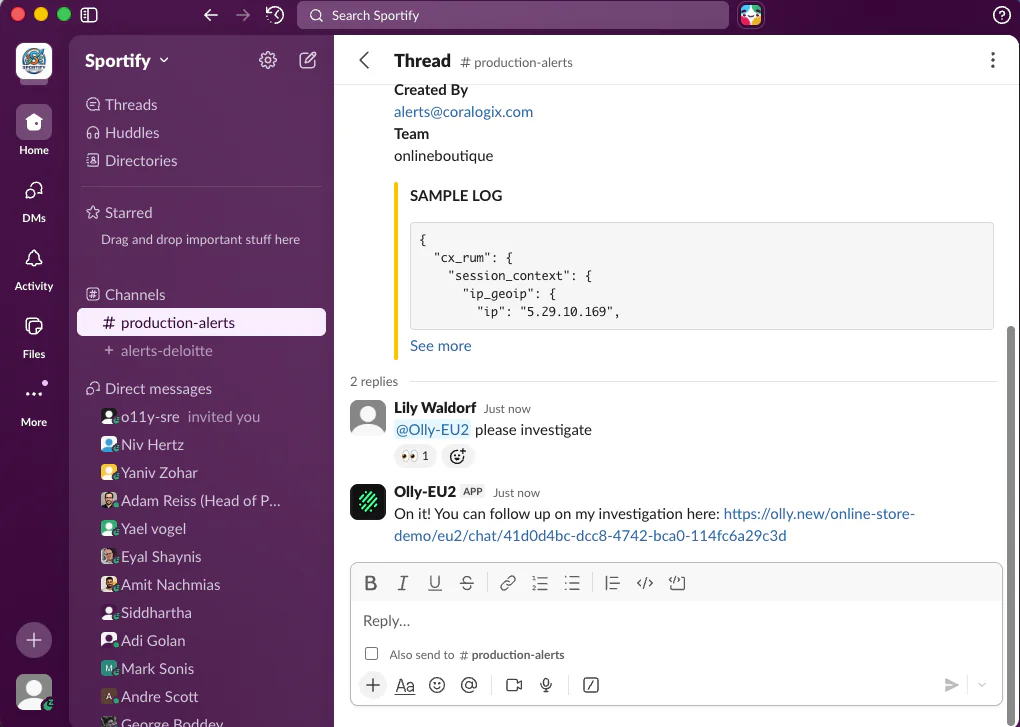
I told Olly to investigate directly in Slack, and from there Olly ran the investigation end-to-end. Let’s check it out.
1. Identifying the primary driver
Most incidents don’t show up as one clean alert. Within minutes, I’m also evaluating other signals like error rates, latency, saturation, and dependencies. Everything is red, but not everything is related.
The challenge here is understanding the sequence:
- Did the error rate increase first?
- Did latency degrade before saturation?
- Did dependency slow down before our service did?
That order matters. The earliest deviation from baseline is usually closer to the root.
Before, I’d manually reconstruct timelines, adjust time windows across dashboards, compare graphs, and try to figure out which signal led and which ones followed.
Now I’ll ask, “What changed in the system around the time this alert fired?” or “Which signal deviated first?”
In the case of my alert, Olly started by querying checkout failure metrics and immediately detected a significant spike in the last two hours. That establishes temporal deviation before any deep dive.
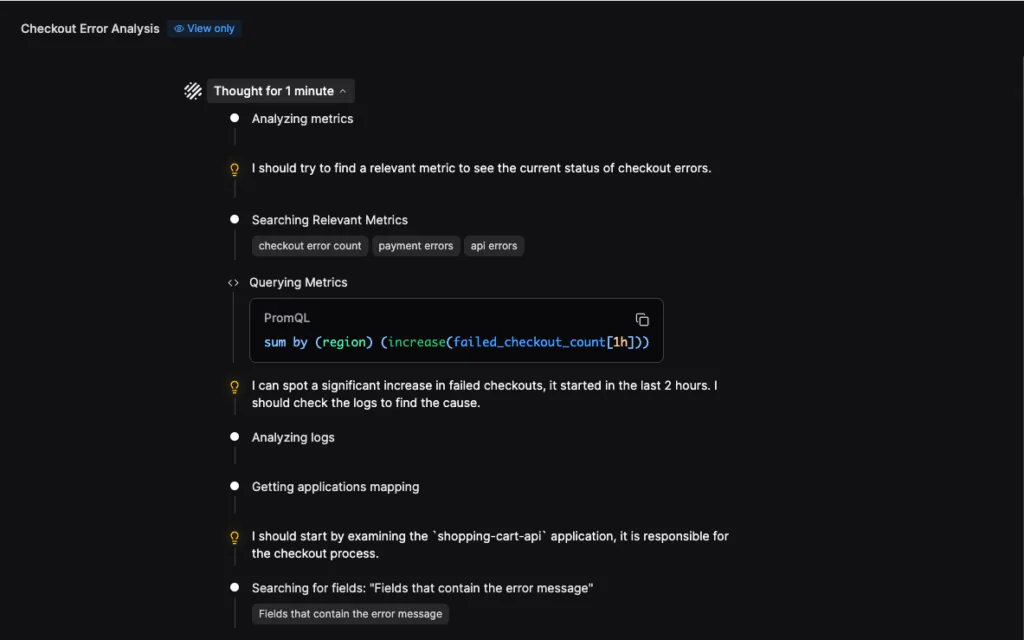
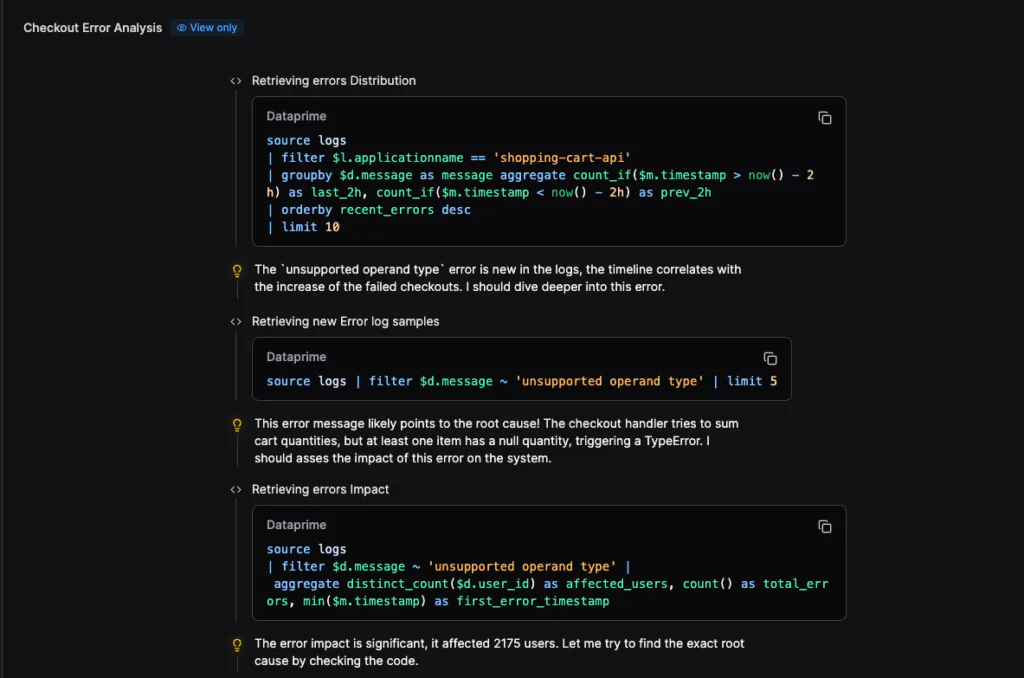
It then pivoted to logs, aggregating error messages and comparing the last two hours to the previous two-hour window. The unsuppor40ted operand type error was new and temporally aligned with the metric spike. That correlation narrowed the search space immediately.
It showed whether I was looking at a local regression or a downstream effect. For the record, I still validate it on my own, but instead of manually creating a timeline, I start with one that’s already synthesized.
2. Defining the failure boundary
Once I understand what changed, the next question is ownership. Is this service the origin?
Or is it absorbing impact from somewhere else?
An alert attached to one service doesn’t mean that service caused the issue. It may just be the first place where degradation became visible.
In this phase, I’ll ask:
“Is this service the origin of the degradation?”
“Are upstream dependencies showing correlated latency or errors?”
“Is impact propagating downstream?”
Olly reasons across service boundaries instead of staying confined to a single view. It correlates traces, metrics, and logs to show whether degradation appears localized or systemic.
In my investigation, Olly quantified impact, counting distinct affected users and total errors. That immediately tells me whether I’m looking at localized noise or a user-facing event requiring escalation.
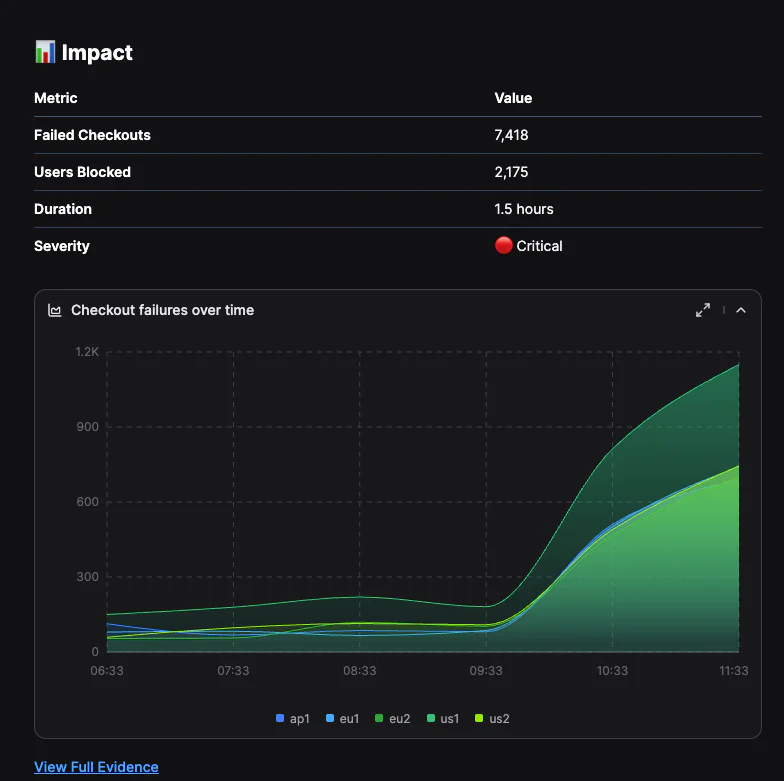
The chart plots failed checkouts over time by region. The inflection point aligns with the appearance of the TypeError in logs, and the sustained increase across regions confirms this wasn’t an isolated node or transient spike.
That boundary definition changes escalation immediately. If it’s upstream, I escalate there.
If it’s contained, I keep the scope tight. If multiple services degrade simultaneously, I widen the lens.
Pro tip: User rules make a big difference here. Configuring them significantly improved my results. Some of my user rules are:
- Restricting investigations to production data by default
- Clarifying how we label internal vs external services
- Defining naming conventions for critical systems
The more clearly I define my production context, the more precise the investigation becomes.
3. Testing and confirming root cause
By this point, I usually have a working theory. Now I move to structured hypothesis testing. The problem is that most of these explanations can look convincing in isolation. A spike on a graph, a recent deployment, or a threshold crossing may look suspicious, but none of those on their own establish causation.
This is where my investigation can slow down. I’ll start jumping between systems trying to confirm or eliminate each possibility.
Now, instead of vaguely asking, “What’s wrong?” I’ll ask Olly:
“Was there a deployment before this alert was fired?”
“Is resource saturation correlated with the error increase?”
“Did this behavior exist in the previous release?”
“Has this pattern occurred before?”
Olly runs a multi-step analysis and returns evidence tied to each hypothesis: what changed, when it changed, and which signals support or contradict it.
In this example, the investigation moved from metrics to logs to code. The failure was traced to a TypeError in the checkout function attempting to sum a cart value that included None. That aligned exactly with the spike in failed checkouts.


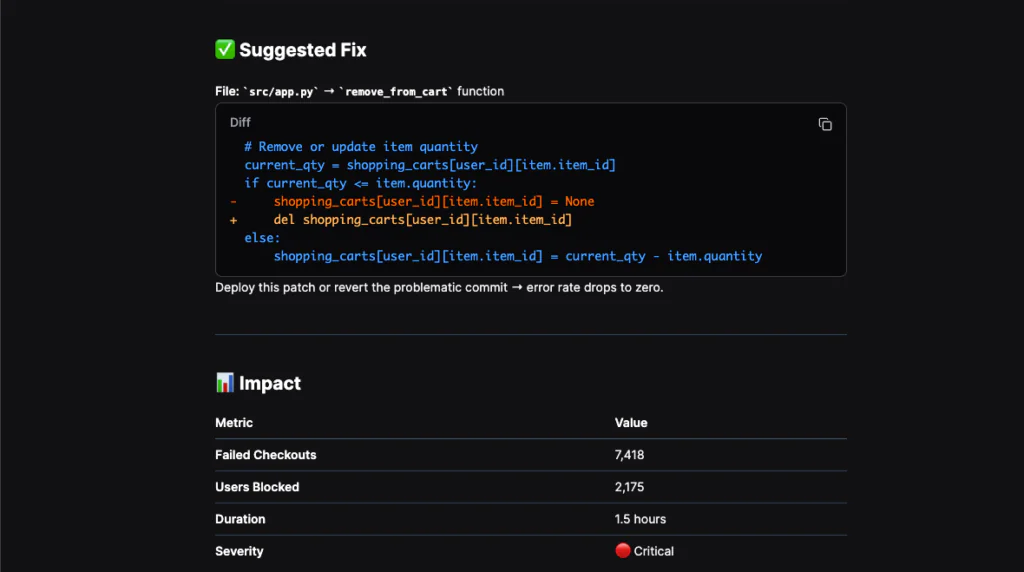
Olly also surfaced the problematic commit and suggested a concrete fix in the remove_from_cart function.
As I previously mentioned, still validate everything. But instead of bouncing between systems to test one theory at a time, I move through hypotheses methodically. That shortens the middle phase of investigation significantly.
Circling back: This is where I’ll deliberately use Focus mode. Deeper analysis and broader historical context matter more here than speed.
Focus mode expands the time horizon and runs heavier reasoning. It’s especially useful with events like the alert window not fully explaining the degradation, the issue looking gradual rather than abrupt, or me having a suspicion of recurrence.
How Olly gives me 15 min of my life back
An alert will always require judgment. No system replaces that. The trajectory of the response is defined by how quickly I can:
- Confirm it’s real
- Identify the primary driver
- Define the failure boundary
- Test the most likely cause
Olly doesn’t eliminate those steps. It compresses them.
And in production, the difference between 5 minutes of structured clarity and 20 minutes of scattered exploration is the difference between controlled escalation and unnecessary churn.