Troubleshooting & RCA with Olly

If troubleshooting still feels harder than it should, check on these two numbers: how many dashboards you have, and how many alerts fire every day. For most teams, it’s hundreds of dashboards and thousands of alerts, a sign of maturity, coverage, and good intentions.
On the other hand, we also see that when something actually breaks, that coverage rarely turns into clarity fast enough. An alert fires, latency spikes, users complain, and instead of confidence, teams hesitate: which dashboard matters? When did this actually start? Is this a cause or just a symptom? We have more telemetry than ever, yet incidents still start with guessing.
Observability doesn’t fall short because teams did the wrong things. They added logs, metrics, traces, and alerts exactly as prescribed, but systems became more distributed while the workflow stayed manual.
At the same time, expectations shifted. Everywhere else, people ask questions in plain language and get answers in seconds, so when teams still spend 30 to 60 minutes just orienting themselves during an incident, something feels off.
That gap is why “AI in observability” often disappoints. Most tools add helpers that summarize dashboards or write queries, but they don’t change the work itself or meaningfully reduce MTTR. The human is still responsible for deciding where to look and what matters.
Your AI agent can help, but without autonomy it just accelerates the same guessing game. An AI system is only as effective as the data it can see and explore. If it’s limited to pre-defined schemas, short retention windows, or partial indexes, it becomes another assistant waiting for instructions and context.
For AI to genuinely change troubleshooting, it needs two things:
- Full, unrestricted access to telemetry
- The ability to investigate independently, not just respond
From this, we understand that the underlying observability platform matters far more than people realize, as it dictates the quality and quantity of data that we can feed our agents.
The Platform that makes real RCA possible
Coralogix was built with a different assumption: that observability shouldn’t depend on guessing ahead of time which data you’ll need.
Instead of forcing teams to index selectively or drop context, Coralogix keeps full-fidelity telemetry in the customer’s own cloud storage, meaning unlimited retention and unified access across logs, metrics, traces, and security events. There’s no artificial separation between “hot” and “cold” data from an investigation perspective.
Why does this matter for troubleshooting?
Root cause analysis depends on history. Not just what changed in the last five minutes, but what’s normal, what’s recurring, and what only looks unusual when you zoom out.
We’re back to the future, where more data actually means more success. Not because humans want to sift through it, but because AI can. Historical baselines, long-term patterns, and “this has happened before” moments are exactly what machines are good at recognizing. The more history you have, the more accurately you can tell the difference between a real anomaly and normal system behavior.
This architecture turns AI from a surface-level feature into something much more powerful: a system that can see everything, connect anything, and reason across time.
That’s why long retention and full-fidelity data aren’t nice-to-haves for AI-driven RCA. They’re prerequisites. Without history, AI can only react. With history, it can reason.
That foundation is what Olly is built on.
Observability 🤝 Olly
Olly is not an AI assistant embedded into observability tooling. It’s an autonomous AI observability agent.
Instead of asking you which dashboard to open or which service to check, Olly takes responsibility for the investigation itself. You ask a question, and Olly decides what steps to take, which signals to analyze, and how to connect them.
Behind the scenes, Olly correlates logs, metrics, traces, and alerts, builds hypotheses, validates them against historical data, and presents conclusions in clear, human language. It also shows its reasoning and evidence, so teams can trust and verify what it finds.
That transparency is important, because not all “AI for observability” works this way.
Many AI agents in the observability space claim to do root cause analysis, but in practice they still depend heavily on humans to provide context. Engineers have to point the agent to the right dashboards, manually add data sources, refine prompts, or rephrase questions until the system has enough information to respond. The investigation only progresses if the user already knows where to look.
In those workflows, the AI isn’t really investigating. It’s assisting.
Olly works differently. It doesn’t wait for context to be fed to it. It runs on a unified observability platform with full historical access, so it already understands the shape of your systems, the relationships between services, and what “normal” looks like over time. When a question comes in, Olly decides which signals matter, where to dig deeper, and how to connect the dots, without requiring continuous prompting or manual setup.
This is the difference between an AI that helps you navigate observability and an AI that actually does the work of investigation.
It’s worth noting that Olly also changes who can participate in troubleshooting. You no longer need deep platform knowledge to ask meaningful questions. Engineers, product managers, support teams, and even business stakeholders can engage directly with production data.
Let’s look at how this changes real troubleshooting scenarios.
How Olly changes root cause analysis in practice
Investigating latency and performance issues
Latency issues are a perfect example of where traditional observability struggles because they are rarely as simple as they look.
A latency alert fires, but latency is rarely the root cause. It’s the outcome of something else: resource contention, upstream failures, traffic changes, or a subtle dependency issue that started hours earlier.
With Olly, the investigation doesn’t start with dashboards. It starts with a question:
“Why is my latency so high today?”
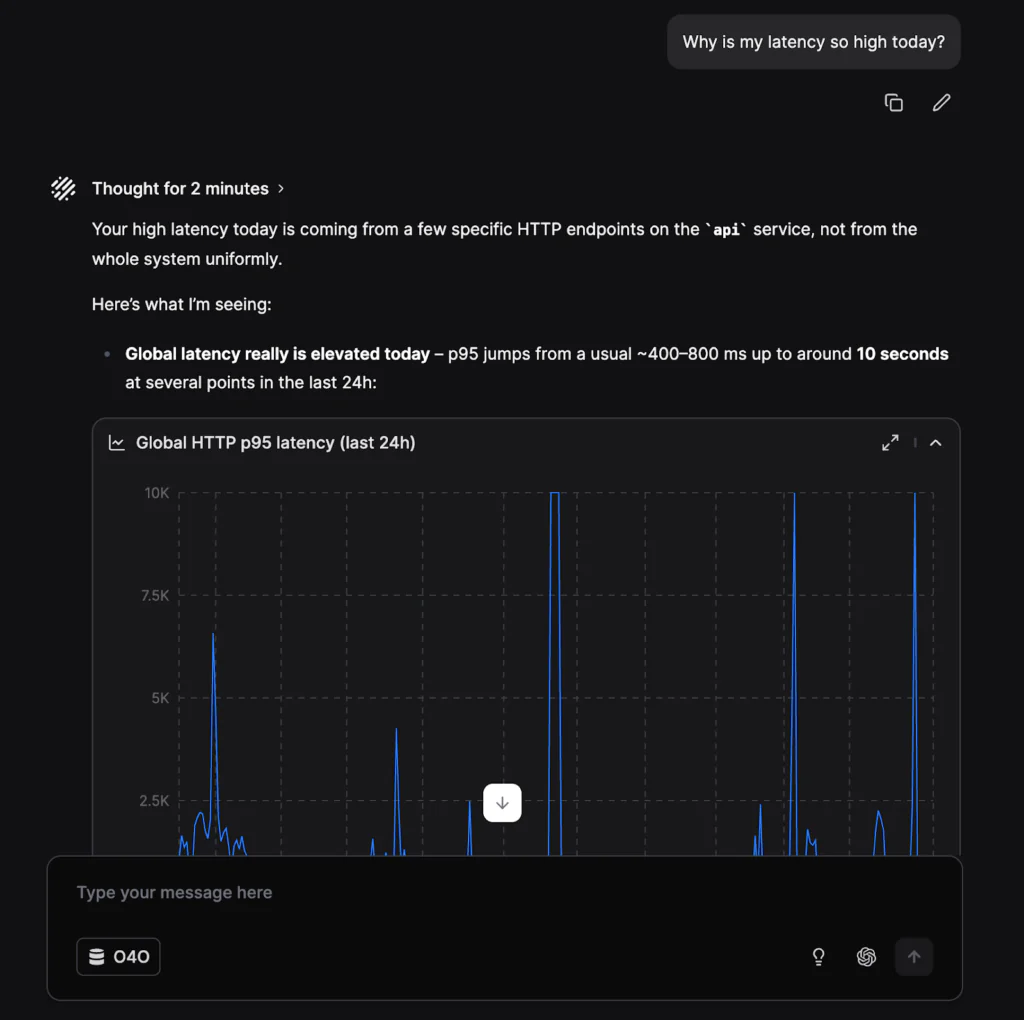
Customer use case
In this case, a team was dealing with response-time spikes in an application that didn’t seem to follow any pattern. Alerts fired, users felt the slowdown, but nothing obvious stood out in the application itself.
TL;DR: This investigation didn’t just move faster, it looked in places humans wouldn’t. Olly correlates signals across applications, infrastructure, and historical data, uncovering hidden dependencies and turning a confusing latency issue into a clear, fixable root cause in minutes.
What happened: (over 4 months)
- The application experienced random latency spikes
- The spikes didn’t align with deployments, traffic changes or correlate with any log, metric, or trace
- Application-level dashboards didn’t point to a clear cause
- From the team’s perspective, the issue appeared intermittent and unexplained
What Olly discovered: (in 10 minutes)
- A downstream pattern: Olly identified that the latency wasn’t originating in the application itself, but in a downstream Notification Service the app depended on.
- Correlated spikes across systems: It matched latency spikes in the Notification Service with CPU spikes on an RDS database and corresponding RDS latency increases.
- An unexpected dependency: Olly surfaced a Lambda function that, while not part of the main application path, was executing at the exact moments the spikes occurred.
- A hidden query issue: Digging deeper, Olly found repeated queries scanning unindexed tables, causing unnecessary load and slow responses.
- A concrete root cause and fix: The Lambda’s unindexed queries were saturating the RDS instance, indirectly causing latency across dependent services. Olly recommended adding indexes to the Lambda-related tables, which resolved the issue.
Error analysis and debugging across services
Error spikes often trigger a familiar pattern: engineers jump between services, grep logs manually, and try to spot correlations by intuition.
They are the fastest way into a major incident triggering alerts, and pulling people demanding immediate answers into war rooms.. However, knowing that errors are happening is very different from knowing why.
This is what happens with Olly if you simply ask, “whats happening?”
Customer use case
TL;DR: A full-scale outage was diagnosed and resolved in minutes from a breakfast table. By scoping errors across time and correlating them with release activity, Olly turned a chaotic P0 incident into a fast, coordinated rollback.
What happened (right as he ordered breakfast at Disneyland):
- A sudden spike in errors triggered a P0 incident
- Multiple teams were pulled into a live war room
- The on-call engineer wasn’t even at their desk at the time
What Olly discovered (before his pancakes arrived):
- The scope of the error: Olly quickly confirmed how many times the error had occurred in the last hour, matching the alerts exactly and removing any uncertainty about impact.
- When and why it started: Expanding the timeframe, Olly pinpointed when the error first appeared, identified a clear inflection point in error frequency, and tied that spike to a likely release window.
- A root cause: With precise timing and supporting logs, the dev and Salesforce teams confirmed that a change had gone live during that window and rolled it back.
- A fast resolution: Once the rollback was complete, the errors stopped and the incident was resolved.
The new standard of Observability
The goal of observability was never dashboards. It was reliability.
Olly represents a shift away from manual navigation and toward autonomous understanding. Instead of teaching people how to operate complex tools, it lets them focus on the question that actually matters: what’s happening, and why?
This is the first post in a series exploring how Olly changes observability workflows, starting with troubleshooting and root cause analysis. In the next posts, we’ll dive into building queries and visualizations, natural language access across teams, and operational efficiency. We’ve already released a blog on how Olly is revolutionizing threat hunting, check it out here.