Using NoSQL Databases as Backend Storage for Grafana
Grafana is a popular way of monitoring and analysing data. You can use it to build dashboards for visualizing, analyzing, querying, and alerting on data when it meets certain conditions.
In this post, we’ll look at an overview of integrating data sources with Grafana for visualizations and analysis, connecting NoSQL systems to Grafana as data sources, and look at an in-depth example of connecting MongoDB as a Grafana data source.
MongoDB is a document or a document-oriented database and the most popular database for modern apps. It’s classified as a NoSQL system, using JSON-like documents with flexible schemas. As one of the most popular NoSQL databases around, and the go-to tool for millions of developers, we will focus on this to begin with, as an example.
General NoSQL via Data Sources
What is a data source?
For Grafana to play with data, it must first be stored in a database. It can work with several different types of databases. Even some systems not primarily designed for data storage can be used.
Grafana data source denotes any location wherein Grafana can access a repository of data. In other words, Grafana does not need to have data logged directly into it for that data to be analyzed. Instead, you can connect a data source with the Grafana system. Grafana then extracts that data for analysis, divinating insights and doing essential monitoring.
How do you add a data source?
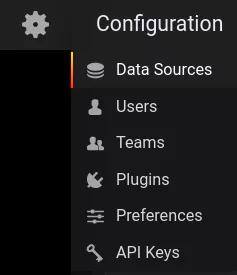
To add a data source in Grafana, hover your mouse over the gear icon on the top right, (the configuration menu) and select the Data Sources button:
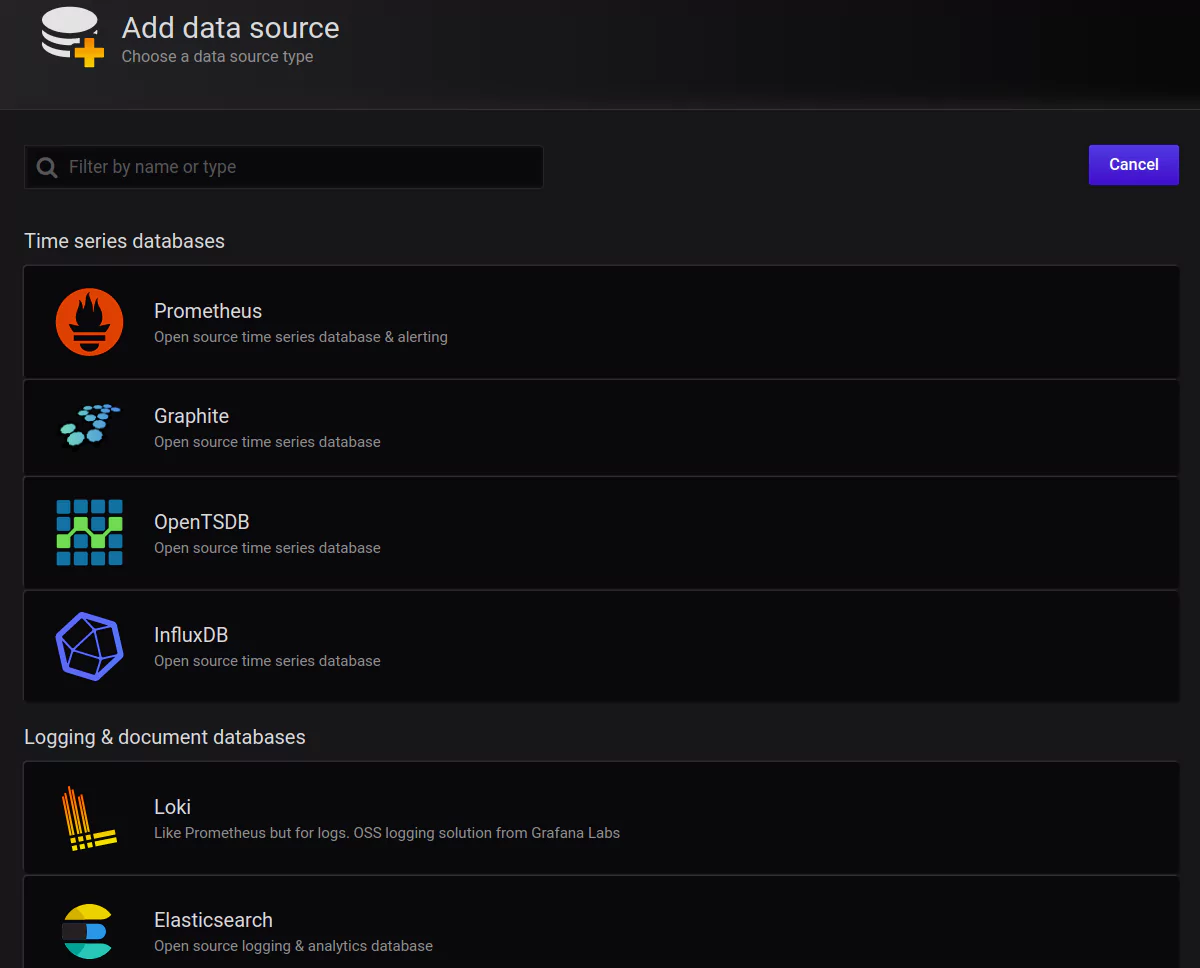
Once in that section, click the Add data source button. This is where you can view all of your connected data sources. You will also see a list of officially supported types available to be connected:
Once you’ve selected the data source you want, you will need to set the appropriate parameters such as authorization details, names, URL, etc.:
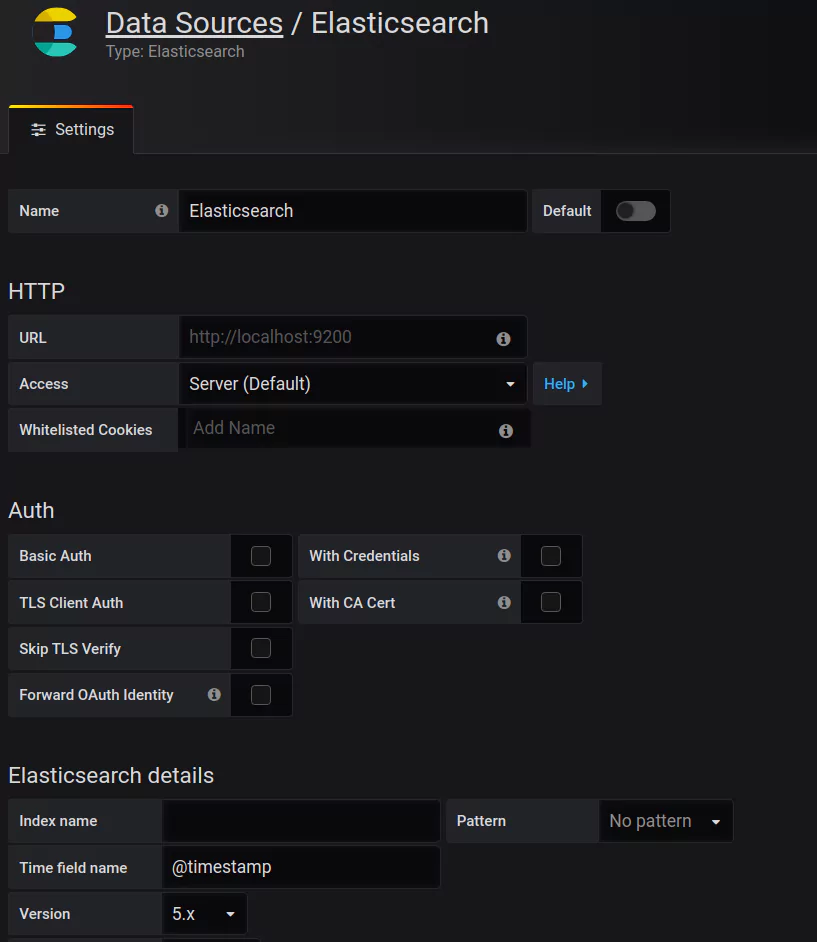
Here you can see the Elasticsearch data source, which we will talk about a bit later. Once you have filled the necessary parameters, hit the Save and Test button:
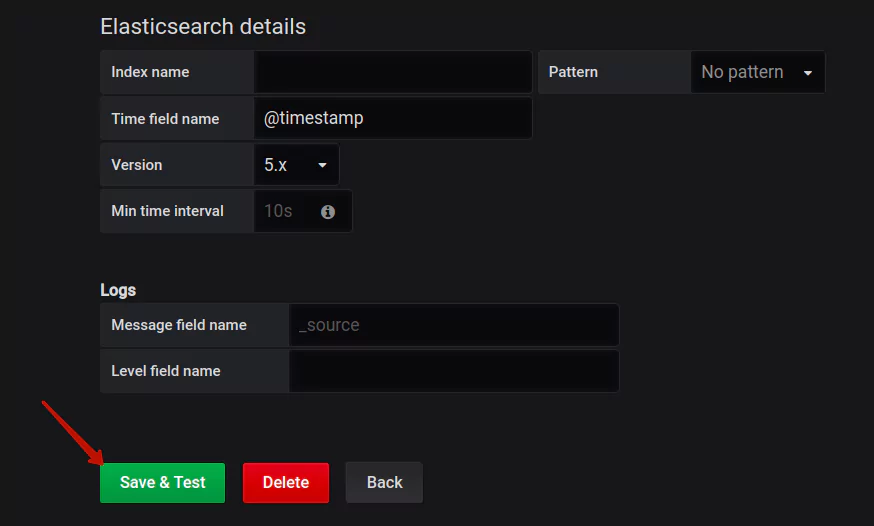
Grafana is going to now establish a connection between that data source and its own system. You’ll be given a message letting you know when this connection is complete. Then head to the Dashboards section in Grafana to begin venturing through that connected data source’s data.
Elasticsearch
This can function as both a logging and document-oriented database. Use Elasticsearch for powerful search engine capabilities or as a NoSQL database that can be connected directly with Grafana.
Avoid these 5 common Elasticsearch security mistakes.
How to Install Third Party Data Sources
Let’s head back to the stage that appears after you click the button Add data source. When the list of available and officially supported data sources pops up, scroll down to the bit that says “Find more data source plugins on Grafana.com”:
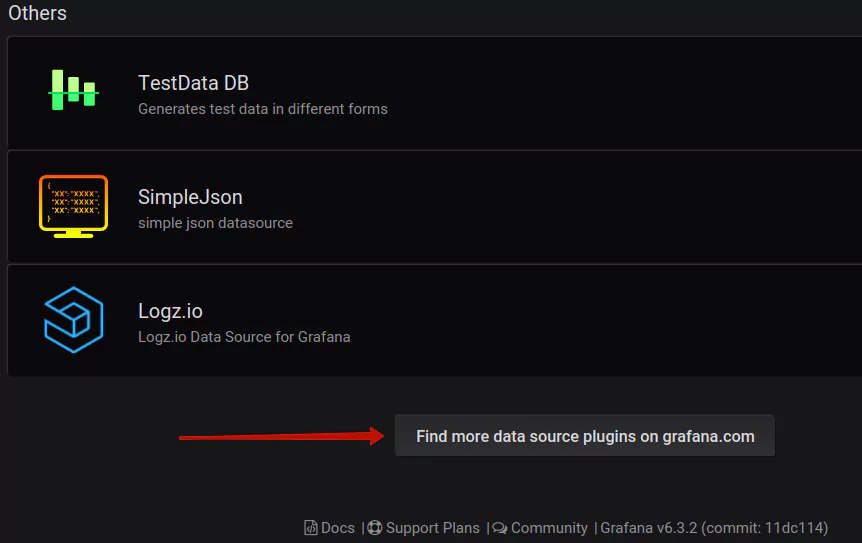
This link will lead to a page of available plugins (make sure that the plugin type selected is data source, on the left-hand menu):
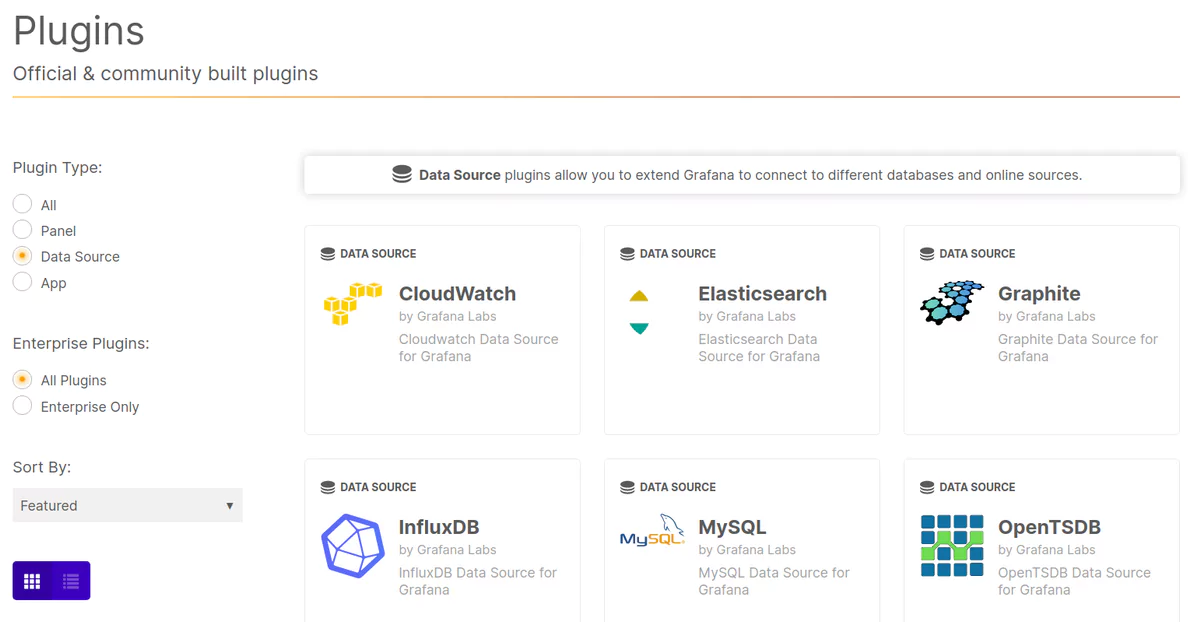
Plugins that are officially supported will be entitled “by Grafana Labs”, while open-source community plugins will have the individual names of developers:
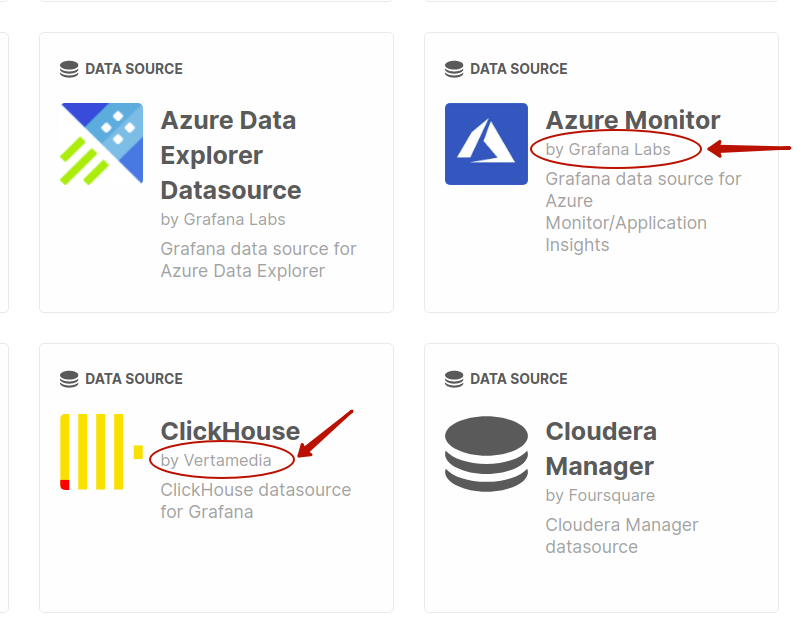
Selecting any of the options will take you to a page with details about the plugin and how to install. After installation, you should see that data source in your list of available data sources in the Grafana UI. If you’re still unclear, there is a more detailed instruction page.
Make a Custom Grafana Data Source
You have the option to make your own data source if there isn’t appropriate one in the official list or community-supported ones. You can make a custom plugin for any database you prefer as long as it uses the HTTP protocol for client communications. The plugin needs to modify data from the database into time-series data so that Grafana can accurately represent in its dashboard visualisations.
You need these three aspects in order to develop a product plugin for the data source you wish to use:
- QueryCtrl JavaScript class (allows you to do metric edits in dashboards panels)
- ConfigCtrl JavaScript class (configure your new data source, or user-edit)
- Data source JavaScript object (handles comms between the data source and data transformation)
MongoDB as a Grafana Data Source — The Enterprise Plugin
NoSQL databases handle enormous amounts of information vital for application developers, SREs, and executives — they get to see real-time infographics.
This can make them a shoe-in with regards to growing and running businesses optimally. See the plugin description here, entitled MongoDB Datasource by Grafana Labs.
MongoDB was added as a data source for Grafana around the end of 2019 as a regularly maintained plugin.
Setup Overview
Setting a New Data Source in Grafana
Make sure to name your data source Prometheus (scaling Prometheus metrics) so that it is by default identified by graphs.
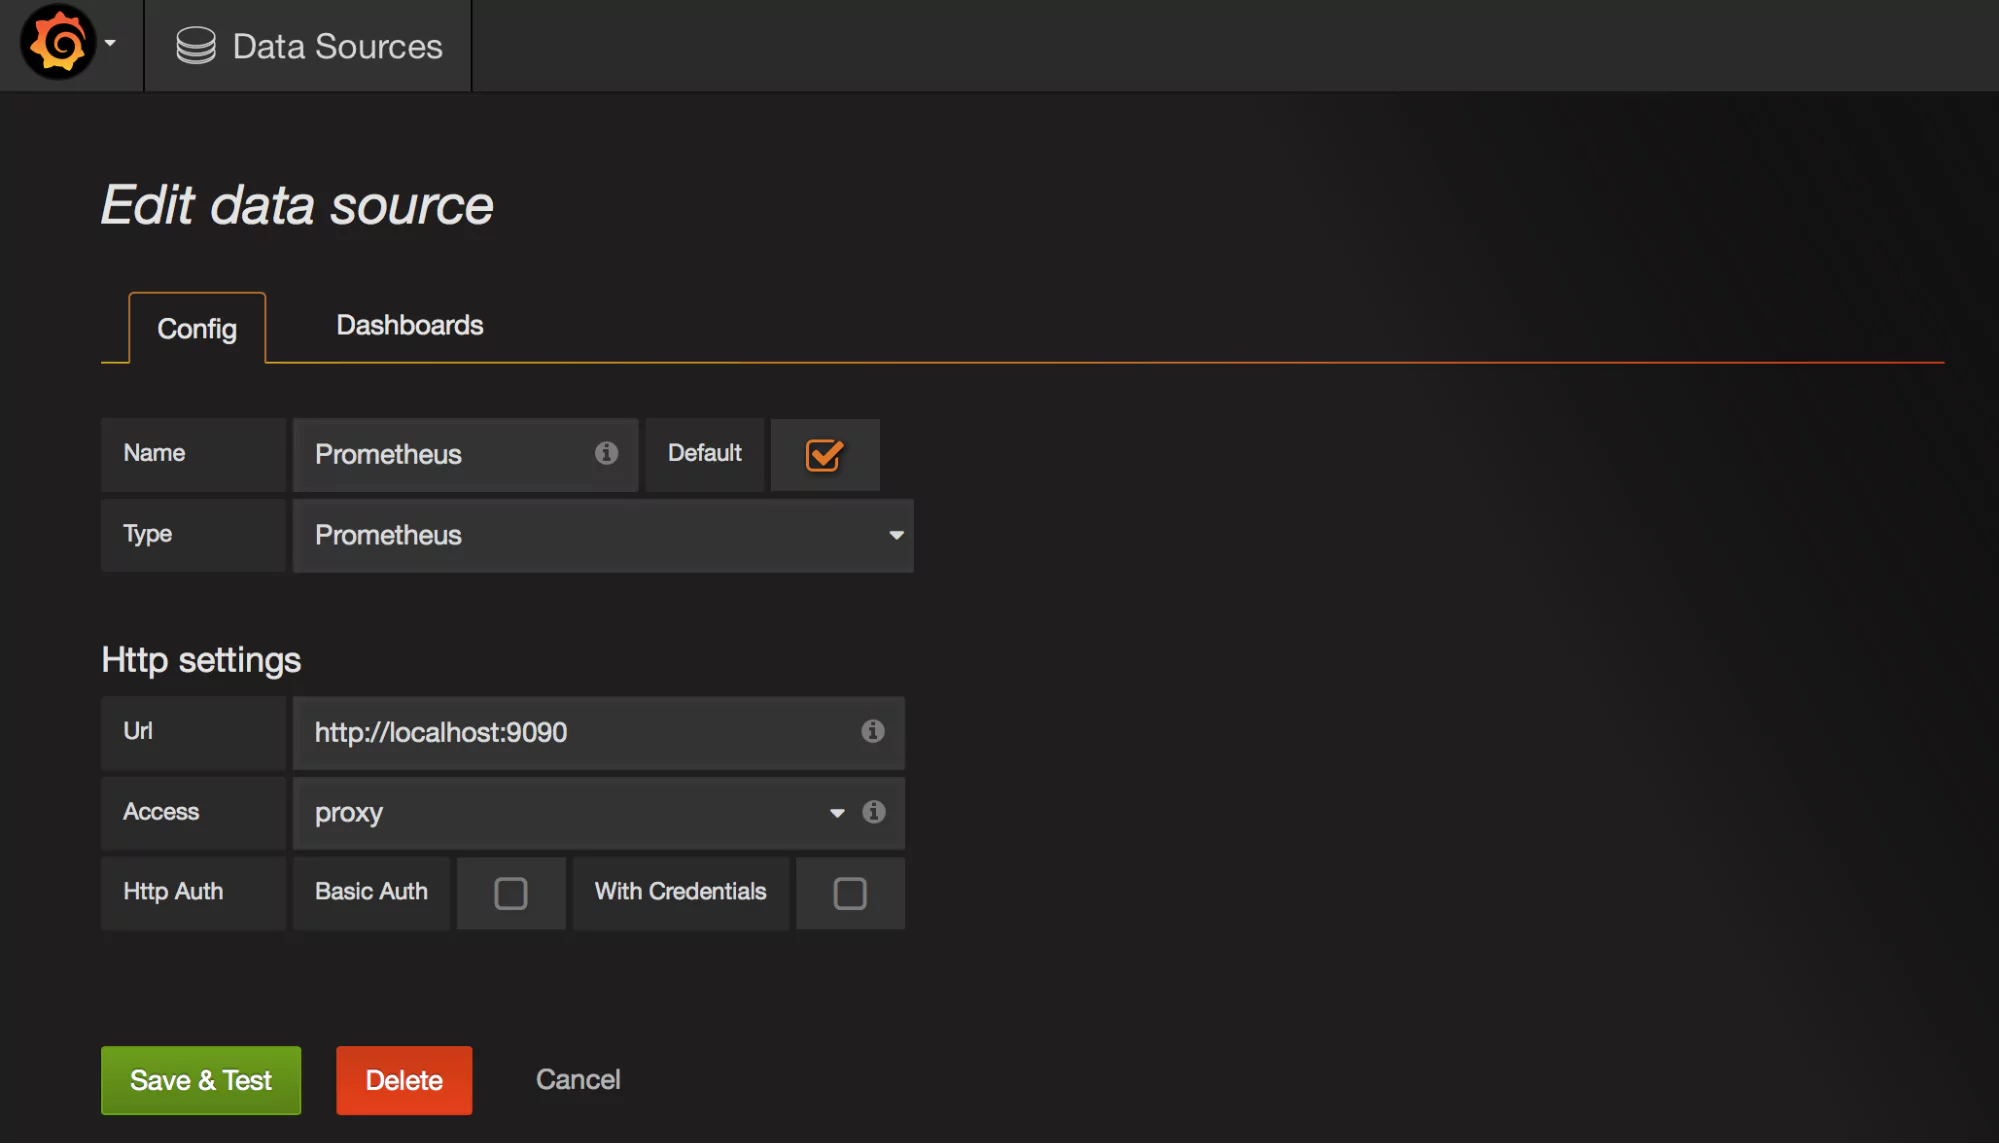
Configuring Prometheus
By default Grafana’s dashboards work with the native instance tag to sort through each host, it is best to use a good naming system for each of your instances. Here are a few examples:
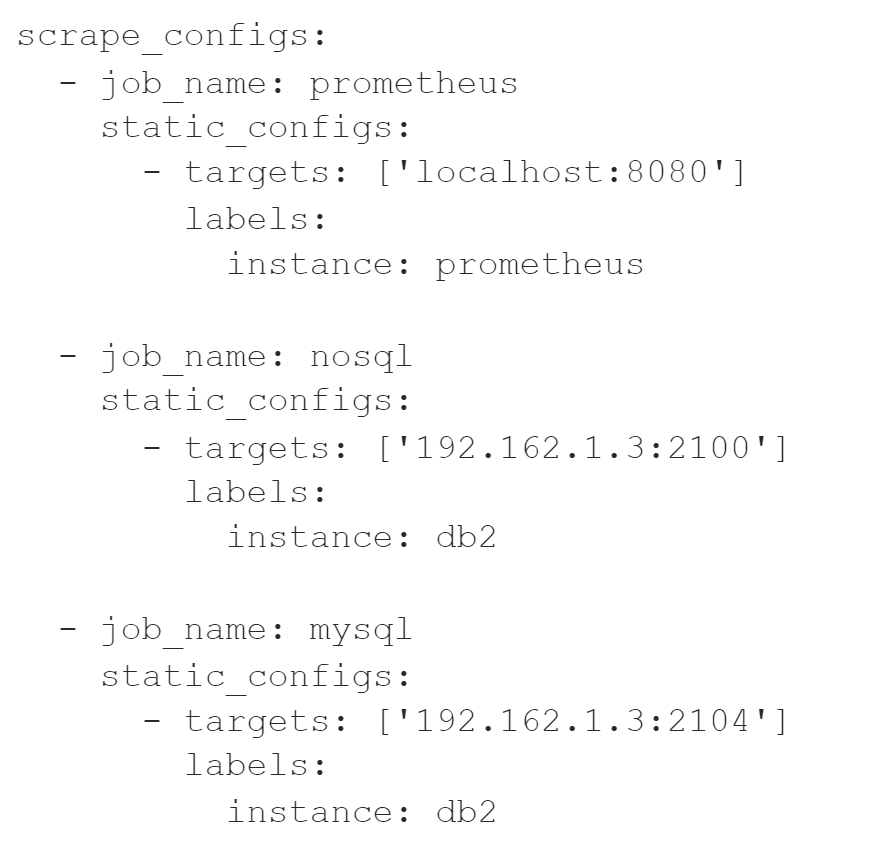
The names that you give to each job is not the essential part. But the ‘Prometheus’ dashboard will take Prometheus as the name.
Doing Exports
The following are the baseline option sets for the 3 exporters:
- mongodb_exporter: sticking with the default options is good enough.
- mysqld_exporter:
-collect.binlog_size=true -collect.info_schema.processlist=true -
node_exporter:
-collectors.enabled="diskstats,filefd,filesystem,loadavg,meminfo,netdev,stat,time,uname,vmstat"
Grafana Configuration (only relates to Grafana.x or below)
First edits to the Grafana config is to enable JSON dashboards — do this by uncommenting the following lines in grafana.ini
[dashboards.json]

enabled=true

path = /var/lib/grafana/dashboards
If you prefer to import dashboards separately through UI, skip this step and the next two altogether.
Dashboard Installation
Here is a link with the necessary code.
For users of Grafana 4.x or under run through these steps:
cp -r grafana-dashboards/dashboards /var/lib/grafana/
Grafana 5.x or later, make mysqld_export.yml here:
/var/lib/grafana/conf/provisioning/dashboards
with the following content:

Restarting Grafana:
Finally:
service grafana-server restart
Patch for Grafana 3.x
For users of this version a patch is needed for your install in order to let the zoomable graphs be accessible.
Updating Instructions
You just need to copy your new dashboards to /var/lib/grafana/dashboards then restart Grafana. Alternatively you can re-import them.
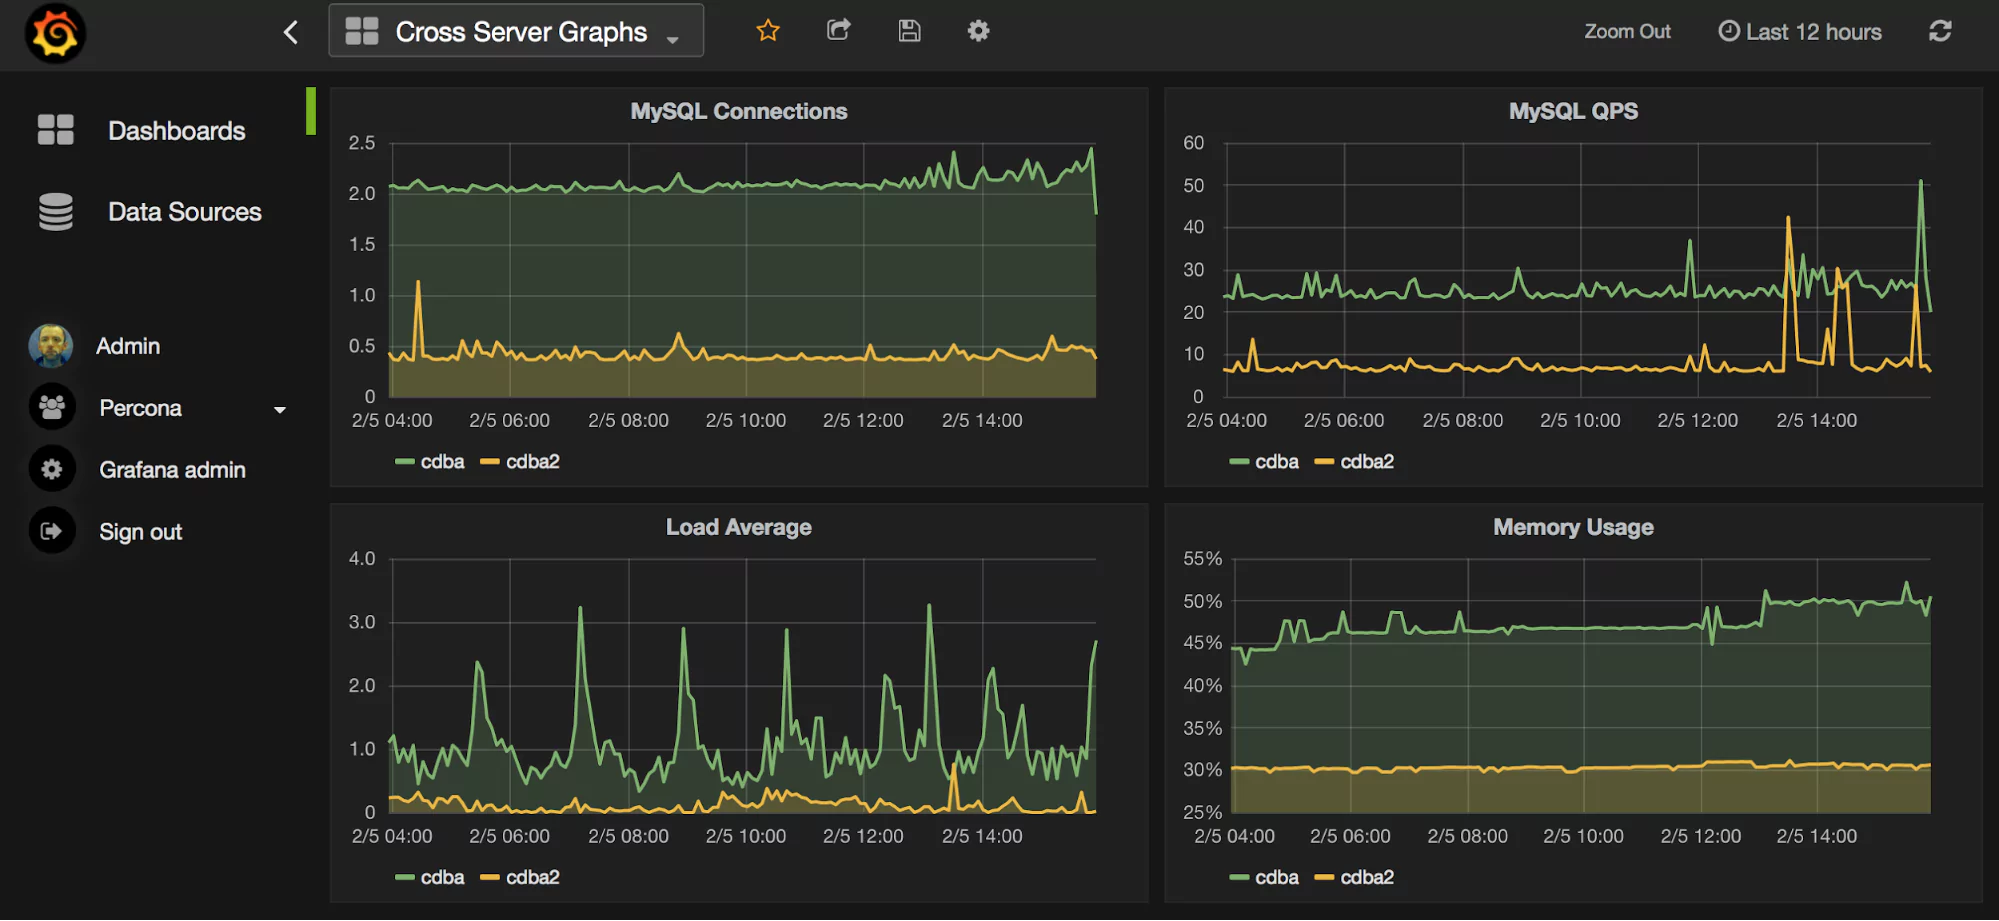
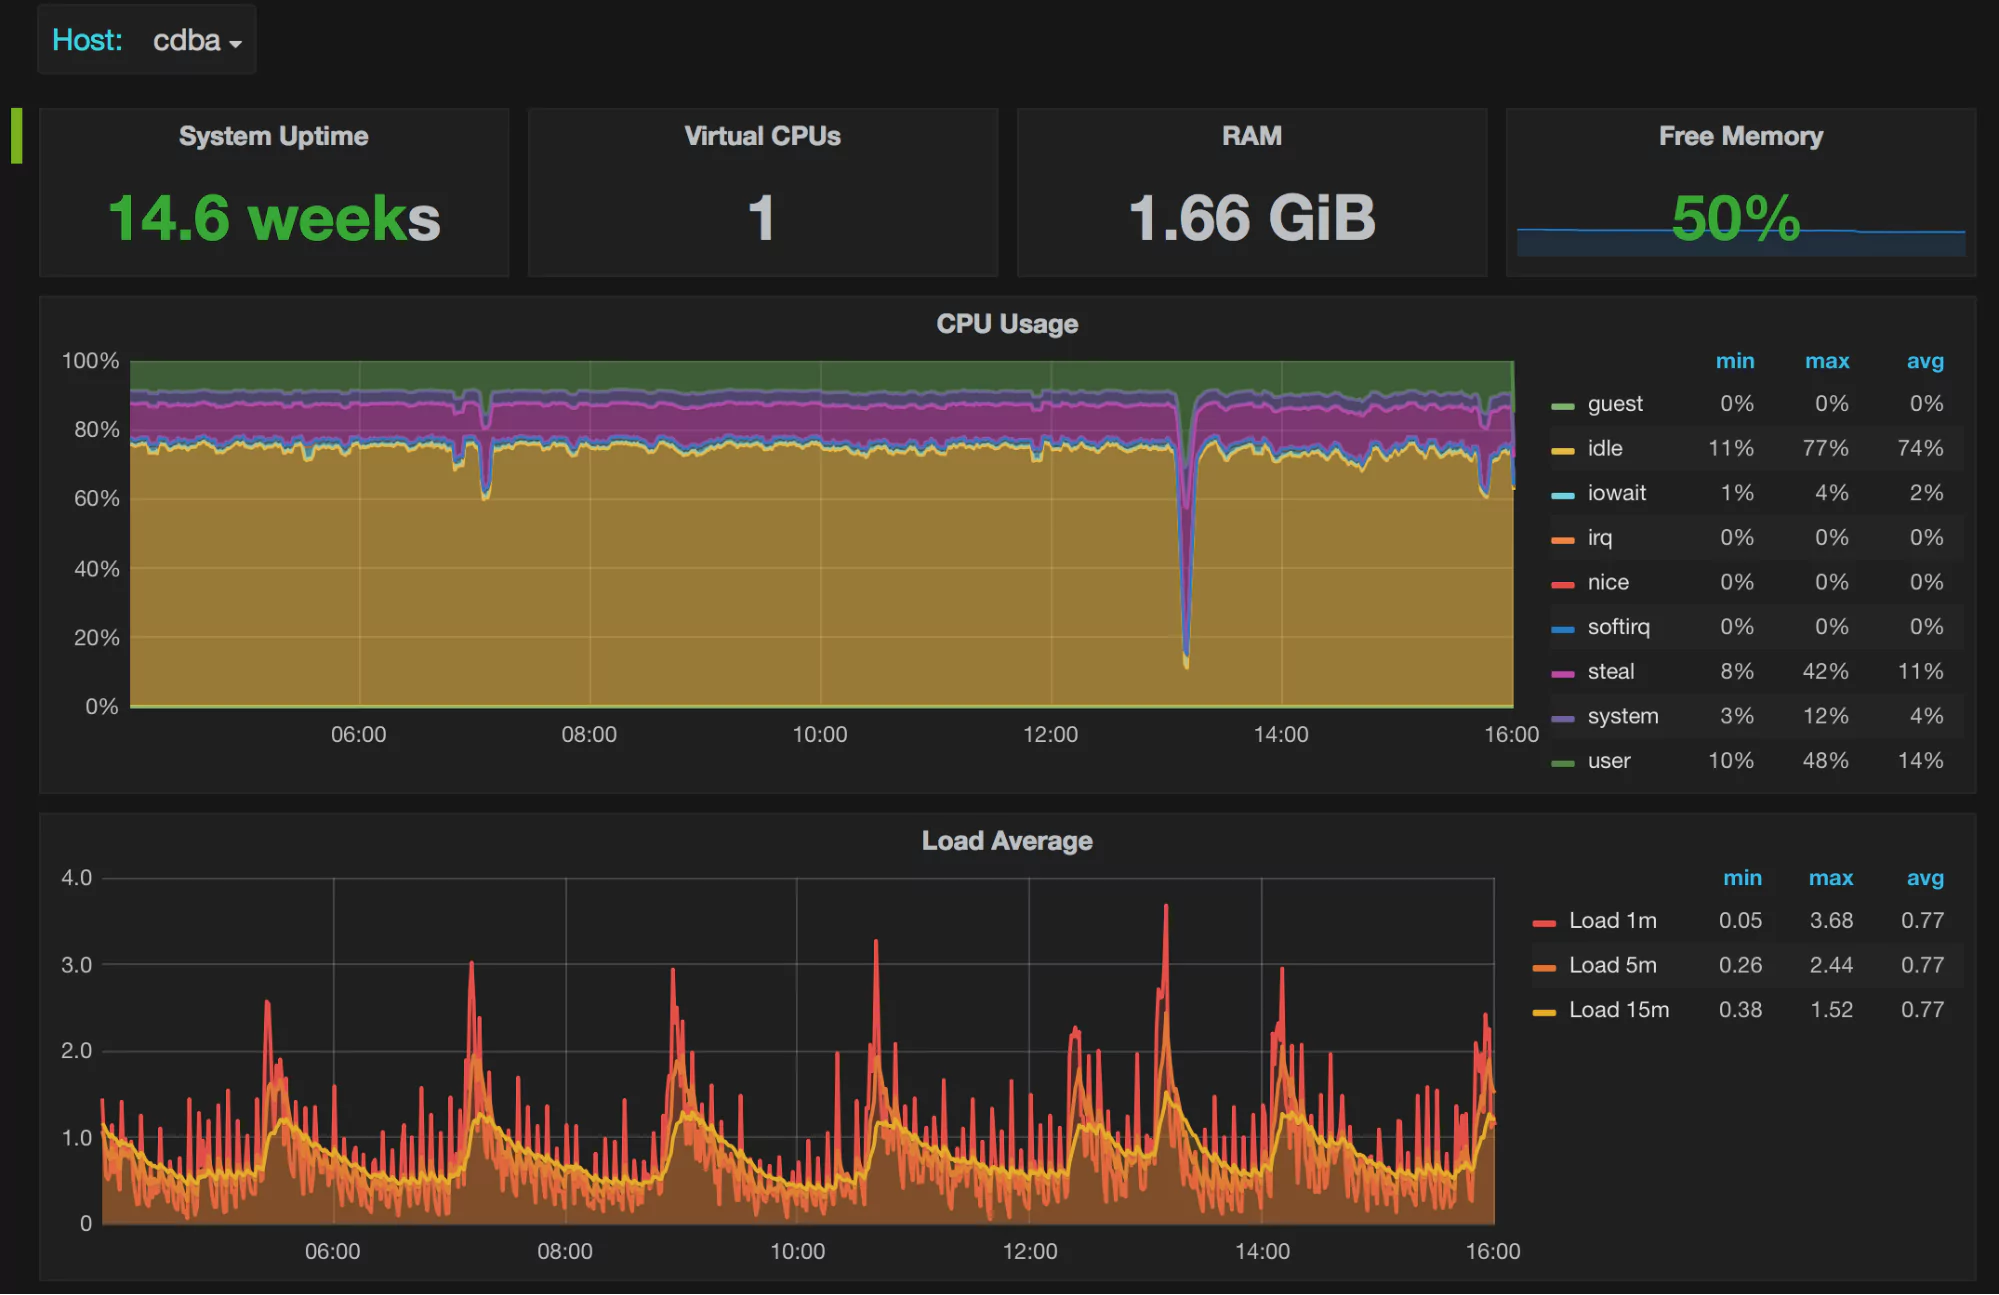
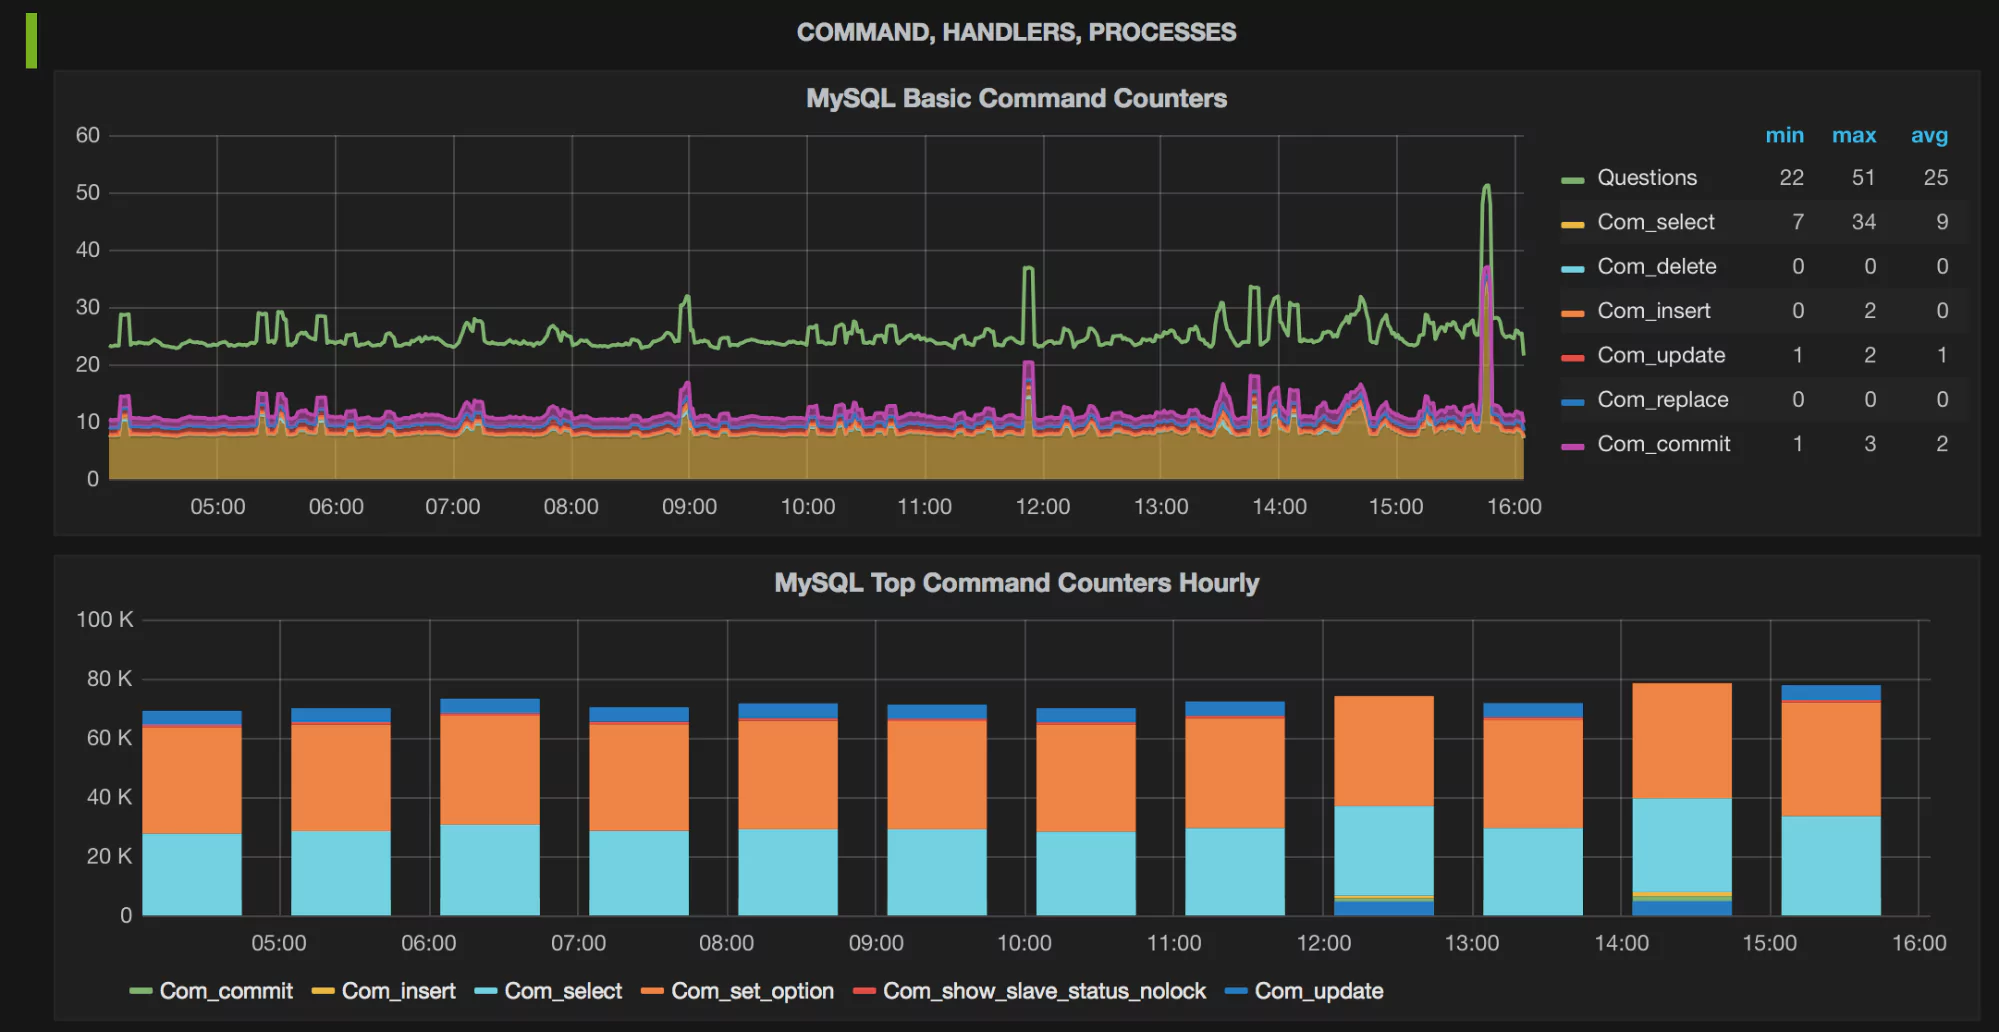
What Do the Graphs Look Like?
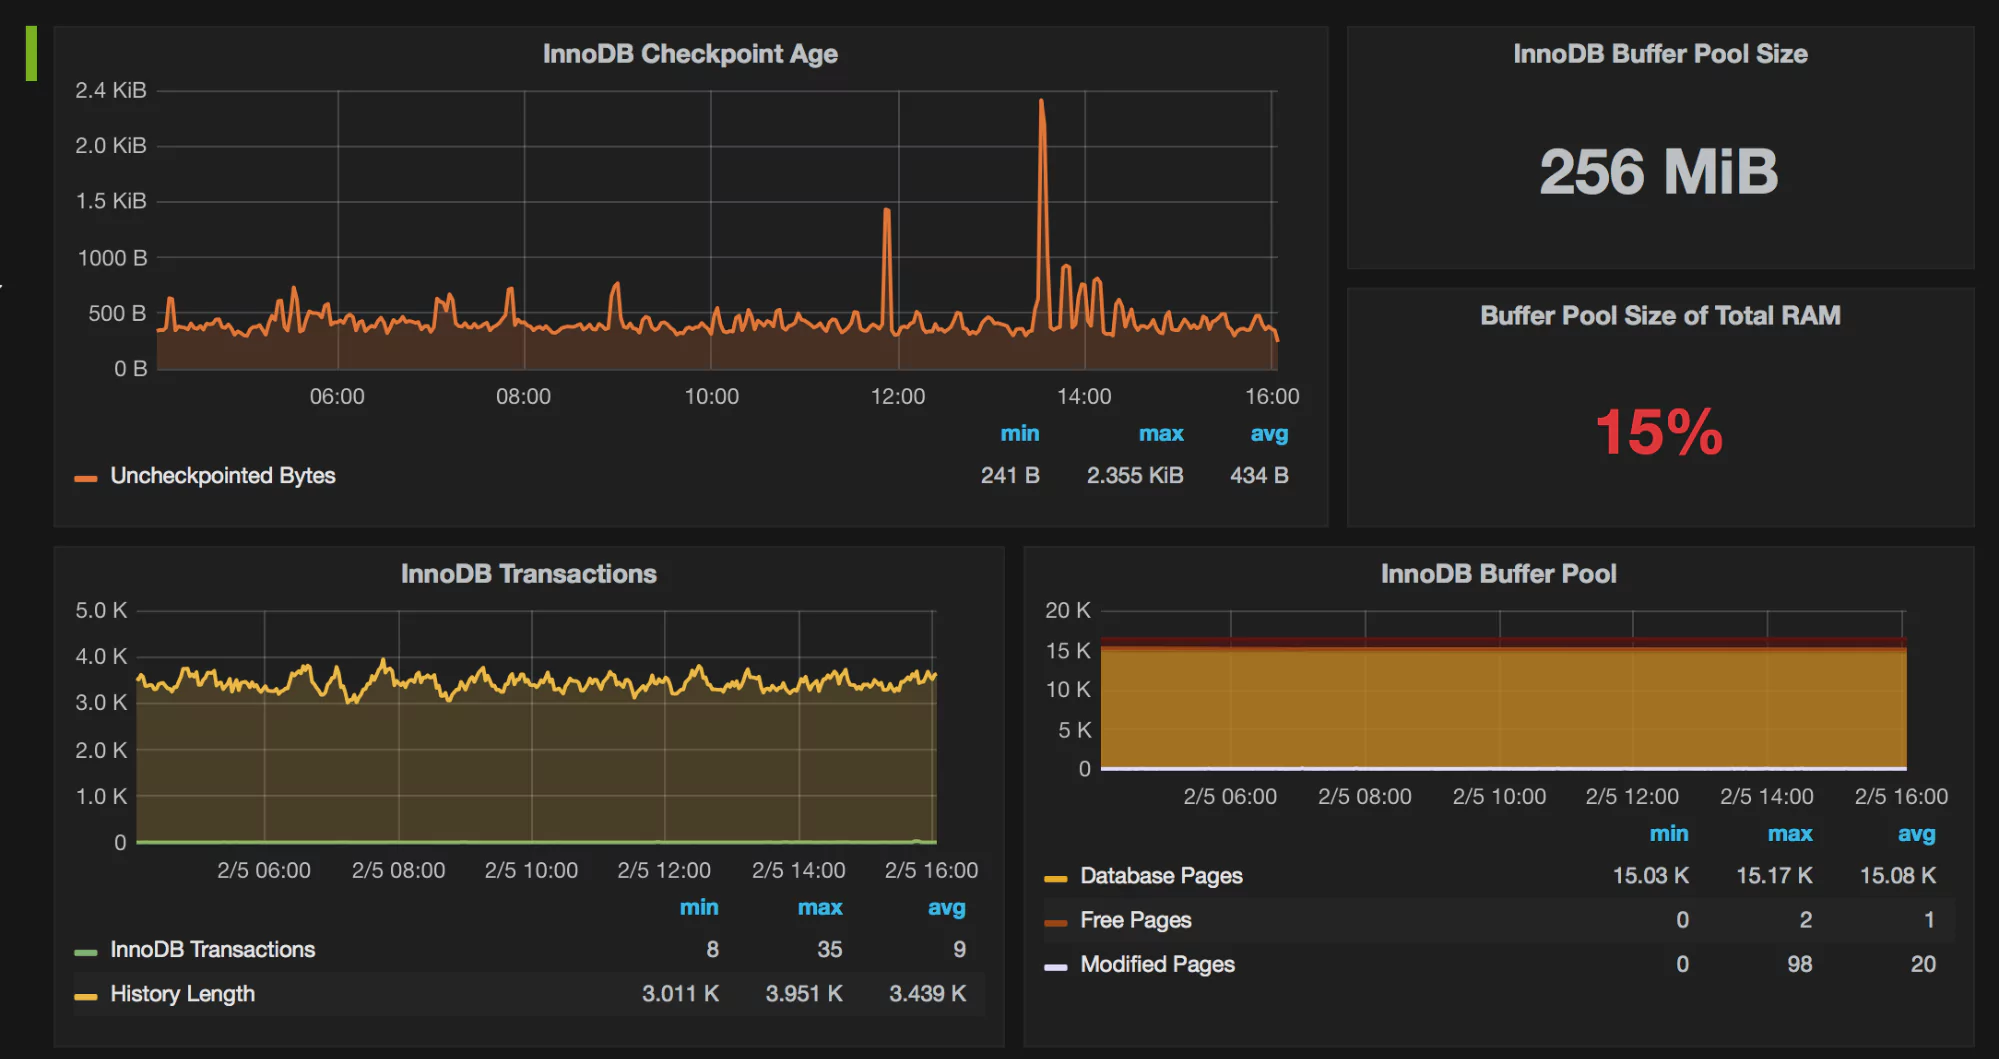
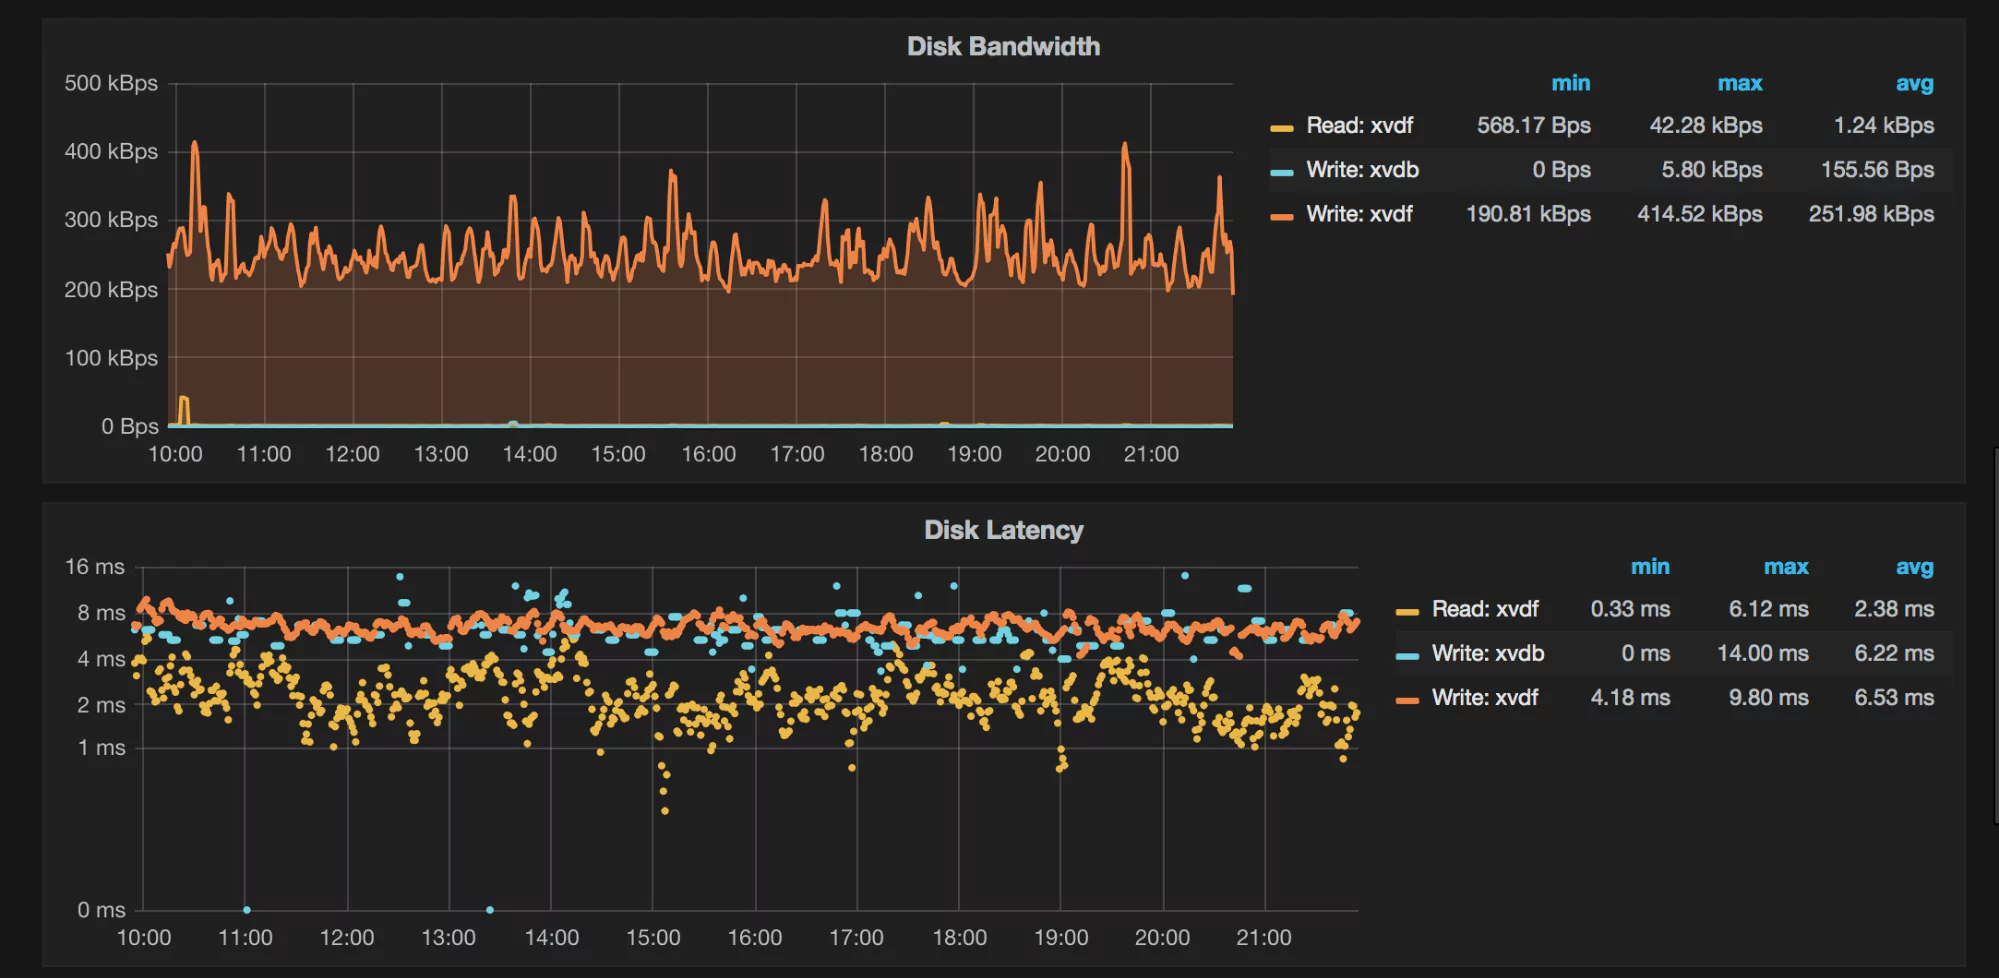
Here are a few sample graphs.

Benefits of Using MongoDB Backend Database as Grafana Data Source
Using the Grafana MongoDB plug-in, you can quickly visualize and check on MongoDB data as well as diagnostic metrics.
Diagnose issues and create alerts that let you know ahead of time when adjustments are needed to prevent failures and maintain optimal operations.
For MongoDB diagnostics, monitor:
- Network: data going in and out, request stats
- Server connections: total connections, current, available
- Memory use
- Authenticated users
- Database figures: data size, indexes, collections, so on.
- Connection pool figures: created, available, status, in use
For visualizing and observing MongoDB data:
- One-line queries: eg. combine sample and find, eg. sample_nflix.movies.find()
- Quickly detect anomalies in time-series data
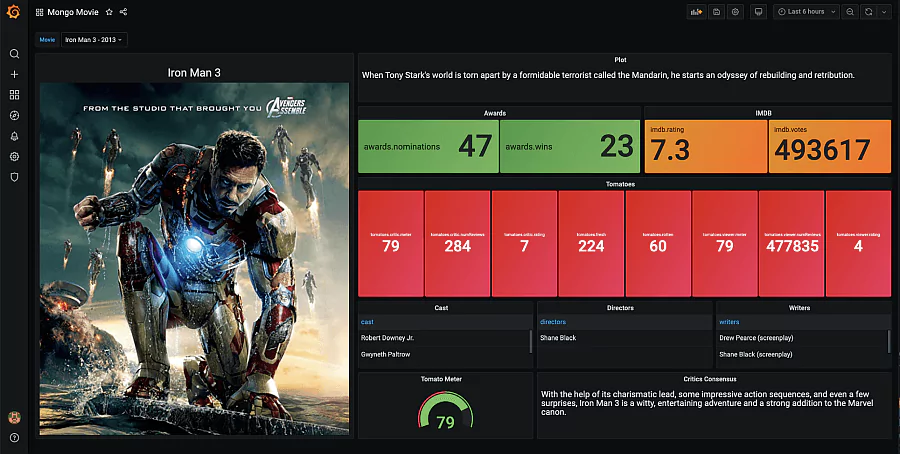
- Neatly gather comprehensive data: see below for an example of visualizing everything about a particular movie such as the plot, reviewers, writers, ratings, poster, and so on:
Grafana has a more detailed article on this here. We’ve only scratched the surface of how you could use this synchronicity.


