The new standard of observability is here. Discover Olly, the industry’s first
Using the OpenTelemetry Operator to boost your observability

If you’ve ever wrangled sidecars or sprinkled instrumentation code just to get basic trace data, you know the setup overhead isn’t always worth the payoff.
But what if it was… just easier?
That’s where the OpenTelemetry Operator for Kubernetes steps in… and it plays great with Coralogix out of the box! In this post, we’ll show you how to use our Helm chart to deploy a full OpenTelemetry pipeline that autocollects trace data, pushes it to Coralogix, and lets you explore it in minutes.
Let’s get into it.
What You’re Getting
By the end of this walkthrough, you’ll have:
- A working OpenTelemetry Operator deployed to your cluster.
- A Coralogix integration using our Helm chart.
- Auto-instrumentation for supported languages (no code changes needed!).
- Trace data flowing into your Coralogix account, visible in Traces View.
No custom code. No patching containers. Just configuration.
Step 1 – Create a Local Cluster (Optional, but Handy)
If you want to test things out before shipping to production, kind makes spinning up a local Kubernetes cluster pretty easy.
$ kind create cluster
Creating cluster "kind" ...
 ✓ Ensuring node image (kindest/node:v1.32.2) 🖼
 ✓ Preparing nodes 📦
 ✓ Writing configuration 📜
 ✓ Starting control-plane 🕹️
 ✓ Installing CNI 🔌
 ✓ Installing StorageClass 💾
Set kubectl context to "kind-kind"
You can now use your cluster with:

kubectl cluster-info --context kind-kind

Have a nice day! 👋
If you’re running on an existing cluster, skip ahead.
Also, if you want to run a specific version of Kubernetes, provide a configuration file. For instance, for Kubernetes 1.32.0:
kind: Cluster
apiVersion: kind.x-k8s.io/v1alpha4
networking:
  ipFamily: dual
nodes:
  - role: control-plane
    image: kindest/node:v1.32.0@sha256:c48c62eac5da28cdadcf560d1d8616cfa6783b58f0d94cf63ad1bf49600cb027
Step 2 – Install cert-manager
The OpenTelemetry Operator has a dependency on cert-manager. If you didn’t install cert-manager before in your cluster, follow the steps from the official documentation:
$ helm repo add jetstack https://charts.jetstack.io --force-update
$ helm install \
  cert-manager jetstack/cert-manager \
  --namespace cert-manager \
  --create-namespace \
  --version v1.17.2 \
  --set crds.enabled=true
Step 3 – Install the OpenTelemetry Operator
This installs the OpenTelemetry Operator via Helm. It will manage the lifecycle of OpenTelemetryCollectors and auto-instrumentation sidecars for you.
$ helm repo add open-telemetry https://open-telemetry.github.io/opentelemetry-helm-charts
$ helm repo update
$ helm install opentelemetry-operator open-telemetry/opentelemetry-operator --set manager.collectorImage.repository=otel/opentelemetry-collector-contrib
And we verify the operator is up and running:
$ kubectl --namespace default get pods -l "app.kubernetes.io/name=opentelemetry-operator"
NAME                                      READY   STATUS    RESTARTS   AGE
opentelemetry-operator-5f68bb465d-mh4j8   2/2     Running   0          54s
Step 4 – Install the Coralogix Integration with CRD Support
Here’s the trick: our Helm chart can now generate the OpenTelemetryCollector custom resource (CRD) for you. You just need to enable it.
First you need to create your API keys and setup integration following the Coralogix documentation.
Note that when executing the command to deploy the OpenTelemetry Collector, we need to provide a values.yaml file to override some default settings. For instance:
$ helm upgrade \
    --install otel-coralogix-integration \
    coralogix/otel-integration \
    --version=0.0.169 \
    --render-subchart-notes \
    --set global.domain="eu2.coralogixstg.wpengine.com" \
    --set global.clusterName="blogpost" \
    -f values.yaml
Where the content of values.yaml is:
opentelemetry-agent:
  collectorCRD:
    generate: true
  configMap:
    create: false
  ports:
    otlp:
      enabled: false
    jaeger-compact:
      enabled: false
    jaeger-thrift:
      enabled: false

opentelemetry-cluster-collector:
  collectorCRD:
    generate: true
  configMap:
    create: false
This installs the collector and configures it to send traces to your Coralogix account.
$ kubectl get otelcol
NAME                                MODE         VERSION   READY   AGE   IMAGE                                          MANAGEMENT
coralogix-opentelemetry             daemonset    0.123.1           31s   otel/opentelemetry-collector-contrib:0.123.0   managed
coralogix-opentelemetry-collector   deployment   0.123.1   1/1     31s   otel/opentelemetry-collector-contrib:0.123.0   managed
Step 4 – Enable Autoinstrumentation
First we need to create an Instrumentation object defining some parameters like where to send the telemetry data:
kubectl apply -f - <<'EOF'
apiVersion: opentelemetry.io/v1alpha1
kind: Instrumentation
metadata:
  name: my-instrumentation
spec:
  python:
     env:
       - name: NODE_IP
         valueFrom:
           fieldRef:
             fieldPath: status.hostIP
       - name: OTEL_EXPORTER_OTLP_ENDPOINT
         value: "http://$(NODE_IP):4318"
EOF
Now comes the fun part: you can add auto-instrumentation with just an annotation. The operator will inject sidecars into your pods and handle everything for you.
Here’s a quick example for a Python deployment:
apiVersion: apps/v1
kind: Deployment
metadata:
  name: my-app
spec:
  replicas: 1
  selector:
    matchLabels:
      app: my-app
  template:
    metadata:
      annotations:
        instrumentation.opentelemetry.io/inject-python: "true"
    spec:
      containers:
        - name: my-app
          image: my-python-app:latest
The operator detects the annotation and wires up the instrumentation automatically. Note that this will happen when your application pods are being created so: if your application is running, you need to restart your deployment.
Auto-instrumentation works for:
- Java
- Node.js
- Python
- .NET
- Go
You can find more information about the instrumentation injection capabilities in the OpenTelemetry Operator documentation.
You can find an example of an application in this GitHub repository.
Step 5 – Check the Coralogix Trace View
Now go to your Coralogix account.
Head over to Traces View, and you should start seeing spans flow in as requests hit your app.
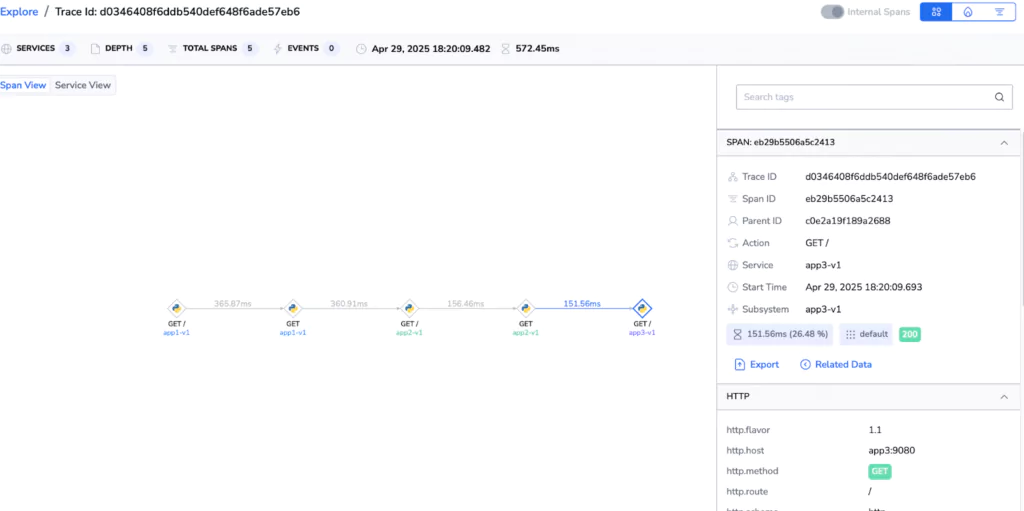
Want to search by service or look at request chains? You can do that here—no extra setup required.
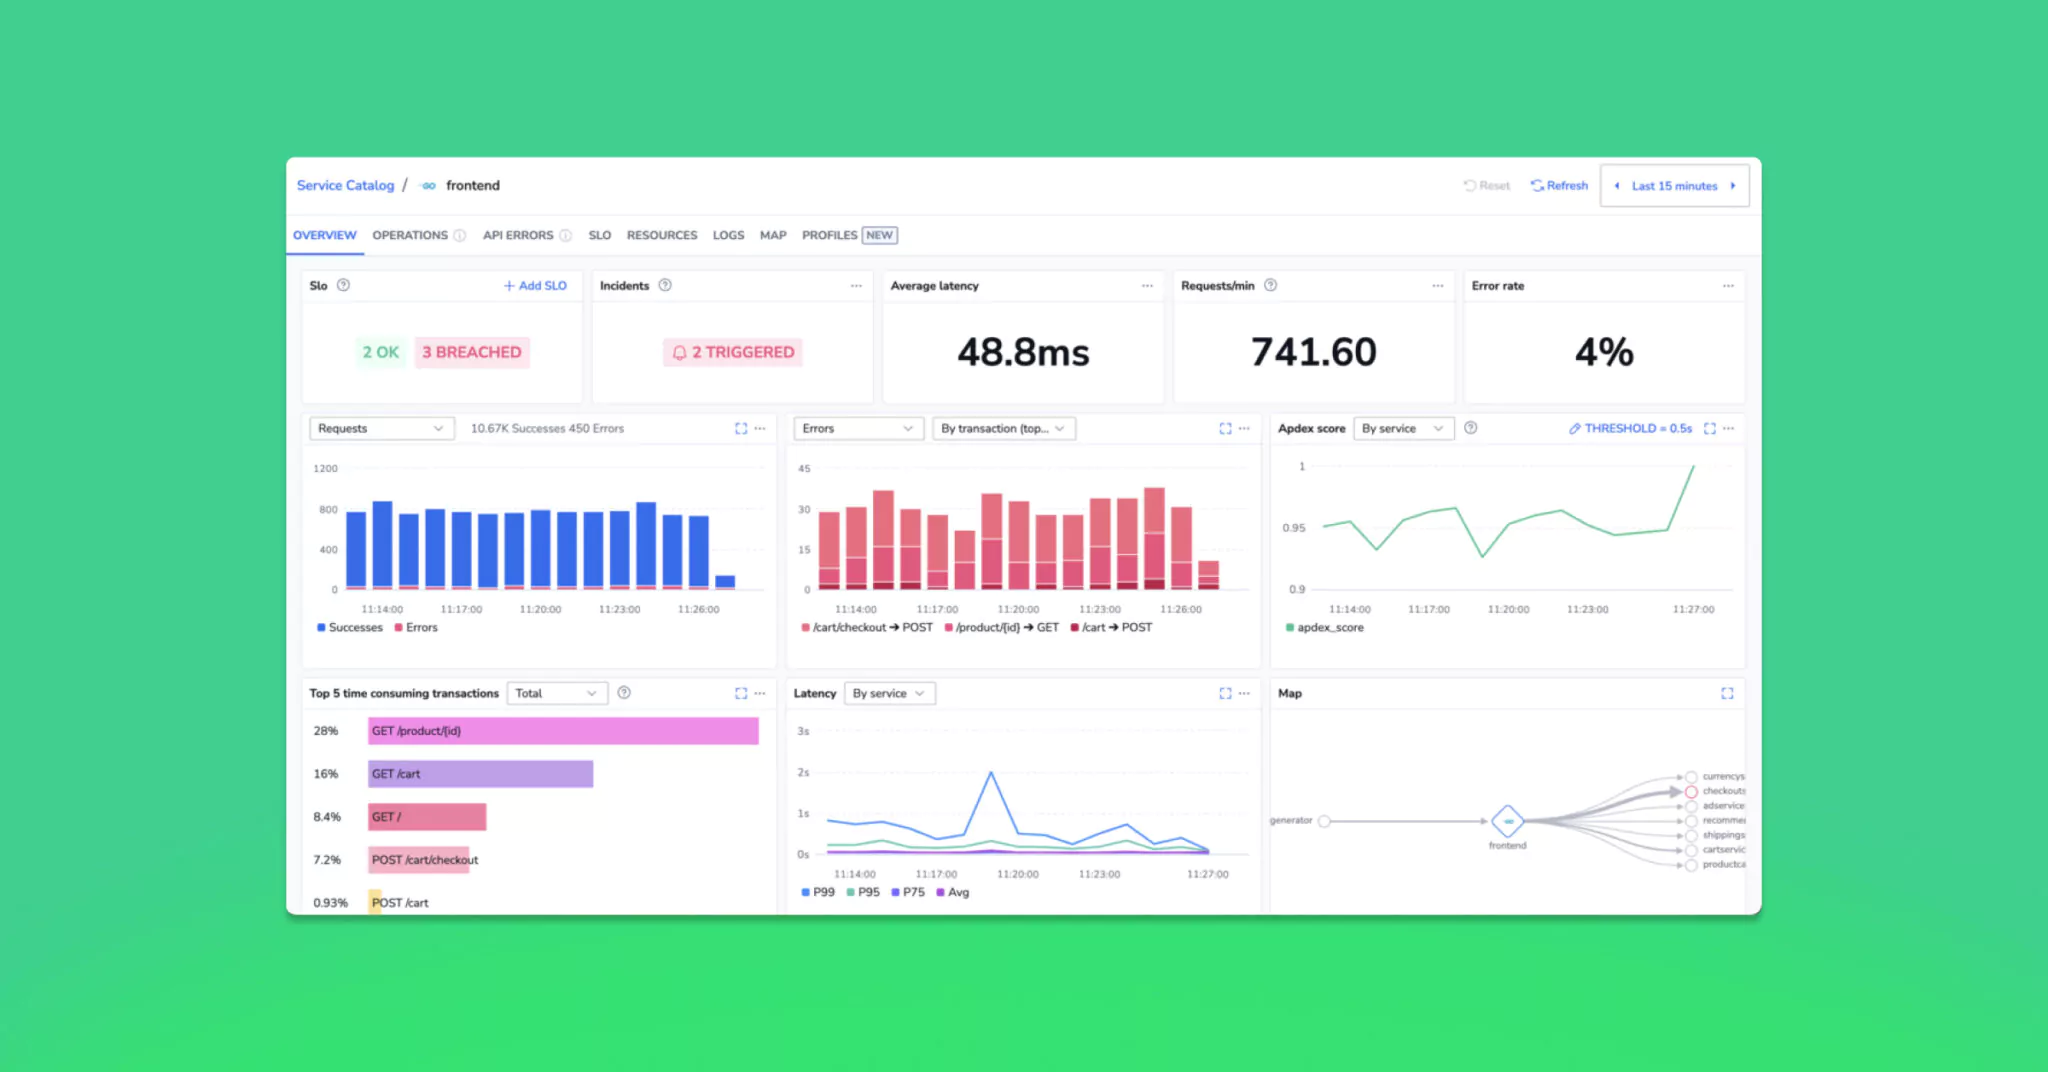
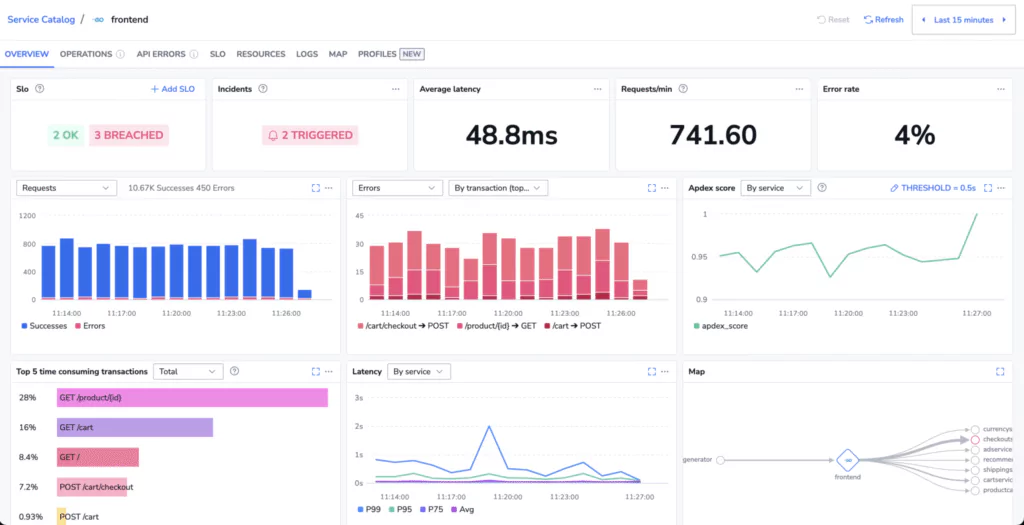
Also, you can go to APM > “Service Catalog” and select one of your services to access its dashboard.
No Traces Showing Up?
Annotations missing?
Make sure your pods have the correct instrumentation.opentelemetry.io/inject-* annotation. Depending on the language your application uses, you will need to adjust the annotation. Learn more about it on the OpenTelemetry Operator documentation.
Language support:
Not every language is supported out of the box. Check that your app’s language is one of the supported ones (Java, Python, Node.js, .NET). Also, some servers such as NGXING or Apache can get autoinstrumentation capabilities. More will be added soon!
Nothing happens
Maybe, you are using one of the languages where the instrumentation is not enabled by default by the operator. Check the documentation to enable it.
Firewall or proxy issues:
If your cluster has outbound restrictions, make sure it can reach Coralogix ingestion endpoints.
That’s It
Telemetry data collection can be tricky. But with the OpenTelemetry operator and our Helm chart, everything becomes easier.
And once you’ve got this up and running, you can start tuning performance, adding metrics, or correlating logs—without fighting YAML.
Give it a shot and let us know how it goes.