Elastic Application Performance Monitoring: A Practical Guide

Elastic APM Key Features
The main features of Elastic APM include:
- Anomaly detection: Utilizes machine learning algorithms to automatically identify unusual behavior within application data. This feature alerts users to potential issues before they affect the application’s performance.
- Service mapping: Provides a visual representation of the architecture of deployed services, showing how they interact with each other. This enables quick diagnosis by displaying the connections between services, helping pinpoint where failures or bottlenecks are occurring.
- Distributed tracing: Tracks a request’s journey through various services in a microservices architecture. It collects data from each point the request interacts with, enabling a comprehensive view of its path. This visibility is crucial for diagnosing issues in systems where a single request can span multiple services.
- Smart sampling: Reduces the volume of data collected by selecting representative samples of transactions. This approach ensures the collection of meaningful data without overwhelming storage and processing resources. It strikes a balance between coverage and efficiency, providing sufficient insights to understand application performance.
- Real User Monitoring (RUM): Captures user interactions with an application in real time. This feature offers insights into end-user experience, such as load times and responsiveness. RUM data helps identify front-end issues and assess the impact of backend performance on users.
- Machine learning and AIOps: Automates the analysis of application performance data. These technologies help predict potential issues and suggest optimizations. Machine learning algorithms improve over time, enhancing their predictive accuracy.
Elastic APM Components
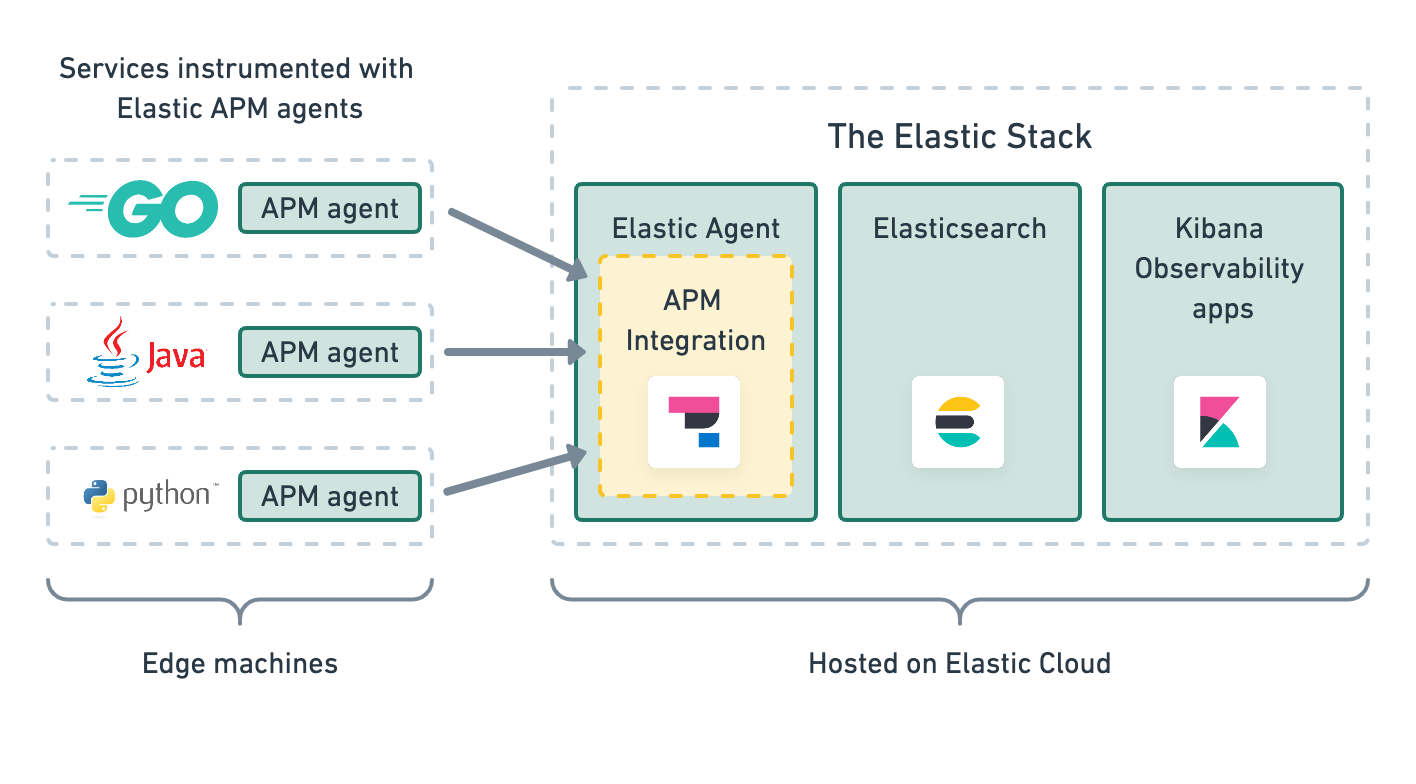
Here’s an overview of the components in Elastic APM.

Source: Elastic
APM Agents
APM agents are lightweight programs installed in the host application. They collect performance data and send it to Elastic APM for analysis. Agents are available for various programming languages and frameworks, supporting broad compatibility and easy integration. By operating within the application, APM agents can gather detailed performance metrics, enabling deep insights into application behavior.
The APM Server
The APM server processes data collected by APM agents and sends it to Elasticsearch. Acting as a bridge, it ensures efficient data transmission and storage. The APM server can also enrich data with additional context, enhancing the depth of analysis possible. As the central hub for data processing, the APM server’s performance and reliability impact the overall effectiveness of the monitoring solution.
Elasticsearch
Elasticsearch stores and indexes performance data, making it easily searchable and analyzable. Its powerful querying capabilities support complex analyses, enabling teams to uncover insights quickly. As the backbone of Elastic Stack, Elasticsearch ensures scalability and supports managing large volumes of performance data and delivering actionable insights.
Kibana
Kibana provides a user interface for visualizing and exploring data stored in Elasticsearch. Users can create dashboards and charts illustrating application performance trends. Customizable visualizations make it easier to communicate insights and drive decision-making. Kibana enhances Elastic APM by offering intuitive tools for data presentation, helping translate complex data into actionable information.
Related content: Read our guide to application performance monitoring tools
Elastic APM Tutorial: Create and Upload Source Maps
Creating and uploading source maps is important for managing the performance of web applications and ensuring they are debuggable. Minifying JavaScript code is common practice to enhance load times and reduce network latency, but it complicates debugging due to the transformation of code into a less readable format.
Source maps solve this by mapping the minified code back to the original source code, allowing for the benefits of minification without losing the ability to debug effectively. Uploading source maps as part of your deployment process ensures that any errors that occur can be accurately traced back to your source code, enhancing your ability to quickly diagnose and fix issues.
Code snippets in this tutorial are adapted from the official Elastic Documentation.
Start the RUM Agent
To integrate source mapping for error stack traces within the Elastic APM application, start by initializing the RUM (Real User Monitoring) Agent in your application. This involves setting the service name and version. You can choose a service version that aligns with your application versioning, such as the version specified in your package.json, or a unique identifier like a git commit hash. This step is crucial for matching the correct source map file to each stack trace later on.
Here’s an example code snippet for initializing the RUM agent with a version from package.json:
import { init as initApm } from '@elastic/apm-rum';
const serviceVersion = require("./package.json").version;

const apm = initApm({
  serviceName: 'myService',
  serviceVersion: serviceVersion
});
And here’s an example using a git commit reference:
const git = require('git-rev-sync');
const serviceVersion = git.short();
Create the Source Map
The source map generation method can vary based on the tools you use. Here is an example configuration for Webpack, which uses the TerserPlugin for minification and source map generation:
const webpack = require('webpack');
const serviceVersion = require("./package.json").version;
const TerserPlugin = require('terser-webpack-plugin');

module.exports = {
  entry: 'app.js',
  output: {
    filename: 'app.min.js',
    path: './dist'
  },
  devtool: 'source-map',
  plugins: [
    new webpack.DefinePlugin({'serviceVersion': JSON.stringify(serviceVersion)}),
    new TerserPlugin({
      sourceMap: true
    })
  ]
};
Upload the Source Map
Uploading the generated source map to the Elastic APM server is the final step. This can be done using the curl command or through a custom application. It’s important to ensure that RUM support is enabled in the APM integration and to provide necessary information such as service_name, service_version, bundle_filepath, and the sourcemap file itself.
Here’s an example curl request to upload a source map:
SERVICEVERSION=`node -e "console.log(require('./package.json').version);"` &&
curl -X POST "http://localhost:5601/api/apm/sourcemaps"
-H 'Content-Type: multipart/form-data'
-H 'kbn-xsrf: true'
-H 'Authorization: ApiKey ${YOUR_API_KEY}'
-F 'service_name=foo'
-F 'service_version=$SERVICEVERSION'
-F 'bundle_filepath=/test/e2e/general-usecase/app.min.js'
-F 'sourcemap=@./dist/app.min.js.map'
After the source map is uploaded, it’s stored in Elasticsearch, and the APM server uses it to map minified code back to the original source, aiding in the debugging process whenever errors occur.
Observability SaaS – Coralogix
Managing your own ELK stack might be costing you far more than your think with hidden infra costs, dedicated engineering resources and other overhead. If you are looking for a fully managed solution, Coralogix provides full-stack observability with out-of-the-box parsing rules, alerts and dashboards and of course fully customizable view and workflows. On top of this, Coralogix’s unique architecture is not reliant on expensive indexing or hot storage so you can observe all your data for far less cost.
Learn about one of our customers who successfully migrated off of their ELK stack to Coralogix.


