
Opensearch Dashboards: The Basics and 2 Quick Tutorials


Key Capabilities of OpenSearch Dashboards
OpenSearch Dashboards offers the following key features:
- Customizable dashboards: Users can tailor their visualization interfaces according to needs and preferences. They can create, modify, and manage dashboards with drag-and-drop components, making data more understandable and accessible from a single point.
- Real-time data analysis: It provides up-to-the-minute information, crucial for monitoring live systems and applications, enabling prompt responses to emerging issues or trends. By accessing current data, users can make informed decisions quickly.
- Advanced data exploration: Users can look deeply into their data, uncovering insights that might be missed with surface-level analysis. Data exploration tools support complex queries and data filtering, providing a granular look at data sets. The platform also offers visualization options that make complex data more digestible and actionable.
- Built-in security features: These features ensure that data remains secure and access is controlled. Authentication mechanisms, including password protection and integration with third-party identity providers, prevent unauthorized users from viewing or altering sensitive information. Data encryption and audit logging further enhance security.
What Are the Differences Between OpenSearch Dashboards and Elasticsearch/Kibana?
OpenSearch Dashboards, originally based on Elasticsearch and Kibana, differs in a few important ways from its predecessor:
- The OpenSearch project is fully open-source. This is in contrast to the licensing changes in Elasticsearch and Kibana, which led to concerns about future accessibility and control over the software.
- OpenSearch Dashboards is designed to be backward compatible with Elasticsearch and Kibana, meaning it can work with data and plugins from these platforms.
- OpenSearch provides improvements in performance, scalability, and security, addressing some of the limitations and challenges faced by Elasticsearch and Kibana.
- OpenSearch Dashboards introduces new features like OpenSearch Assistant, which make data analytics more accessible. The Assistant feature uses large language models (LLMs) to reduce the learning curve and make advanced data analysis functionality available to a broader audience.
What Is OpenSearch Assistant for OpenSearch Dashboards?
OpenSearch Assistant is a feature designed to enhance user interaction with dashboards through a large language model (LLM). Users can query data using everyday language, making data exploration and analysis more intuitive and accessible. This reduces the learning curve for new users and increases efficiency for experienced ones by simplifying complex queries.
The Assistant offers suggestions and auto-completes queries based on user input, streamlining the search process. Its integration with OpenSearch Dashboards allows users to leverage advanced data insights without the need for extensive technical knowledge. It also explains how responses were generated, making it possible to check their validity.
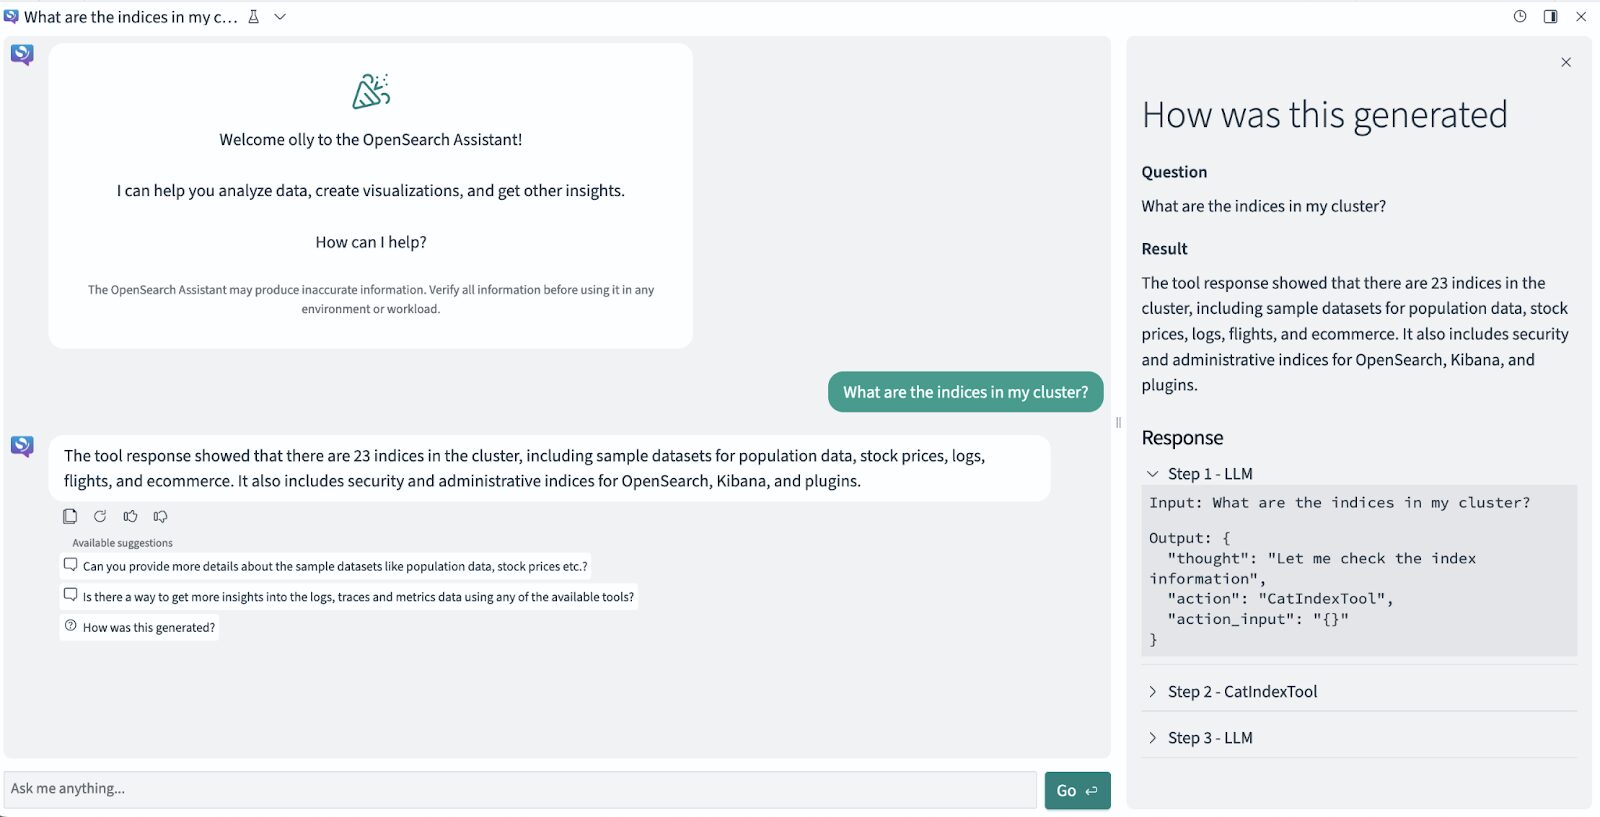
Source: OpenSearch
Note: As of the time of this writing, OpenSearch Assistant is an experimental feature not recommended for production environments.
Quick Tutorial #1: Creating a Dashboard
Here is a walkthrough of the process of creating a dashboard in OpenSearch. This example uses the OpenSearch Playground.
Step 1: Create a Dashboard and Add a Visualization
In the OpenSearch Playground, select OpenSearch Dashboards > Dashboard from the top menu bar. In the Dashboards panel, click on Create Dashboard. Next, you will need to adjust the time filter to reflect the Last 30 days by choosing the calendar icon.
To incorporate an existing visualization into your dashboard, select Add an existing from the panel. Navigate through the Add panels window, select [eCommerce] Promotion Tracking, and then close the panel.
You will now have a basic dashboard with one panel, setting the stage for further customization and enhancement
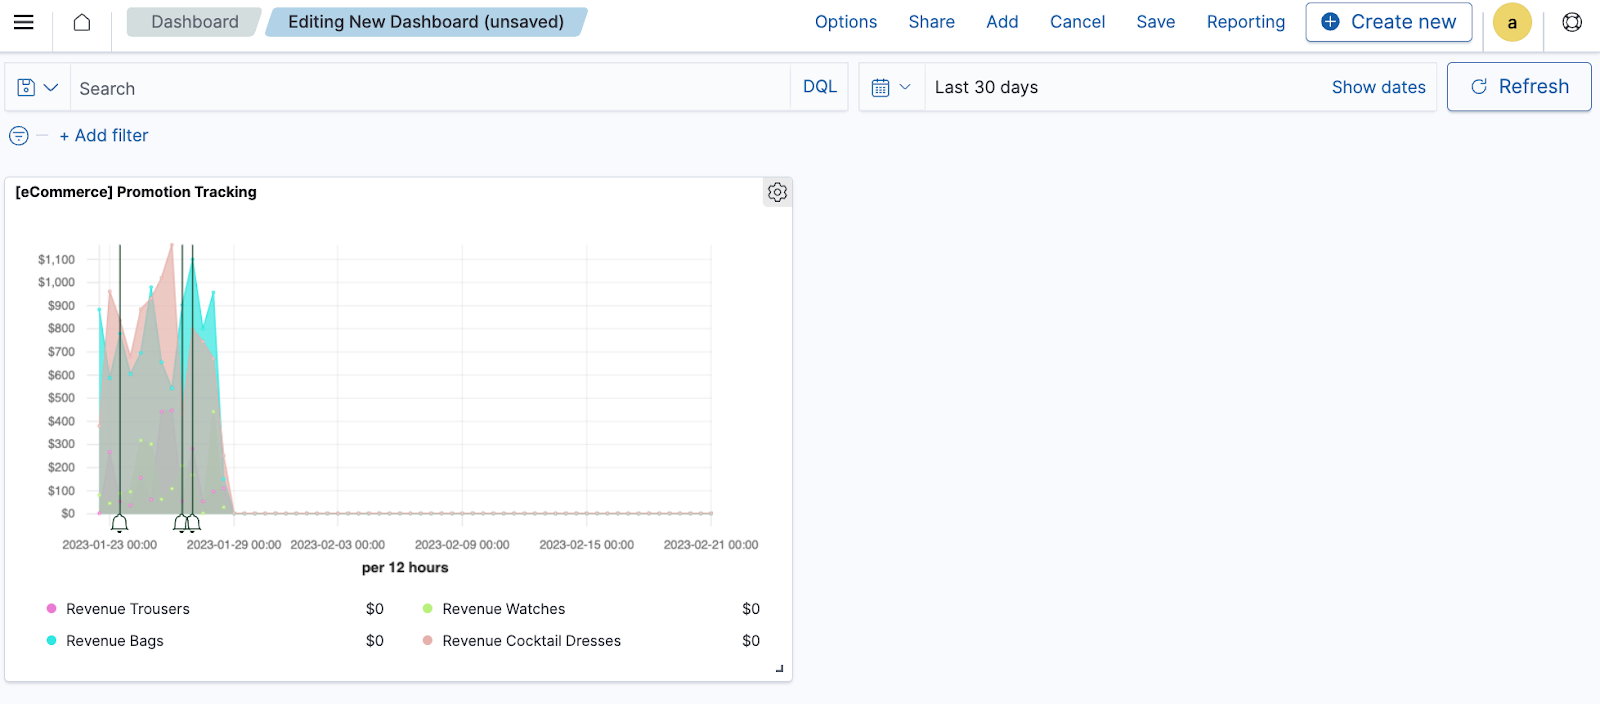
Source: OpenSearch
Create a New Visualization
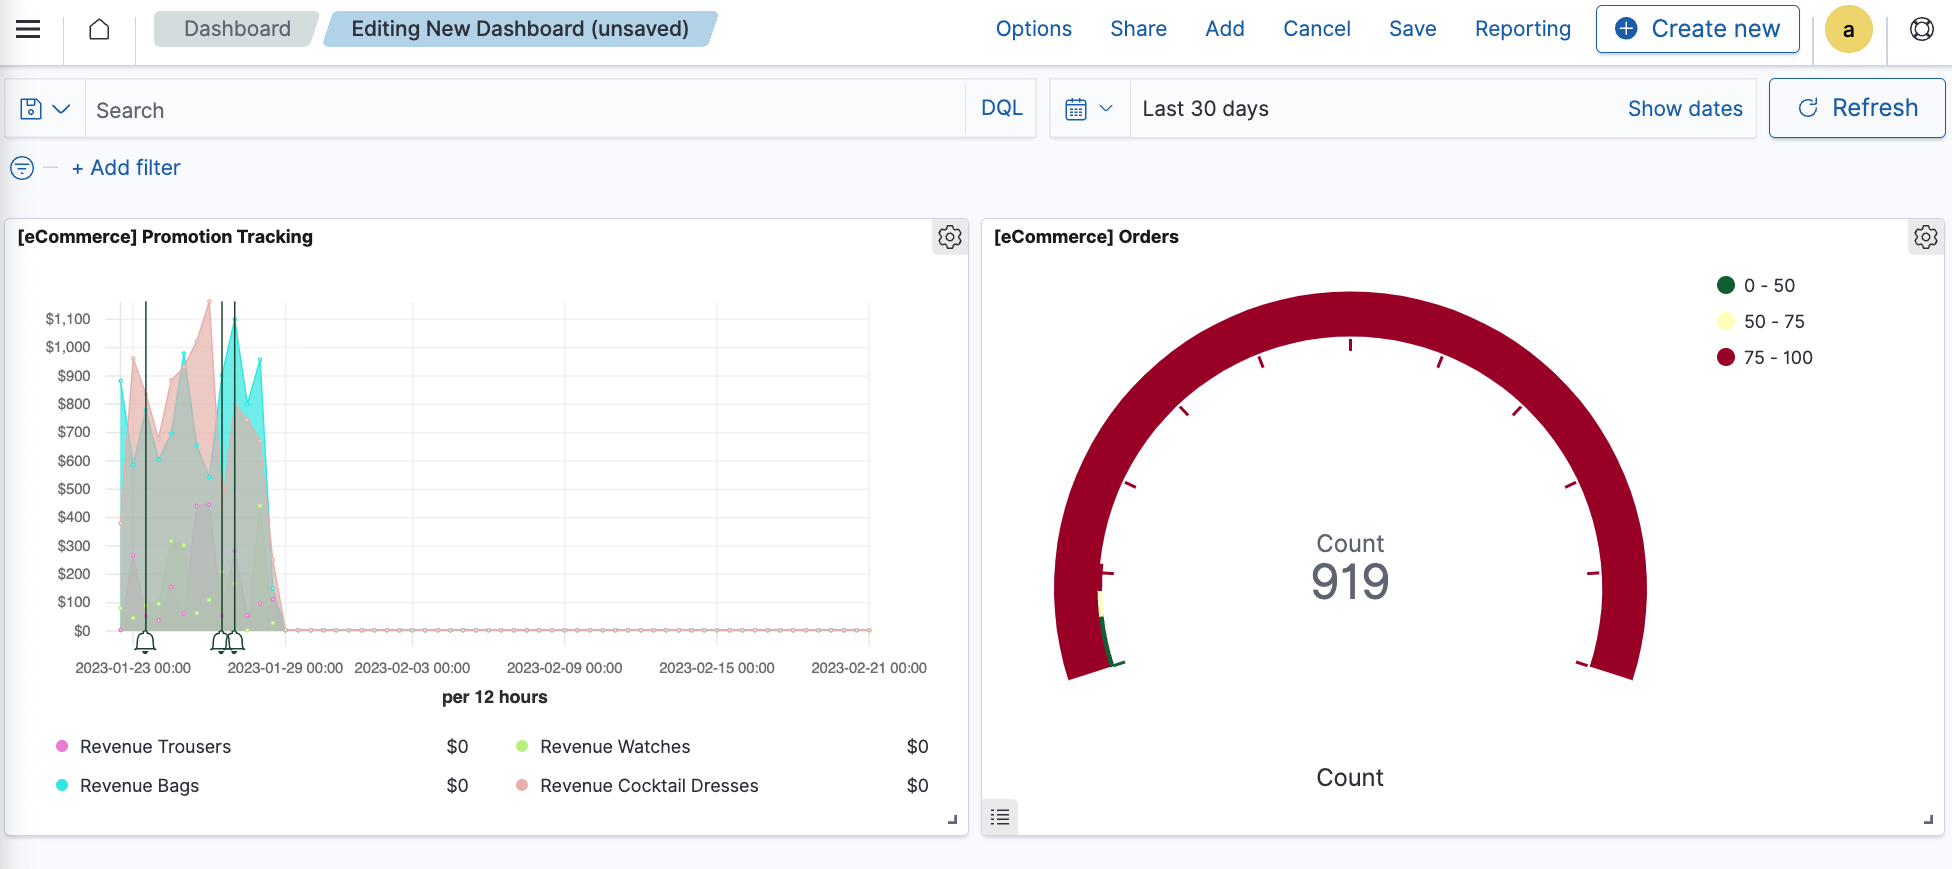
The next task involves creating a new visualization to be added to your dashboard. To start, select Create new from the dashboard toolbar. In the New Visualization window, select Gauge and then designate the index pattern as opensearch_dashboards_sample_data_ecommerce.
After configuring visualization settings, make sure to save your work by selecting Save from the toolbar. A prompt will appear in the Save visualization window, letting you add a title for your visualization. Click Save and return. Your dashboard will show two visualizations.
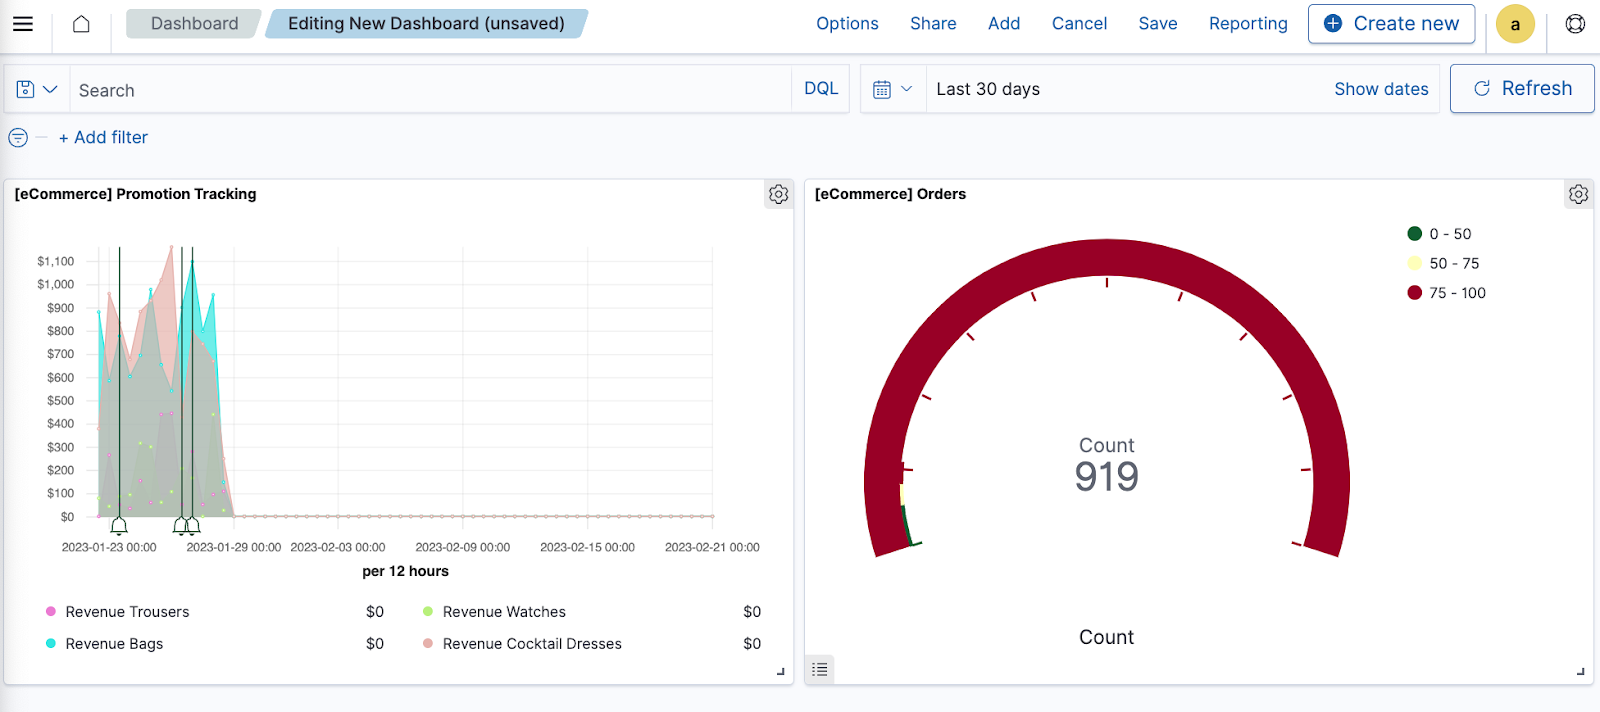
Source: OpenSearch
Add More Panels
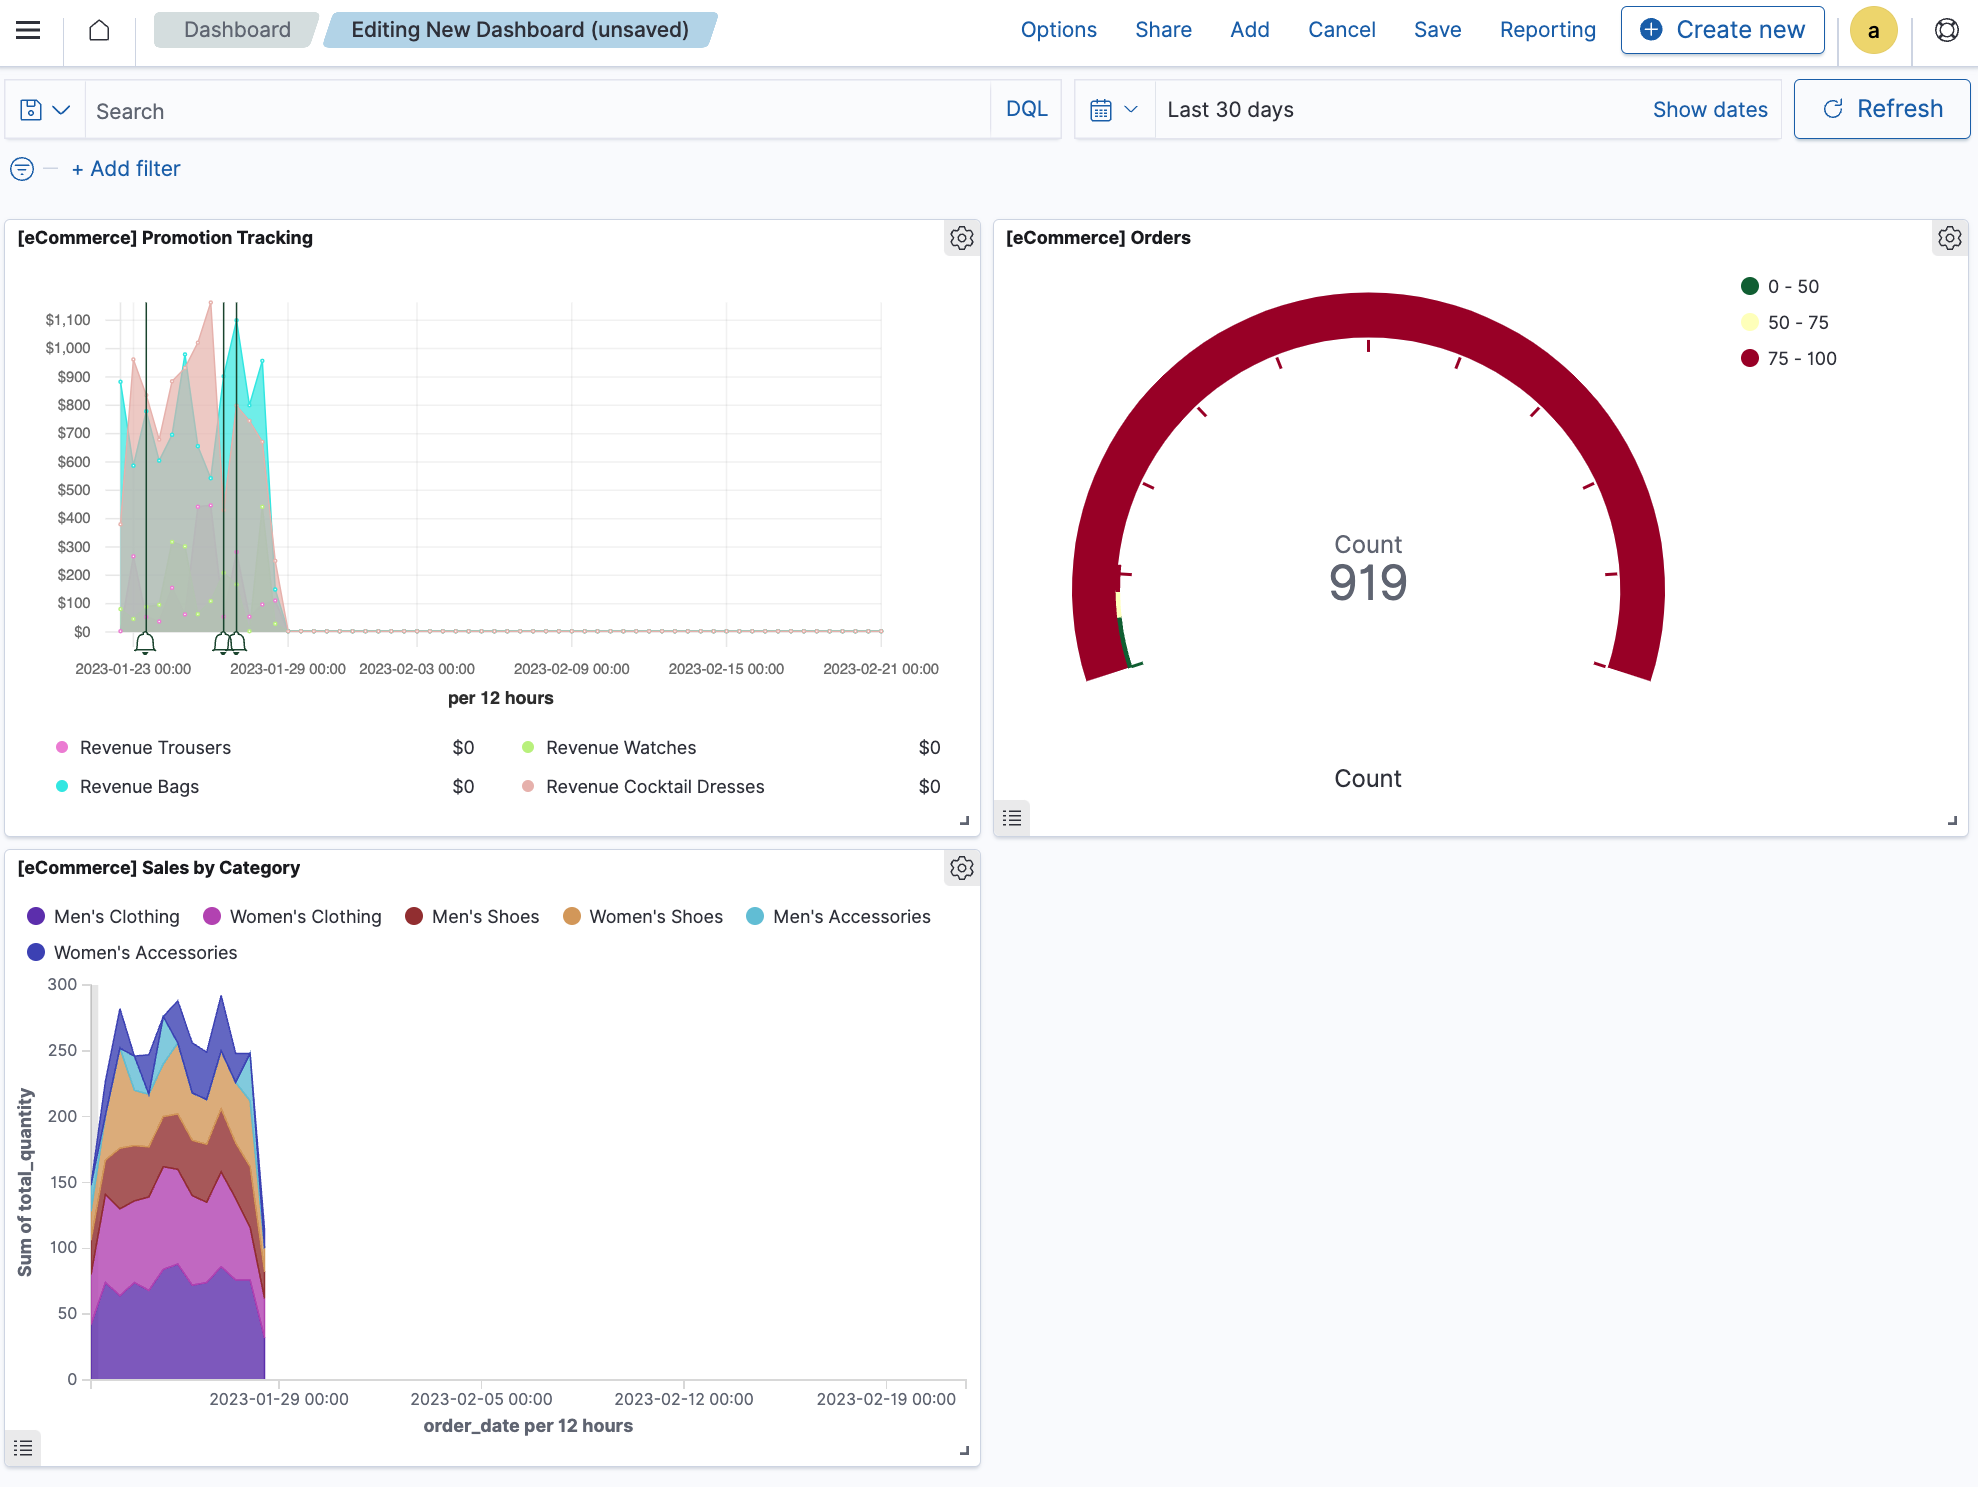
To add more insights to the dashboard, you can add a pre-existing visualization. From the dashboard toolbar, select Add. Within the Add panels window, select [eCommerce] Sales by Category from the available options, then close the Add panels window.
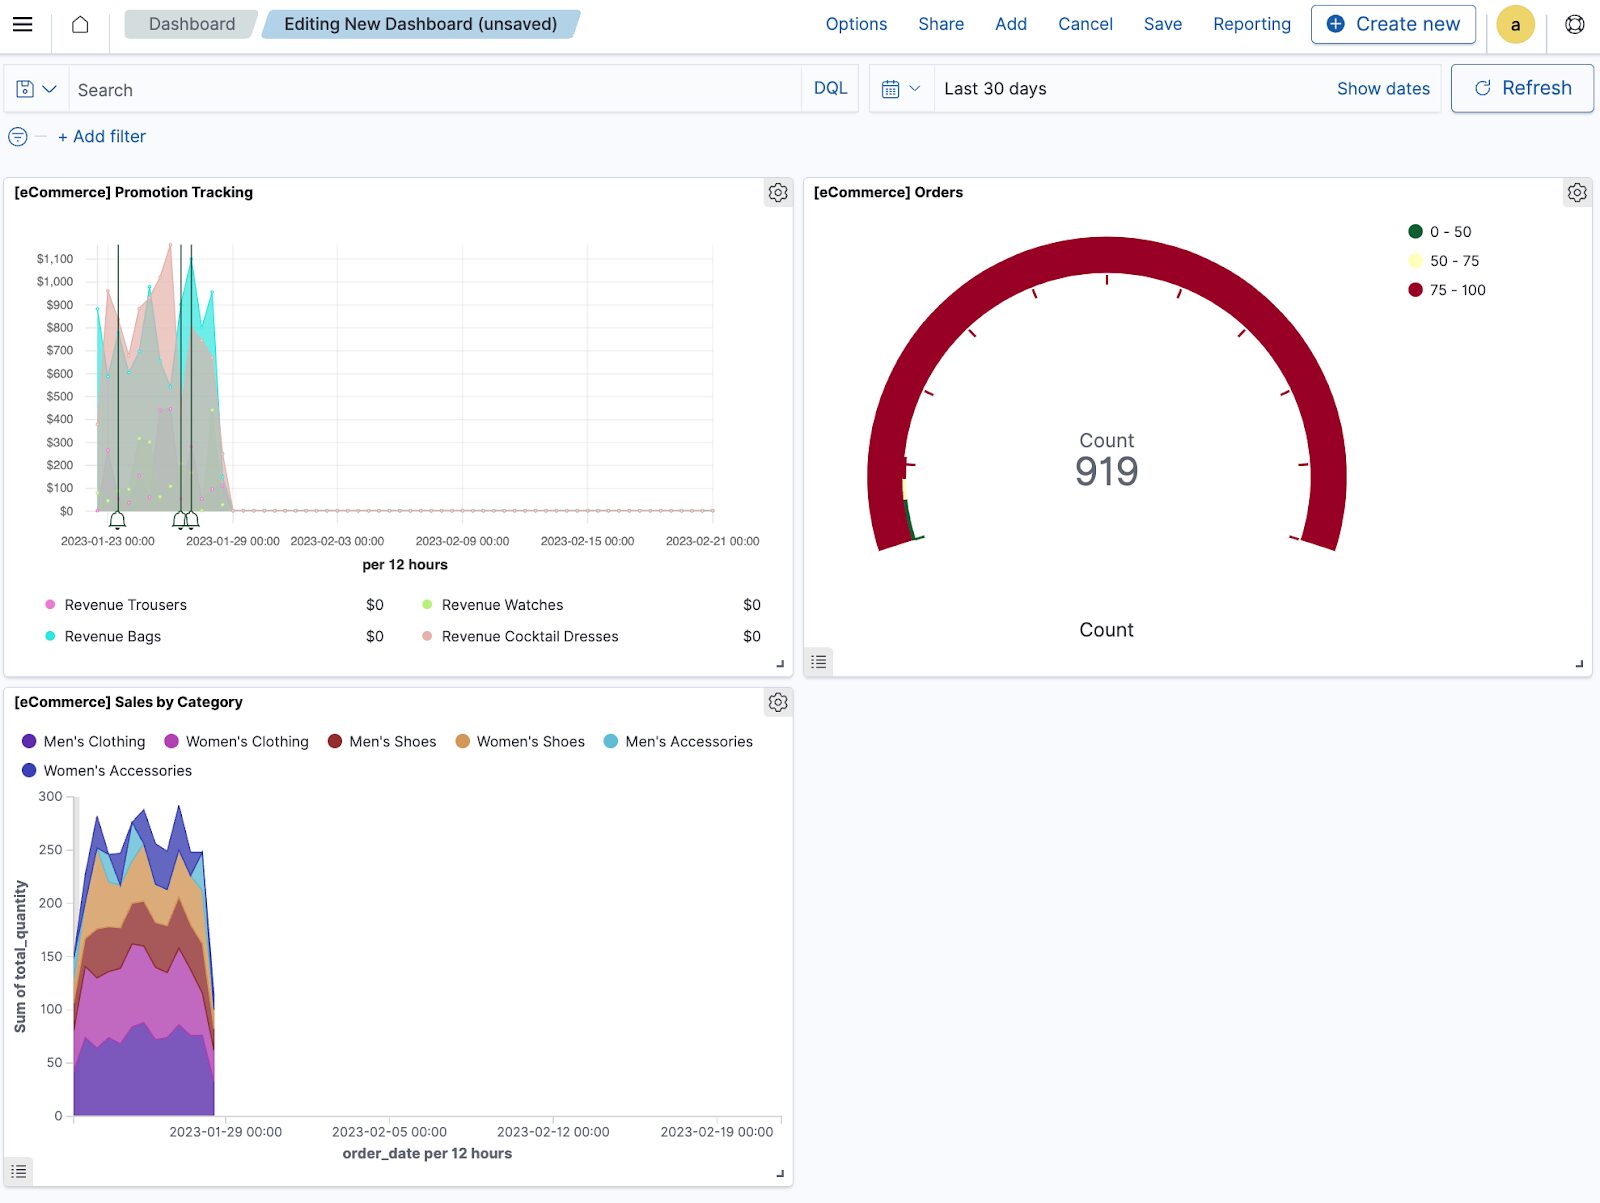
Source: OpenSearch
Quick Tutorial #2: Using the Discover App
The Discover application is a powerful tool within OpenSearch Dashboards that allows for detailed data analysis. This example also uses the OpenSearch Playground.
To use the Discover app:
- From the OpenSearch Dashboards navigation menu, select Discover.
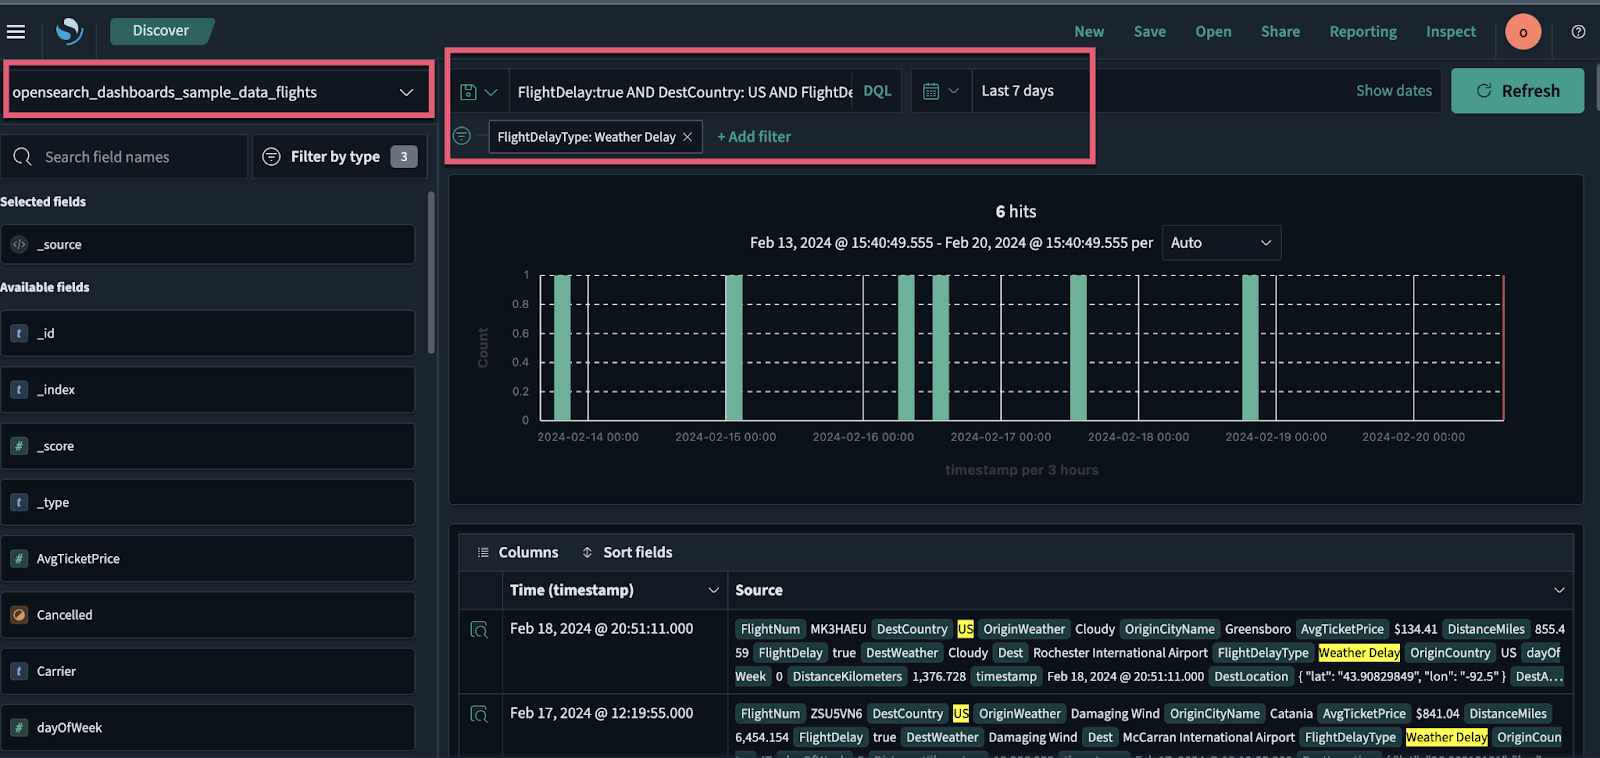
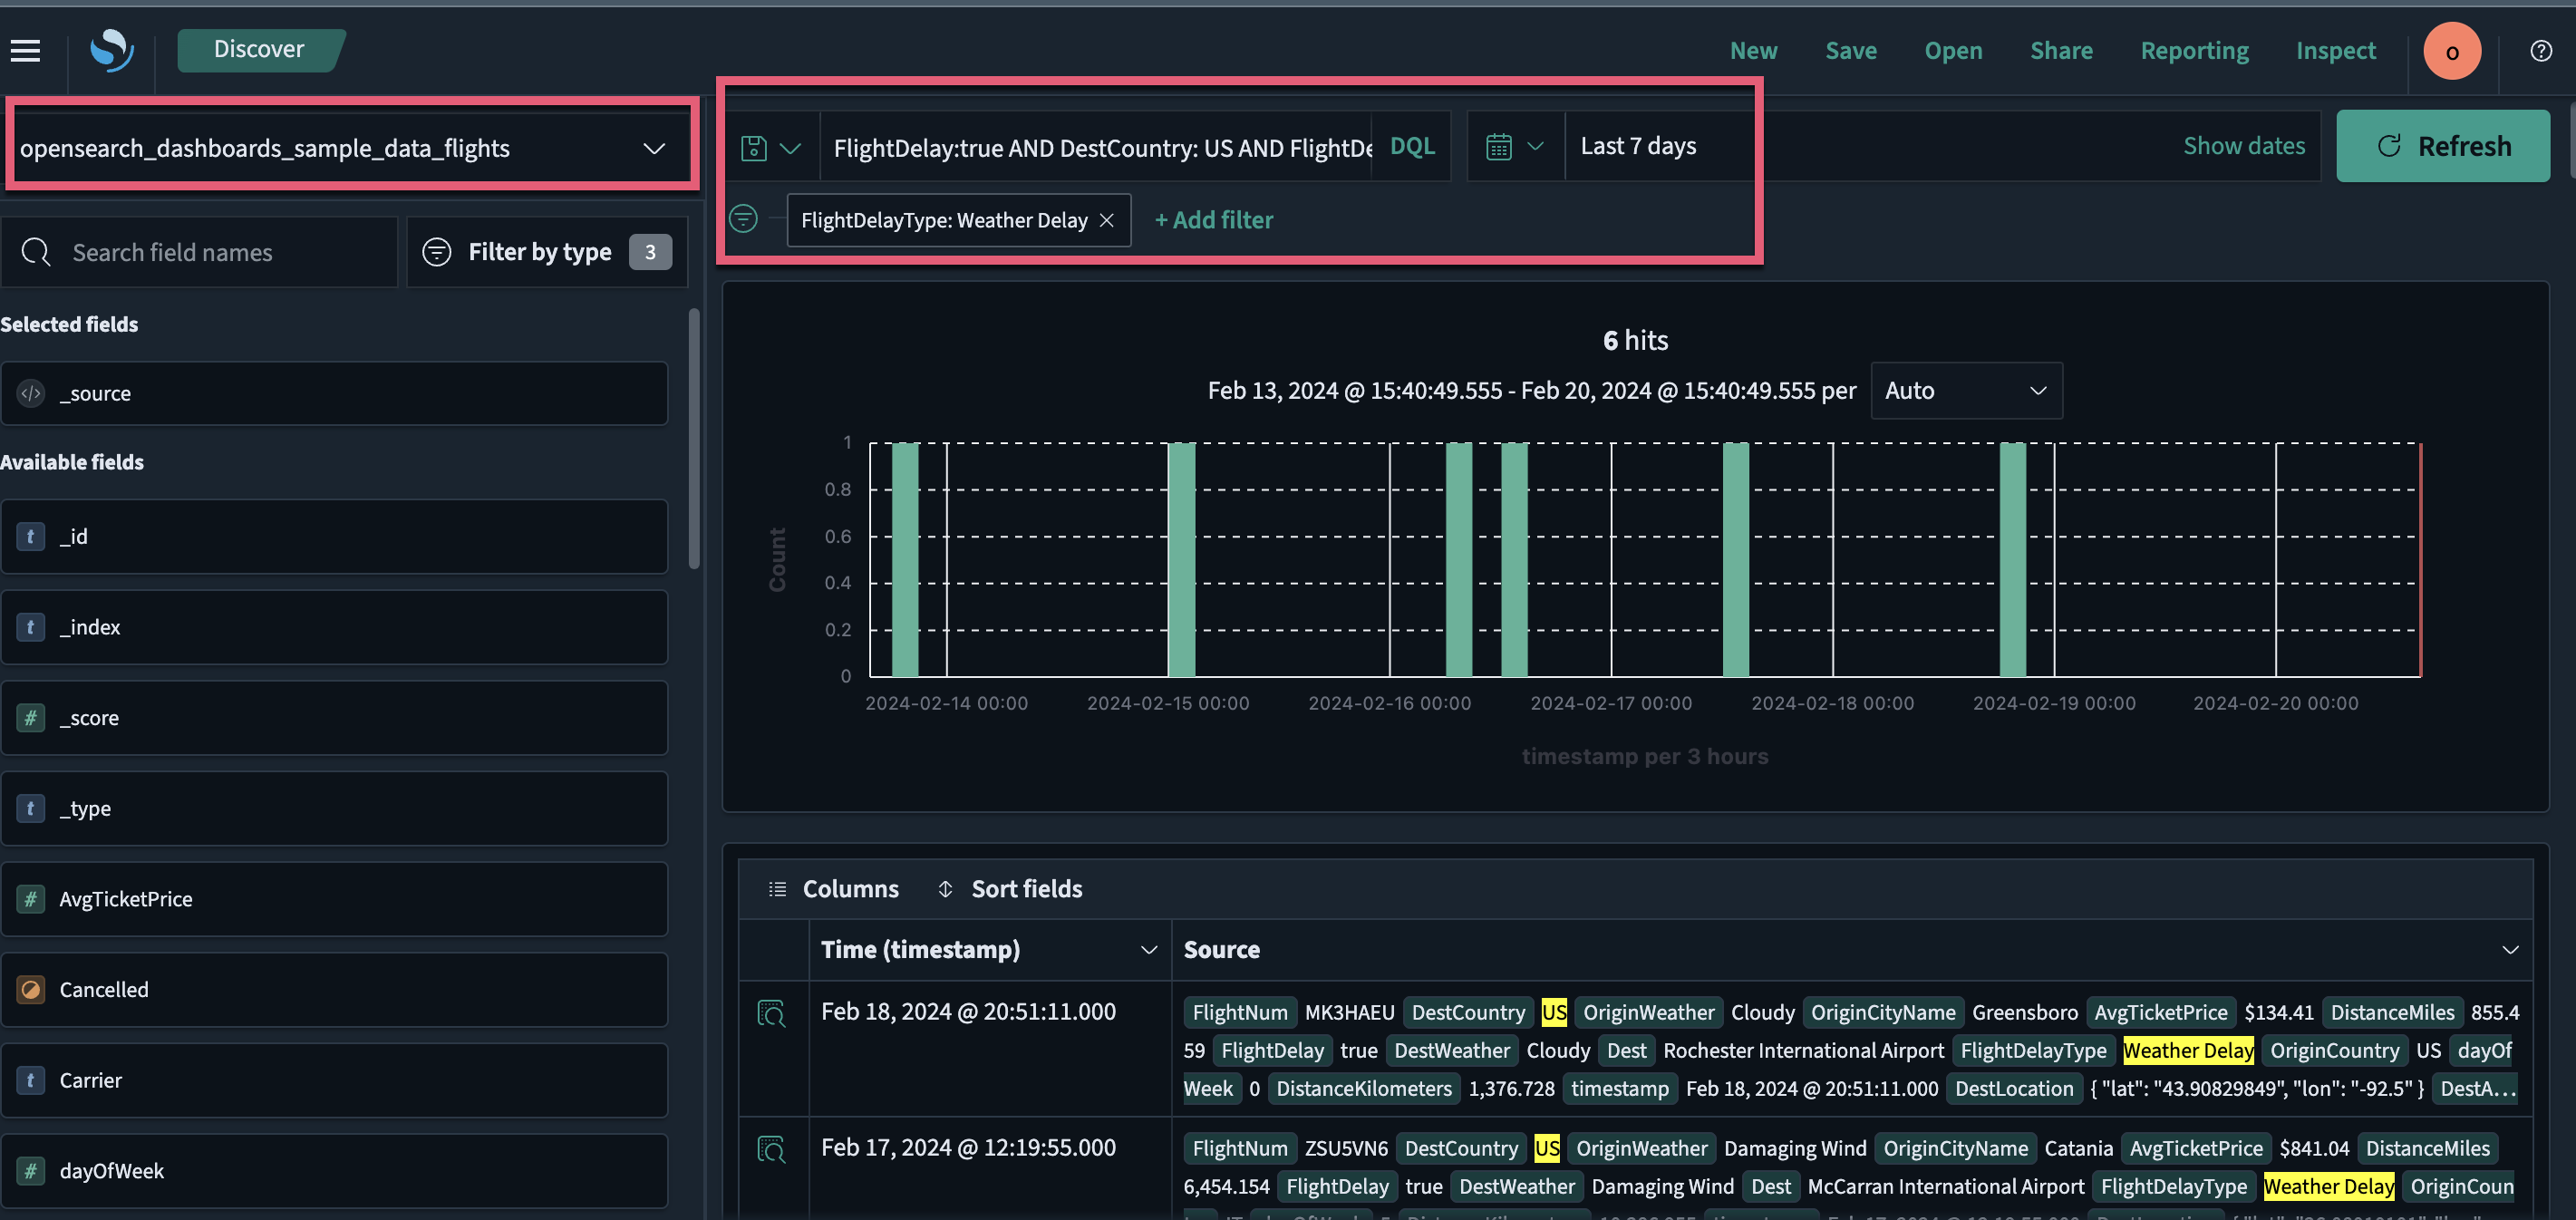
- On the Discover page, select opensearch_dashboards_sample_data_flights from the dropdown menu at the top left.
- Use the calendar icon to change the time filter from the default Last 15 minutes to Last 7 days.
- In the DQL search bar, enter the query FlightDelay:true AND DestCountry: US AND FlightDelayMin >= 60 and click Update to view results for US-bound flights delayed by 60 minutes or more.
- You can further refine your search by selecting Add filter from the DQL search bar and choosing a Field, Operator, and Value. For example, for weather-related delays, select FlightDelayType, is, and Weather Delay.
- Analyze your data through the displayed results, which include the ability to view data in a table, create histograms, and examine individual documents for deeper insights.
Source: OpenSearch
Managed Elasticsearch with Coralogix
Coralogix sets itself apart in observability with its modern architecture, enabling real-time insights into logs, metrics, and traces with built-in cost optimization. Coralogix’s straightforward pricing covers all its platform offerings including APM, RUM, SIEM, infrastructure monitoring and much more. With unparalleled support that features less than 1 minute response times and 1 hour resolution times, Coralogix is a leading choice for thousands of organizations across the globe.

