OpenTelemetry Java: The Basics and a Quick Tutorial

How OpenTelemetry Works with Java Applications
Here is an overview of the components that allow OpenTelemetry to observe Java-based applications.
OpenTelemetry Java API
The OpenTelemetry Java API offers developers the tools needed to capture telemetry data within their applications. It provides interfaces and classes for recording metrics, logs, and traces.
By using this API, developers can add observability to their Java applications in a vendor-neutral manner. This means that the data can be exported to any observability tool that supports OpenTelemetry, without being locked into a specific vendor.
OpenTelemetry Java SDK
The OpenTelemetry Java SDK is the implementation of the API, providing the actual mechanics behind the data capturing process. It is responsible for managing telemetry data, including collection, processing, and exporting to specified backends.
The SDK is highly configurable, allowing developers to tailor data collection according to their needs. For example, users can adjust sampling rates for traces or choose specific metrics to collect, optimizing the observability overhead for their applications.
Auto-Instrumentation Agent
The auto-instrumentation agent is designed to simplify the integration of observability into Java applications. It works by automatically injecting bytecode at runtime to capture telemetry data, eliminating the need for manual instrumentation of the code. This is particularly useful for legacy applications or in scenarios where modifying the source code is not feasible.
The agent supports a range of Java frameworks and libraries, making it easier to achieve comprehensive observability. This automatic instrumentation means that developers can immediately start receiving insights into their application’s performance and behavior without the intricate setup usually required.
Quick Tutorial: Auto-Instrumenting a Java Application with OpenTelemetry
This tutorial shows how to set up and start using OpenTelmetry for a Java application. The tutorial steps and code were adapted from the OpenTelemetry documentation.
Prerequisites
Before you begin instrumenting your Java application with OpenTelemetry, make sure the following are installed on your local machine:
- Java JDK 17+ is required if you’re using Spring Boot 3; for other use cases, Java 8+ is enough.
- Gradle version 7.5 or later is needed for building and running the example application.
This guide uses a basic Spring Boot application for demonstration, but you can apply the principles to other web frameworks such as Apache Wicket or Play.
Set Up the Necessary Dependencies
To set up your environment, create a new directory named java-simple. Inside this directory, create a build.gradle.kts file with the following content:
plugins {
id("java")

  id("org.springframework.boot") version "3.0.6"

  id("io.spring.dependency-management") version "1.1.0"

}

sourceSets {

  main {

    java.setSrcDirs(setOf("."))

  }

}

repositories {

  mavenCentral()

}

dependencies {

  implementation("org.springframework.boot:spring-boot-starter-web")

}
This configuration sets up the necessary plugins and dependencies for a simple Spring Boot web application.
Set Up an HTTP Server
Within the java-simple directory, create a file named DateTimeApplication.java and add the following code to instantiate your Spring Boot application:
package otel;
import org.springframework.boot.SpringApplication;

import org.springframework.boot.Banner;

import org.springframework.boot.autoconfigure.SpringBootApplication;

// This is the main Spring Boot application class.

@SpringBootApplication

public class DateTimeApplication {

  public static void main(String[] args) {

    SpringApplication app = new SpringApplication(DateTimeApplication.class);

    app.setBannerMode(Banner.Mode.OFF); // Disables the Spring Boot startup banner.

    app.run(args); // Starts the Spring Boot application.

  }

}
Next, create another file called DateTimeController.java with the following content, to define a simple REST endpoint that generates a random date and time:
package otel;
import java.time.LocalDateTime;

import java.time.format.DateTimeFormatter;

import java.util.Optional;

import org.slf4j.Logger;

import org.slf4j.LoggerFactory;

import org.springframework.web.bind.annotation.GetMapping;

import org.springframework.web.bind.annotation.RequestParam;

import org.springframework.web.bind.annotation.RestController;

// This class acts as a REST controller for handling requests.

@RestController

public class DateTimeController {

  private static final Logger logger = LoggerFactory.getLogger(DateTimeController.class);

  @GetMapping("/randomdatetime")

  public String index(@RequestParam("player") Optional<String> player) {

    String dateTime = this.getRandomDateTime();

    if (player.isPresent()) {

      logger.info("{} requested a random date and time: {}", player.get(), dateTime);

    } else {

      logger.info("Anonymous request for a random date and time: {}", dateTime);

    }

    return dateTime;

  }

  // Generates a random LocalDateTime within the last 365 days and formats it as a String.

  private String getRandomDateTime() {

    LocalDateTime now = LocalDateTime.now();

    LocalDateTime randomDateTime = now.minusDays((int) (Math.random() * 365));

    DateTimeFormatter formatter = DateTimeFormatter.ofPattern("yyyy-MM-dd HH:mm:ss");

    return formatter.format(randomDateTime);

  }

}

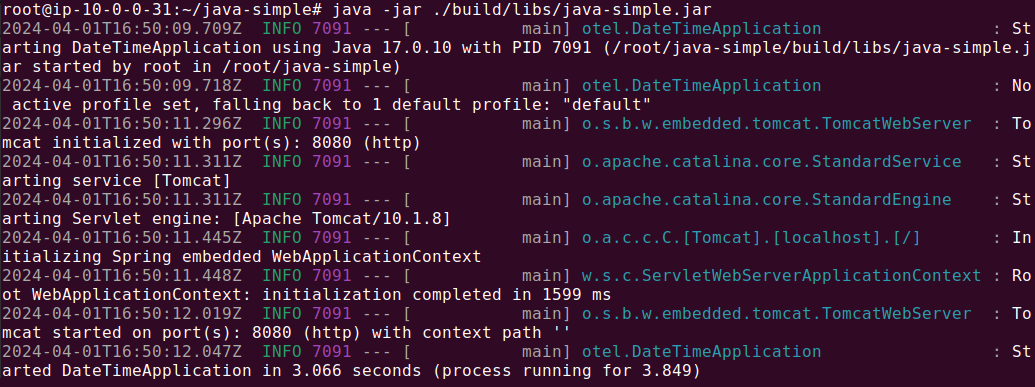
Build and run your application with gradle assemble and java -jar ./build/libs/java-simple.jar, respectively.

Open http://localhost:8080/randomdatetime in your web browser to check that the application is running correctly.

Instrument the Application
To automatically instrument your application, follow these steps:
- Download the opentelemetry-javaagent.jar file from the releases page of the opentelemetry-java-instrumentation repository. This JAR includes the agent and all necessary instrumentation packages.
- Set environment variables to specify the Java agent JAR and configure a console exporter. Replace PATH/TO with the actual path to the downloaded JAR file:
export
JAVA_TOOL_OPTIONS="-javaagent:PATH/TO/opentelemetry-javaagent.jar
"
  OTEL_TRACES_EXPORTER=logging

  OTEL_METRICS_EXPORTER=logging

  OTEL_LOGS_EXPORTER=logging

  OTEL_METRIC_EXPORT_INTERVAL=15000
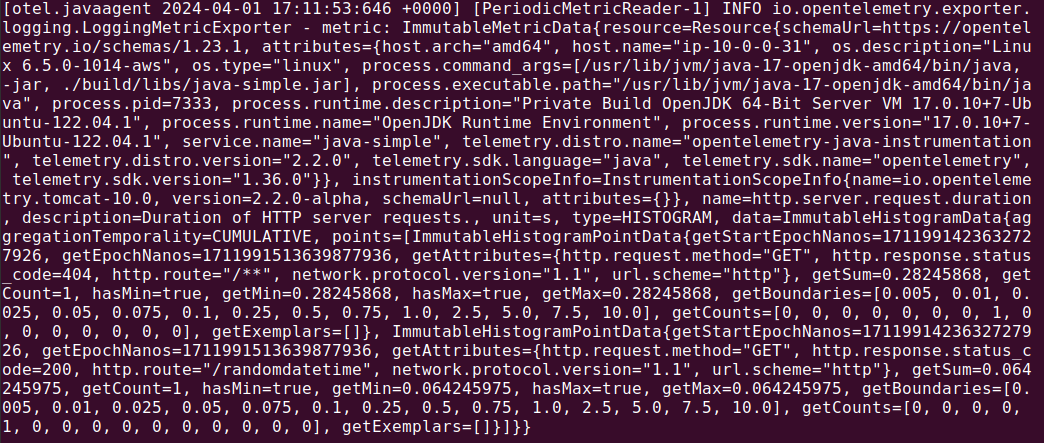
- Run your application again using the same command as before. This time, the application will be instrumented automatically, emitting traces, metrics, and logs to the console.
- To test the instrumentation, send a request to your application using curl localhost:8080/rolldice from another terminal.
- When you’re ready to stop the server, you’ll see the output of all the metrics collected, along with trace and log output from both the server and the client, demonstrating the successful instrumentation of your application with OpenTelemetry.

Managed Application Observability with Coralogix
Coralogix sets itself apart in observability with its modern architecture, enabling real-time insights into logs, metrics, and traces with built-in cost optimization. Coralogix’s straightforward pricing covers all its platform offerings including APM, RUM, SIEM, infrastructure monitoring and much more. With unparalleled support that features less than 1 minute response times and 1 hour resolution times, Coralogix is a leading choice for thousands of organizations across the globe.

