Total Blocking Time (TBT): 5 Ways to Improve Your Score

What Is the Difference Between TBT and TTI?
TBT is similar to another web performance metric—Time to Interactive (TTI). While both TBT and TTI are important indicators of user experience, they measure different aspects of performance.
Time to Interactive measures the time it takes for a page to become fully interactive. A page is considered fully interactive when it displays useful content, event handlers are registered for most visible page elements, and the page responds to user interactions within 50 milliseconds.
Total Blocking Time measures the total amount of time that a page is blocked from responding to user input, such as clicks, screen taps, or keyboard presses.
The key difference between the two is that while TTI measures the time until the page becomes fully interactive, TBT measures the total amount of time that the main thread is blocked, long enough to prevent input responsiveness. TTI is about how soon a page can be interactive, while TBT is about how often it is not. Both are crucial for improving a web page’s responsiveness to user input.
What Is a Good TBT Score?
A good Total Blocking Time score is as low as possible. The lower the TBT score, the less time users have to wait for the page to become fully interactive.
According to Google’s performance metrics, a TBT score of less than 200 milliseconds is considered ‘good’, while a score between 200 and 600 milliseconds ‘needs improvement’, and anything above 600 milliseconds is considered ‘poor’.
Having a low TBT score is important for providing a seamless user experience. If a webpage has a high TBT, it means that users might experience lag when trying to interact with the page, leading to a frustrating user experience.
How to Measure TBT
Chrome DevTools
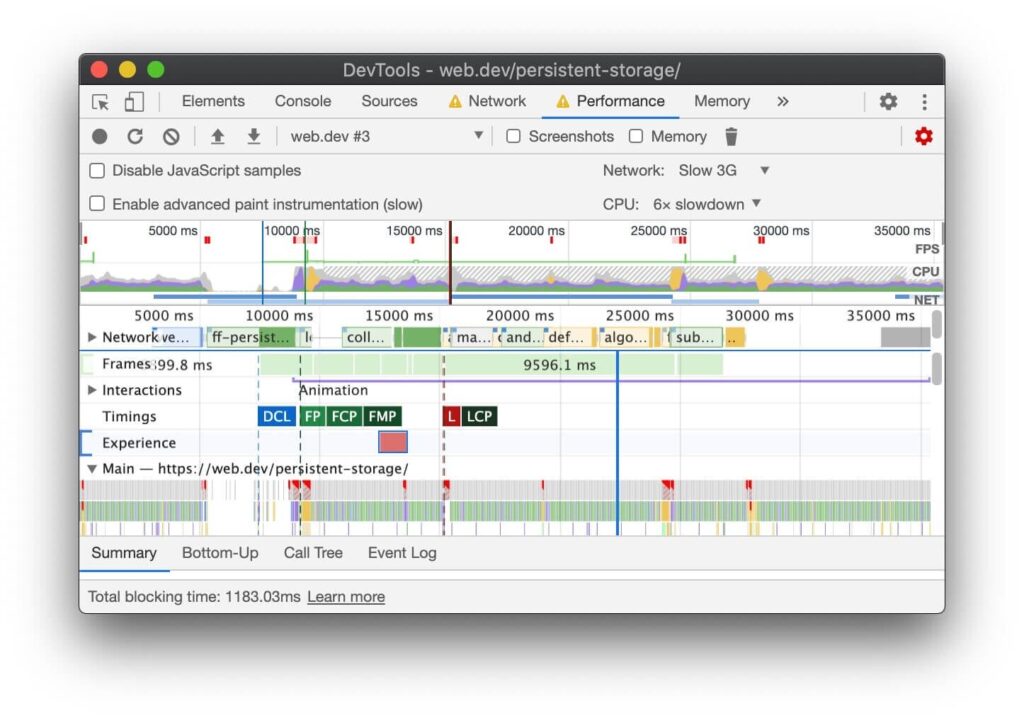
Chrome DevTools is a set of web developer tools built directly into the Google Chrome browser. It is one of the most straightforward tools for measuring TBT. To use it, you need to open DevTools, go to the Performance tab, click the Record button and manually reload the page to record a new performance profile.
Once the recording is done, you will see a section called Main. Here, you can see all the tasks that are blocking the main thread—they appear as grey bars flagged red. By hovering over these tasks, you can see what scripts are causing your page to become unresponsive and optimize them. The footer shows your total blocking time.

Source: Chrome Developers
Lighthouse
Lighthouse is an open-source, automated tool designed by Google for improving the quality of web pages. It has audits for performance, accessibility, progressive web apps, SEO, and more.
In the Lighthouse report, Total Blocking Time is one of the six metrics tracked in the performance score. The TBT score represents the total time, in milliseconds, where input latency exceeds 50ms during the window between First Contentful Paint and Time to Interactive.
WebPageTest
WebPageTest is another tool for measuring Total Blocking Time. It is an online tool that allows you to run free website speed tests from multiple locations around the globe using real browsers and real consumer connection speeds.
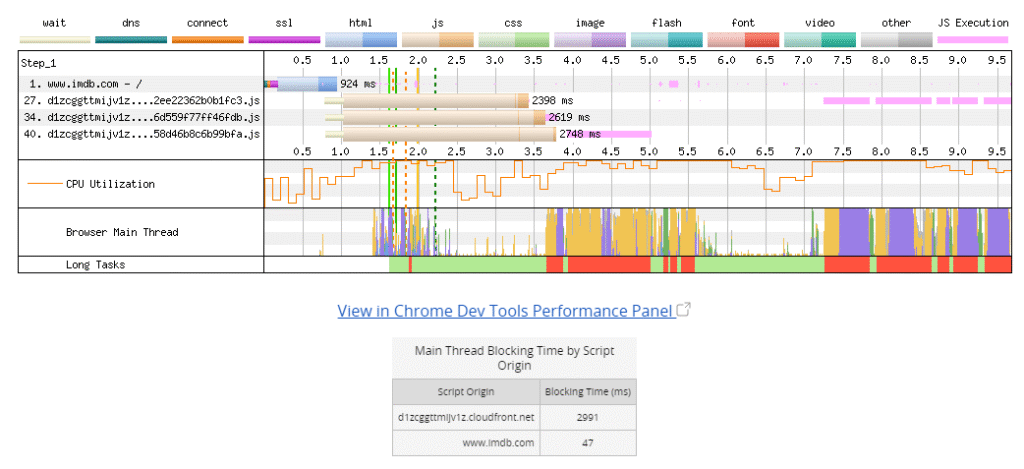
In the WebPageTest report, under the Web Vitals section, one of the metrics shown is Total Blocking Time. You can also visualize the long tasks contributing to TBT and the main thread blocking time of each script, as shown below.

Source: WebPageTest
Note: Google PageSpeed Insights, Google Search Console, and Chrome User Report (CRuX) do not directly show the TBT metric.
How to Reduce and Optimize Total Blocking Time
1. Reduce the Impact of Third-Party Scripts and Plugins
One of the critical steps in reducing the TBT is reducing the influence of outside code on your website. This includes third-party scripts or plugins that require extensive loading time, thereby increasing the blocking time.
You can start by auditing your website’s third-party scripts. Use performance tools like Google’s Lighthouse to identify which scripts are causing high blocking time. Once identified, you can either remove these scripts, defer their loading, or load them asynchronously. These steps can significantly reduce the blocking time and improve the overall performance of your website.
2. Reduce Work That the Main Thread is Doing
The main thread is responsible for executing JavaScript, parsing HTML and CSS, and layout and paint tasks. When the main thread is overloaded, it leads to a high Total Blocking Time.
To reduce the work the main thread is doing, you can adopt strategies like code splitting and offloading tasks to web workers. Code splitting allows you to break down your JavaScript into smaller chunks that can be loaded and executed as needed, while web workers let you run scripts in the background, reducing the load on the main thread.
3. Minimize the Size of CSS and JavaScript
Large assets like CSS and JavaScript files contribute significantly to a high Total Blocking Time. Minimizing the size of these assets can help in reducing the TBT.
For CSS and JavaScript files, consider minifying them, which involves removing unnecessary characters like white spaces, line breaks, and comments. This not only reduces the size of these files but also helps in reducing the parsing and execution time.
Another way for reducing the size of CSS and JavaScript is to write more efficient code and use modern JavaScript features. Tools like Webpack and Babel can help in optimizing your JavaScript, making it run faster and more efficiently.
4. Remove Any Unused CSS and Javascript Code
Unused CSS and JavaScript code not only add to the size of your website assets but also increase the Total Blocking Time. It is essential to regularly audit your website’s codebase and remove any redundant or unused code.
Tools like CSS Unused and PurgeCSS can help in identifying and removing unused CSS. For JavaScript, consider using tree shaking techniques that eliminate unused code from your final bundle.
5. Decrease the Time It Takes JavaScript to Run
JavaScript execution time is a significant contributor to Total Blocking Time. Decreasing the time it takes for JavaScript to run can substantially optimize TBT.
In conclusion, Total Blocking Time is a critical performance metric that can significantly impact the user experience. By adopting the strategies outlined above, you can effectively reduce and optimize the TBT, ensuring a smooth and efficient interaction for your users. Remember, a well-optimized website not only provides an excellent user experience but also contributes to better SEO rankings and increased user engagement.
Have Better Insights on Total Blocking Time with Coralogix
Coralogix gives you full visibility into your website, don’t waste any more time trying to figure out why the total blocking time is suffering. Utilize the Coralogix platform, and our RUM features to optimize your site.


