 The new standard of observability is here. Discover Olly, the industry’s first
Catch all your data directly from the kernel
Zero instrumentation with OBI
Remove the need for coding instrumentation or managing language-specific agents. OBI (OpenTelemetry eBPF Instrumentation) helps you start capturing full-fidelity telemetry, quickly, from any runtime or language, with near-zero overhead.
One instrumentation solution for all your services

Catch everything, no code, no language agents
OBI auto-instruments every service, even legacy or mixed stacks, right from the kernel. No SDK’s needed.

Deploy in 1-click with one command
One Helm install drops a DaemonSet. No dev work, no CI tweaks. Your stack lights up in minutes.

Predictable ultra-light footprint you can scale
OpenTelemetry-native, OBI runs at < 1 % CPU per node, so you can scale across any stack.
Instrument all your data with one simple install
Capture all data from the source
OBI hooks directly into the Linux kernel, intercepting every request, regardless of language, runtime, or binary. Gain instant, comprehensive system-level visibility into services you can’t or won’t modify. It collects full context, auto-builds spans and RED metrics, and streams real-time, ready-to-use observability data, without touching a line of code.
Complete telemetry, one install away
Drop OBI as a deamonset using a single Helm command and watch your stack light up. Deploy once, without changes, downtime CI tweaks, or service restarts. Works the same on EKS, GKE, OpenShift, bare-metal, or air-gapped setups. Fastest path from zero data to live dashboards for any service, with zero developer overhead.
Built for speed and for scale
OBI is OpenTelemetry-native, so no proprietary formats or lock-ins. Its eBPF Kernel-level executions are pre-verified and sandboxed. They JIT-compile to micro-seconds of work per event, so your high-traffic services stay fast and your overhead stays low, with < 1 % CPU per node. eBPF attaches safely to syscalls and network activity, tracking every request in real time with microsecond overhead.
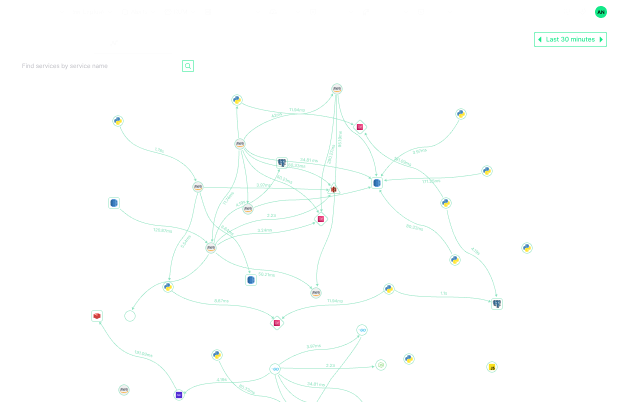
From raw data to automatic insight
Minutes after install, spans and metrics surface as dashboards, a live service map, and drill-downs linking each trace to its logs and metrics. Smart alerts flag latency or error spikes, while index-free storage keeps costs low and searches fast for automatic observability with no coding overhead.
Scalable observability for your systems
Scalable observability for your systems
In-stream analysis
Continuous, real-time monitoring of AI interactions, detecting risks and performance issues before they impact users.
Infinite retention
Ensures historical AI data remains accessible for long-term trend analysis and deep troubleshooting without data loss.
DataPrime engine
Tracks token usage and suspicious resource consumption, helping teams prevent cost overruns while maintaining AI efficiency.
Remote, index-free querying
Lightning-fast searches without the overhead of indexing, ensuring real-time AI observability without unnecessary storage costs.