Introducing “Explain Flame Graph”: Stop Fighting Fires and Start Explaining Them

In a modern observability deployment, it’s simple to get data that helps you understand where your system is failing. However, when we try to understand why, the answer is often buried beneath a mound of stack traces. For many developers, attempting to interpret a flame graph by manually calculating self-time (the resources consumed by the function itself) versus child-frame latency (the time spent waiting on called sub-functions) is both confusing and time-consuming.
Today, Coralogix is removing these barriers with the Explain Flame Graph capability: an AI-powered analysis engine that navigates the complexity of profiling data for you, identifying bottlenecks and suggesting code-level optimizations in seconds.
Explain Flame Graph = Profiling for Everyone
Most observability platforms provide visualizations, and it often stops there. Once the frames pile on a developer, they are expected to become profiling experts, capable of manually chasing down errors. In high-velocity organizations, team time is the most valuable resource. The Explain Flame Graph shifts the burden of analysis from the human to the platform.
Democratizing Performance
No one should need a PhD in systems architecture to unearth a bottleneck. We enable any developer of any profiling ability to pinpoint the precise functions consuming excessive resources. We do this by transforming millions of raw stack trace samples into crystal-clear, AI-analyzed insights.
Continuous Evolution
Static reports stagnate the moment new code is deployed. Our flame graph analysis adapts as the application evolves. The engine continuously monitors your production environment, ensuring that root cause identifications and recommended fixes stay relevant to your current deployment and real-world application behavior.
Efficiency as Governance
Reducing CPU cycles is about cloud costs and sustainability. AI-driven Continuous Profiling gives organizations the ability to identify inefficient code paths and wasteful resource patterns. This allows for optimizations that reduce both infrastructure spend and carbon footprint.
How to Navigate the Flame Graph
To fully appreciate the way our AI simplifies the optimization process, we need to understand the map it is navigating. In this context, the flame graph is a visualization of hierarchical data, where every element represents a specific dimension of resource consumption.
The Visual Logic
- The X-Axis (Total CPU Usage): Unlike a traditional timeline, the x-axis does not represent time passing. Instead, it represents total CPU usage. The functions are sorted alphabetically to help you locate specific methods across the profile.
- The Y-Axis (Stack Depth): The y-axis represents the call hierarchy or stack depth. A function placed directly above another is its parent, showing the sequence of active function calls at the moment of collection.
The AI Layer Answers the Why
Atop this structural data sits the Explain Flame Graph capability. It is an AI-powered analysis engine with three main abilities:
- Automated Navigation: Instead of manually calculating widths, the AI scans the entire map of frames for you.
- Bottleneck Detection: The engine identifies “hotspots” like heavy serialization, compression paths, or repeated reallocations in tight loops that are disproportionately consuming resources.
- Suggested Fixes: The AI provides recommended fixes that adapt as your application evolves, turning a complex visualization into an actionable work plan.
Example Use-Case: From CrashLoop to Code Fix
In high-velocity environments, the difference between a minor performance snag and a system-wide situation often comes down to a single line of inefficient code.
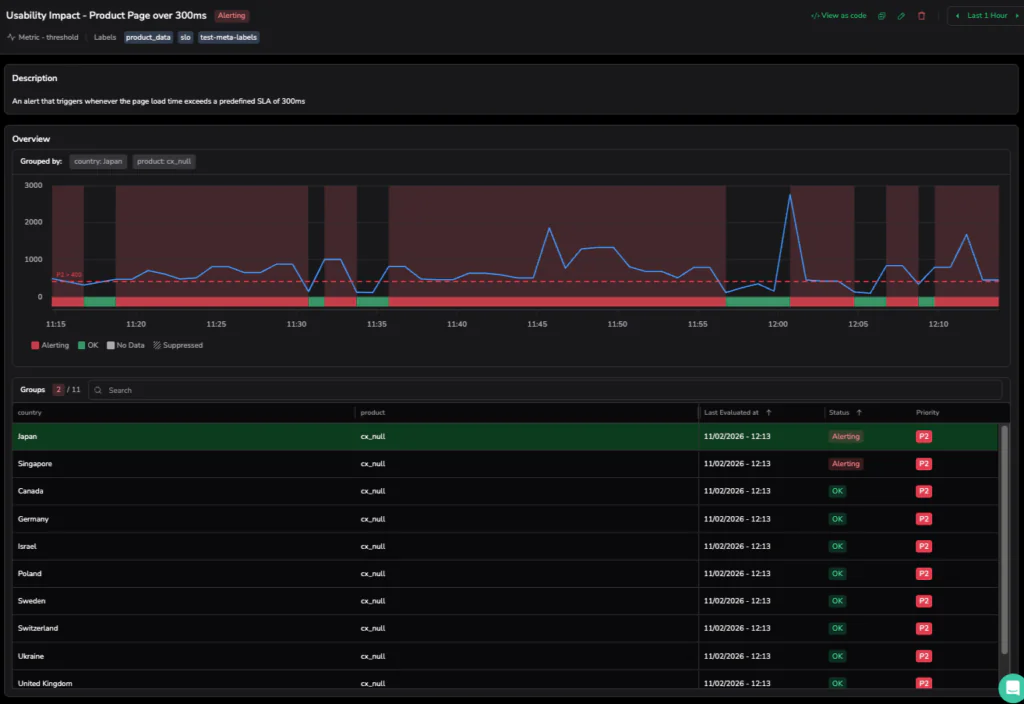
Step 1: The 400ms Breach (11:15 AM – 12:15 PM)
Our investigation opens at 11:15 AM with a triggered alert. Monitoring is all about precision, and our Coralogix alert, defined by a strict Terraform blueprint, is tuned to ignore operational static. While our internal SLA for the Product Page is a clean 300ms, the P2 incident only triggers when the avg(product_latency_by_country) sustains a breach of 400ms for over a minute.
On this particular morning, as the load intensified, the frontend hit a performance bottleneck. This impacted critical user journeys as it degraded UX in a measurable way. The dashboard in the screenshot below shows the metric line aggressively climbing past that 400ms redline. This signifies a Usability Impact that threatens the cleanliness of our user experience.
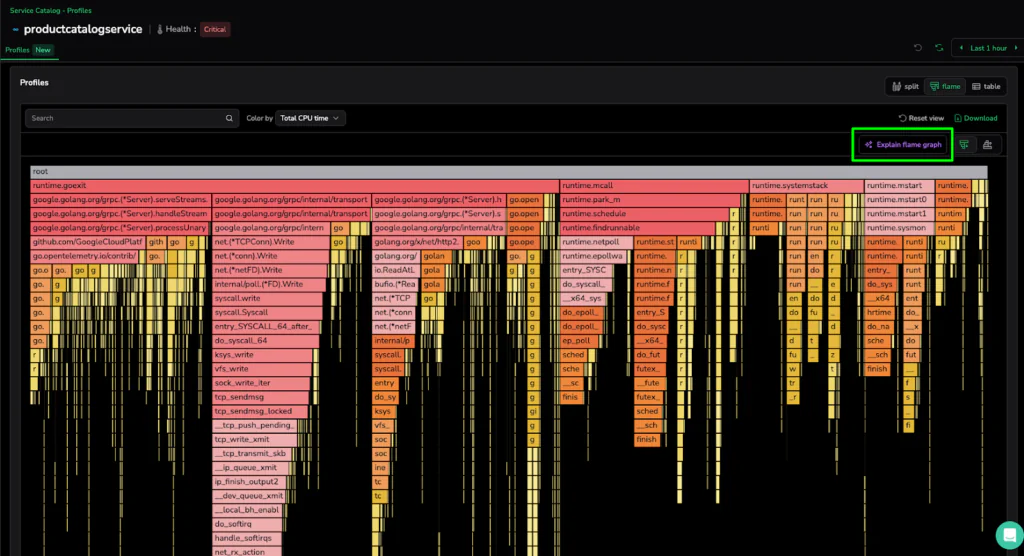
Step 2: Navigating the Specialist Domain (12:26 PM)
We pivot from the high-level alert to the Continuous Profiling dashboard for the productcatalogservice, which is currently in a Critical health state. Continuous Profiling is a specialist tool, an eBPF-powered engine designed to provide extremely fine-grained insights into kernel-level processes and deep-code execution.
As we are met with a “mountain of frames,” the visual complexity reveals the power of the platform: massive horizontal bars for google.golang.org/grpc and syscall.write indicates significant CPU time spent on network transmission and internal system calls. While a profiling expert can manually trace these parent-child hierarchies to find the source of the 1.07m CPU cycles, not every engineer is a specialist. This deep diagnostic data is essential for organizational experts, but for first-line support or generalist developers, the sheer volume of stack traces represents a significant investigation hurdle.
Step 3: Actionable Intelligence
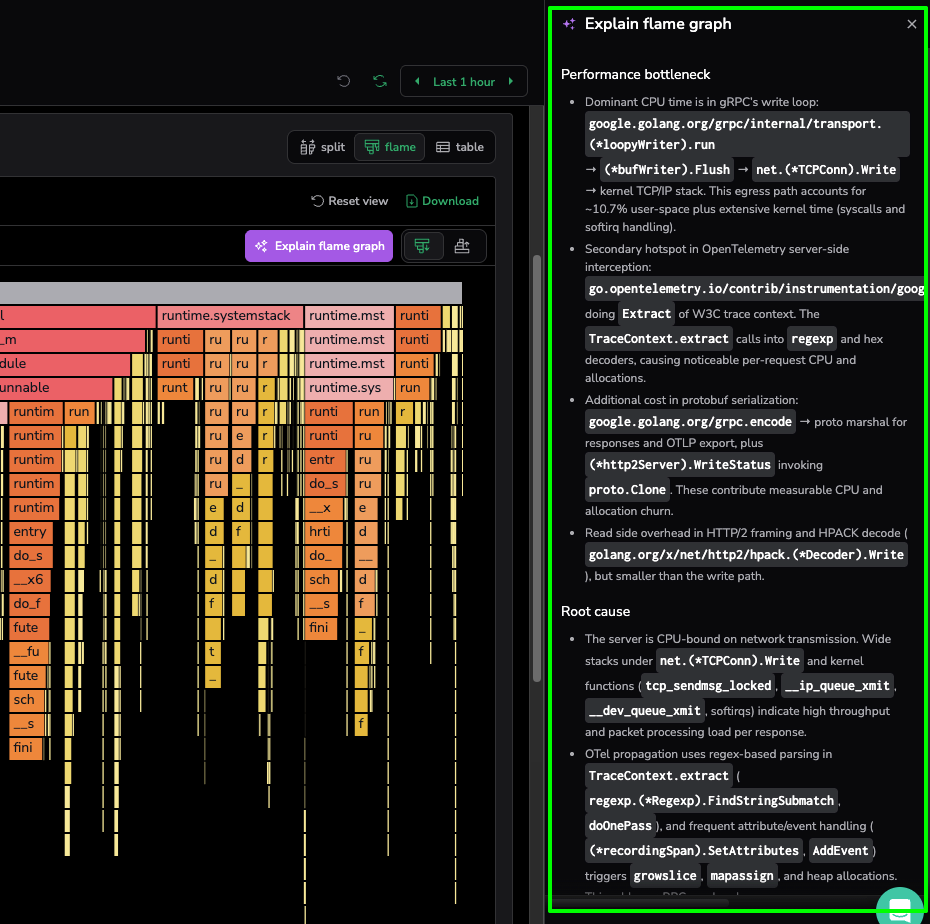
Instead of manually tracing the hierarchies across a mountain of frames, the developer clicks “Explain flame graph”. This triggers the AI-powered analysis engine to navigate millions of raw stack trace samples, transforming specialist-level data into a readable summary that aids the investigation for any developer or support engineer.
The tool has provided us with a clear diagnostic summary:
- The Problem: The service is struggling to send data over the network, with the CPU getting stuck in the gRPC write loop and kernel tasks.
- The Hidden Culprit: A major hotspot is found in OpenTelemetry, where inefficient regex parsing is wasting CPU cycles every time a request is processed.
- Memory Pressure: The engine also flags protobuf serialization as a source of “allocation churn,” which forces the system to spend too much energy managing memory.
- The Fix: The AI suggests upgrading OpenTelemetry to a version that doesn’t use regex and tuning gRPC buffer sizes to handle data more efficiently.
Scaling Insights as a New Standard of Governance
The ability to transition from a sustained latency breach to a specific code-level fix marks a fundamental shift in how organizations manage performance. With the Explain Flame Graph, we are not replacing the deep diagnostic power of profiling. We are making it more accessible. Continuous Profiling will remain a powerful specialist tool designed for granular, kernel-level investigations, with its value no longer locked behind organizational expertise.
From resolving critical latency breaches to uncovering hidden serialization bottlenecks, the AI unearths the performance realities that aggregate metrics simply miss. Ultimately, the goal of modern observability is to stop fighting fires and start explaining them. With the Explain Flame Graph, any user, regardless of their profiling expertise, can unearth a bottleneck, apply a suggested fix, and demonstrate the impact on system stability and cloud spend. We have moved past the era of manual investigation into a world of high-velocity deployments supported by clear, automated insights serving as a new standard for operational governance.