Advanced Techniques for Monitoring Traces in AI Workflows
Modern generative AI (GenAI) workflows often involve multiple components—data retrieval, model inference, and post-processing—working in tandem. Monitoring traces and spans (the detailed records of these interactions) is essential for reliable performance.
AI agents quickly become black boxes without robust tracing, making errors difficult to pinpoint. Even a short script interacting with a large language model (LLM) may trigger dozens of downstream calls, and lacking visibility into each step can obscure the root causes of slowdowns or failures.
A late 2023 survey noted that 55% of organizations were piloting or deploying generative AI. Yet, many experienced:
- Delayed responses that frustrate end users
- Undetected errors that propagate through services, undermining reliability
Advanced monitoring techniques that focus on traces and spans address these challenges head-on. By providing end-to-end AI observability, teams can:
- Catch bottlenecks in real-time
- Accelerate troubleshooting
- Reduce mean time to resolution (MTTR)
Identifying the root cause of performance issues becomes far more complex without such capabilities. Continuous monitoring has proven vital for guaranteeing sustained performance and security in GenAI applications.
This blog post will delve into the fundamentals of traces and spans, explore advanced monitoring methods, review leading tools, explore Coralogix’s AI Center for AI observability, and discuss the key challenges shaping the future of AI observability.
TL;DR
- Trace and span monitoring provides end-to-end visibility in GenAI workflows, which is critical for catching bottlenecks and accelerating troubleshooting.
- Modern AI systems require advanced monitoring techniques like real-time alerts and distributed tracing to maintain reliable performance.
- Organizations face challenges in AI observability, including trace data scalability, security vulnerabilities, and distributed system complexity.
- Future AI monitoring trends include improved storage efficiency, enhanced security guardrails, and expanded multimodal observability capabilities.
- Coralogix’s AI Center offers purpose-built LLM monitoring with span-level tracing, real-time observability, and AI-specific risk detection.
Understanding Traces and Spans
A trace is the end-to-end record of a request as it moves through an AI system, while a span represents a single operational step within that trace.
In a GenAI pipeline, each call—such as a database lookup or an LLM inference—becomes its own span. Collectively, these spans form a trace that shows exactly how a user request travels across different services.
Tracking these steps matters greatly in GenAI contexts. Modern applications often rely on multiple interconnected stages (e.g., embedding generation, context retrieval, LLM reasoning), and a single query can invoke dozens of microservices.
Spans capture timing and metadata for each step, clarifying which components might slow down or produce errors. Without this visibility, debugging becomes guesswork, particularly when issues arise in intermediate stages or external APIs.
Why trace context is key:
- It correlates all spans with a shared identifier so that data from each step links back to the same request.
- It ensures consistency across distributed services, even if calls occur in parallel.
- It helps teams reconstruct the request flow for deeper analysis, comparing real-time performance across services.
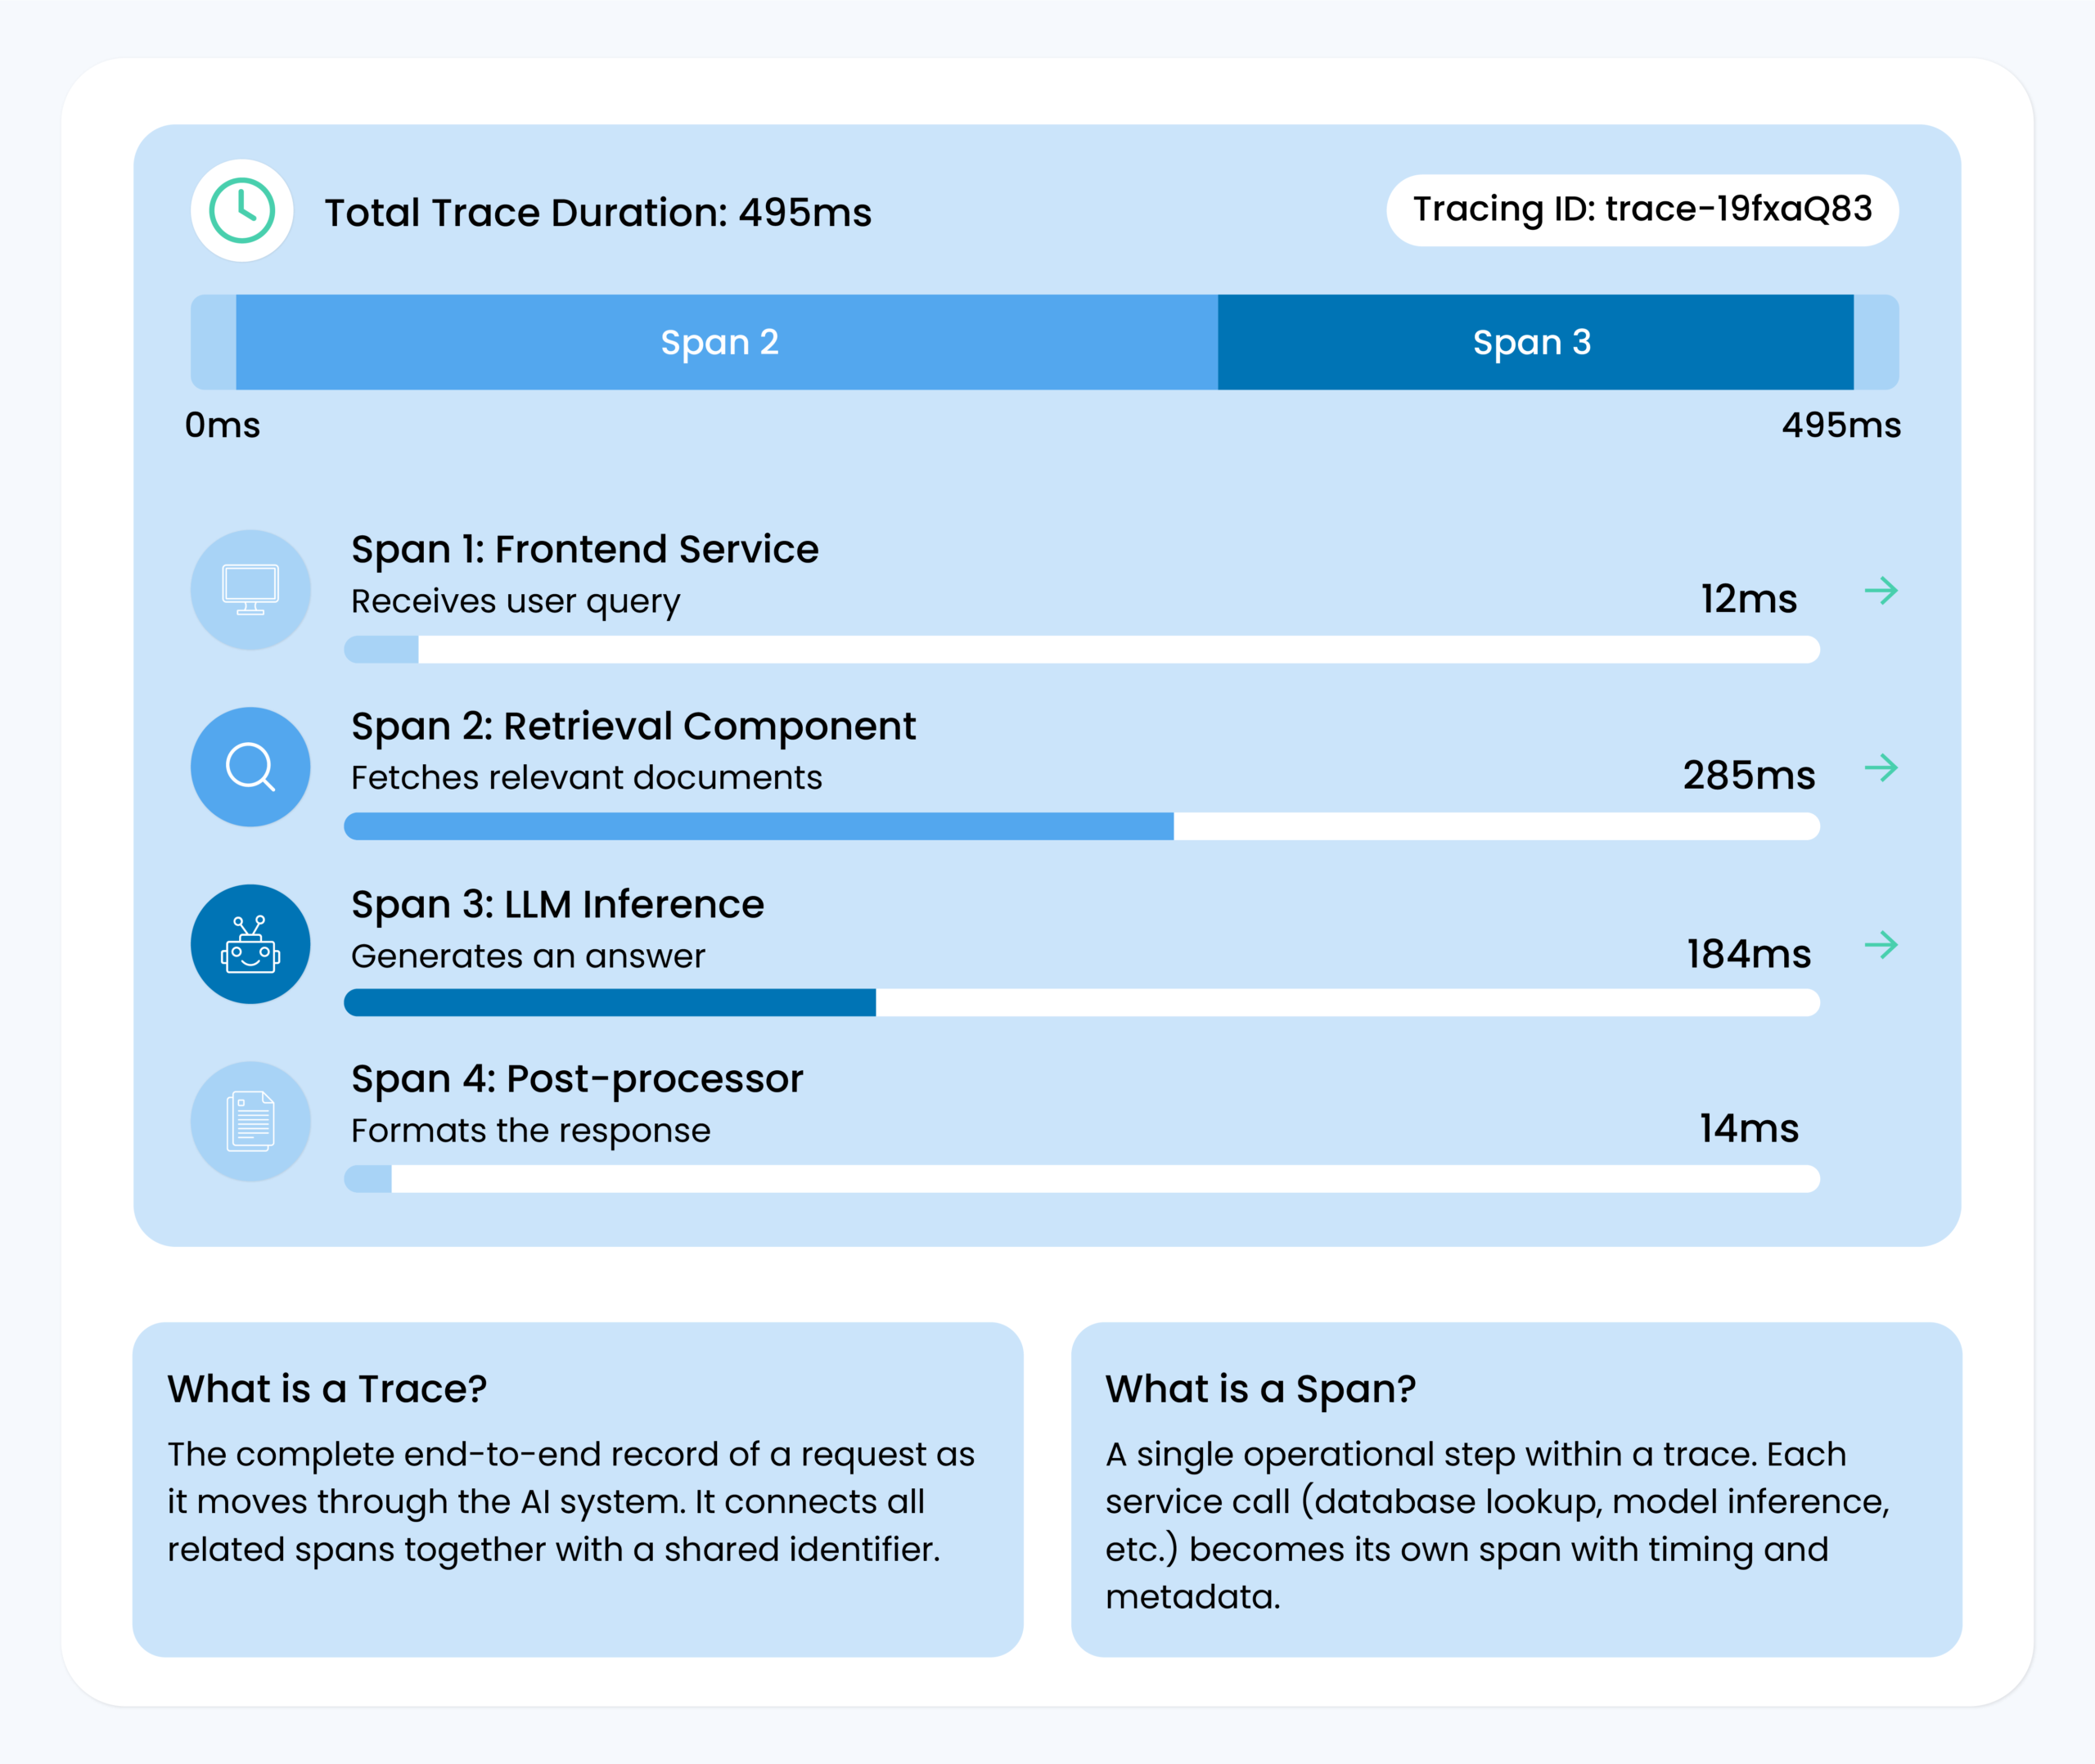
Consider a user query for an AI-driven helpdesk chatbot:
- A front-end service receives the query (first span).
- A retrieval component fetches relevant documents (second span).
- The LLM generates an answer (third span).
- A post-processor formats the response (fourth span).
Trace context ties these four spans together under one trace, enabling engineers to see the entire sequence and quickly identify if any step—like the retrieval—took abnormally long.
To put it simply, traces and spans form the backbone of GenAI observability, offering a holistic view of AI workflows and greatly simplifying troubleshooting and optimization.
Advanced Monitoring Techniques
Real-Time Monitoring
Real-time monitoring is crucial in GenAI workflows, where user requests often stream through multiple stages in seconds. By ingesting trace data as it’s generated, teams obtain immediate insights into system behavior.
If an LLM-based service suddenly slows down or errors spike, alerts will immediately trigger, minimizing user impact.
- Immediate Alerts: Real-time observability tools let engineers set thresholds (e.g., for latency or error rate) and send notifications when metrics exceed these bounds.
- Live Dashboards: Streaming data gets visualized on dynamic dashboards. This approach helps teams track anomalies like sudden response-time surges or unexpected memory usage.
- Performance Stabilization: By detecting issues in-flight—such as an overloaded GPU node—teams can scale up resources or reroute traffic before major failures occur.
In practice, real-time oversight means no waiting for batch updates or delayed logs; a single user complaint about slow responses can quickly be correlated with recent trace data. Engineers can dive into relevant spans to see which step might have caused a bottleneck.
Distributed Tracing
Distributed tracing is pivotal for GenAI systems built on microservices. A single user query may call an API gateway, a context retrieval service, and one or more LLM endpoints. Without distributed tracing, linking these interactions together is nearly impossible.
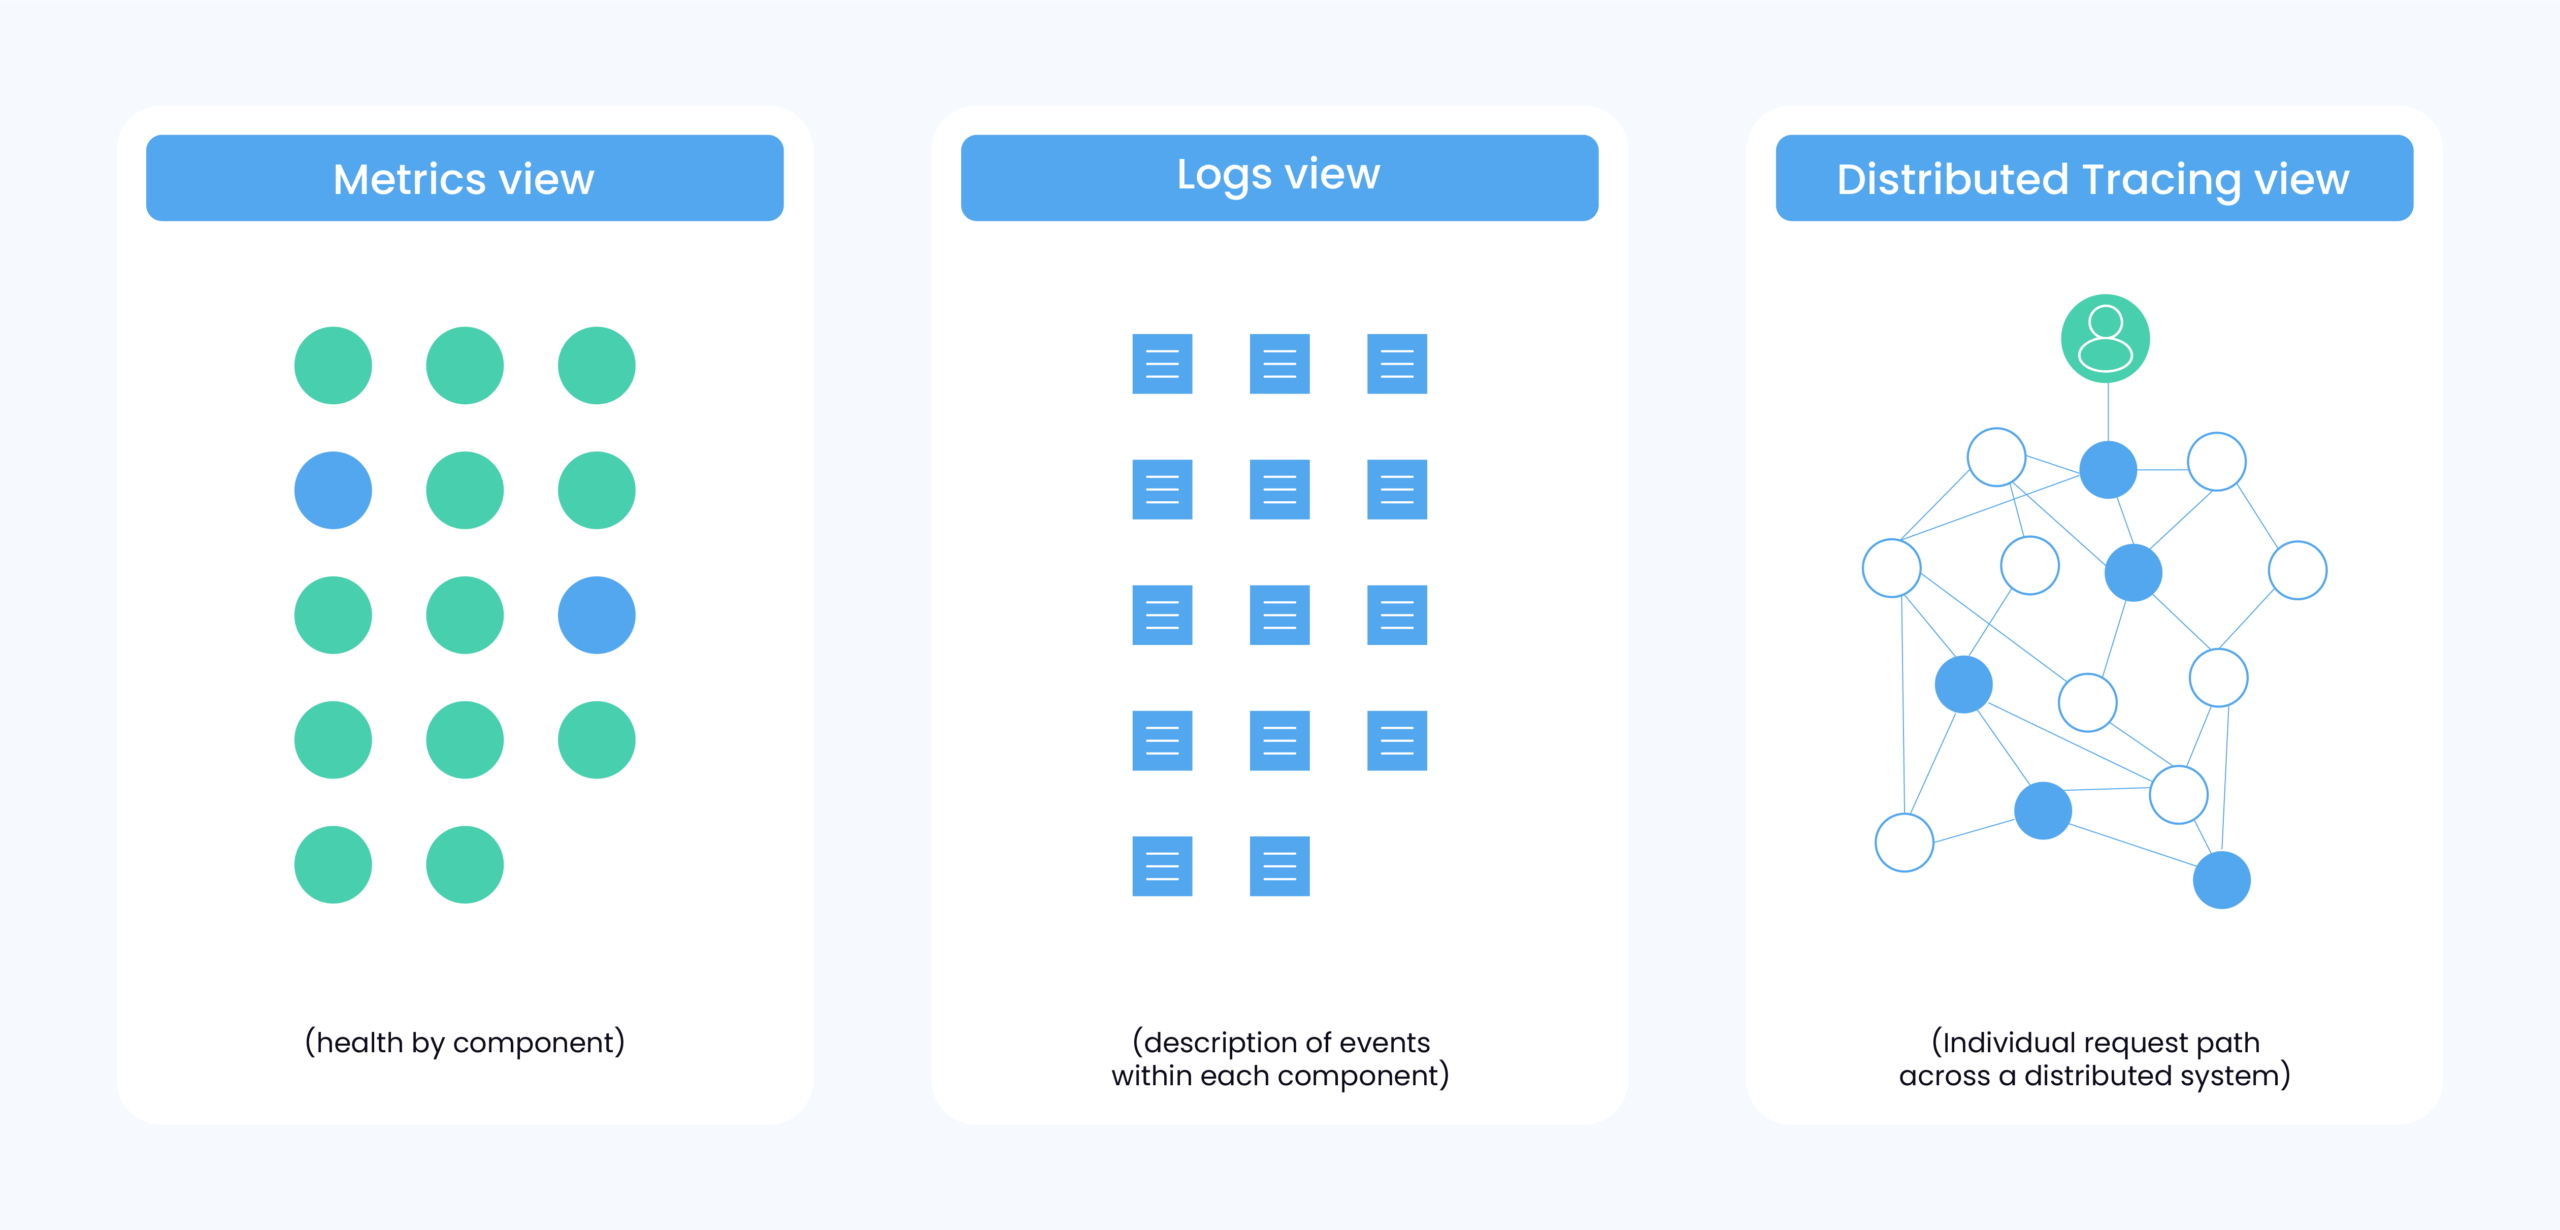
How it works:
- Each service logs data (a “span”) with a common trace identifier.
- Observability platforms stitch spans into a timeline that tracks the request from start to finish.
- Engineers spot which microservice contributed the most latency or returned errors.
This holistic view is invaluable when diagnosing multi-hop bottlenecks. For instance, a large language model might be fast, but the retrieval service feeding it data could be slow—causing the entire request to lag. Distributed tracing visualizes that chain of events, showing where the slowdown lies.
Span Representation and Analysis
Collecting trace data is one thing; interpreting it effectively is another. Span representation often takes the form of waterfall charts or flame graphs, where each bar indicates a span’s start, duration, and end.
- Visual Timelines: Let teams see which spans ran parallel versus sequentially, highlighting concurrency issues or waiting times.
- Tagging & Metadata: Spans can include tags (e.g., “prompt_type=completion,” “service=retrieval”) that make filtering easier. This helps isolate particular AI components, such as embedding generation, from the rest of the trace.
- Comparisons: By comparing traces from normal and slow requests, teams can pinpoint the deltas—like a single function that ballooned from 50ms to 500ms.
Advanced analysis may also involve flame graphs, which stack multiple requests to show aggregated data on where time is spent most. These views make even complex AI pipelines with multiple nested calls more transparent.
Root Cause Analysis
When something fails—be it a timeout in LLM inference or a data retrieval glitch—trace data can drastically reduce investigation times. Engineers begin with an error alert, open the relevant trace, and inspect the failing span.
- Drill-Down Approach: If the trace reveals that the “embedding_service” span failed, engineers immediately know to check logs and metrics for that service.
- Cross-Service Insights: If the embedding call was fine but triggered an exception in a downstream post-processor, the trace clarifies that the root cause lies elsewhere.
- Faster Mean Time to Resolution (MTTR): By ruling out healthy components, teams rapidly zero in on the actual culprit.
In GenAI, root cause analysis might uncover bugs in prompt formatting or show that an external API was down. Teams typically sift through logs from multiple services without traces, hoping to match timestamps. Tracing speeds up this process, often pinpointing the exact failure within minutes.
Challenges in AI Observability
As GenAI observability evolves, AI/ML engineers and DevOps teams face several challenges in monitoring traces and spans:
Scalability of Trace Data
- AI applications generate high-frequency trace events, leading to data overload.
- Capturing every LLM interaction can overwhelm traditional monitoring systems.
Security Risks & Model Integrity
- Prompt injection attacks can manipulate LLM outputs, causing security breaches.
- Sensitive data leaks through hallucinations or misconfigured APIs, especially in AI agents, remain a concern.
Complex Distributed Systems
- AI pipelines rely on multiple services (e.g., retrievers, vector databases, transformers).
- Bottlenecks across these microservices make root cause analysis difficult.
Coralogix’s AI Center for Monitoring AI Traces and Spans
Coralogix’s AI Observability platform is a dedicated solution that integrates AI monitoring into a unified observability system, allowing teams to track and optimize GenAI workflows in real-time.
Unlike traditional monitoring tools, Coralogix bridges the gap between AI performance, cost efficiency, and security, making it an indispensable tool for stakeholders working with LLM-based applications.
Key Features & Capabilities
1. Real-Time AI Observability
Coralogix enables seamless real-time tracking of AI system behavior without disrupting performance. Its observability capabilities include:
- Automatic request tracking: Every LLM interaction (inputs and outputs) is logged in real-time, ensuring immediate visibility into errors, token usage, and latency.
- Proactive alerts: Detects sudden spikes in API costs, long response times, or increased failure rates, notifying teams before they escalate into major incidents.
- Non-intrusive data collection: Unlike some observability platforms that introduce monitoring overhead, Coralogix passively collects trace data, preventing latency issues.
2. Span-Level Tracing & Bottleneck Identification
For AI workflows with complex multi-stage processes (e.g., retrieval-augmented generation, vector searches, or multi-model chaining/AI agents), Coralogix provides granular span-level tracing:
- Pinpoint performance issues: Quickly identify which stage—retrieval, inference, or post-processing—is causing slowdowns.
- Compare latency trends: Benchmark an app’s latency distribution against industry averages to detect regressions early.
3. Custom Evaluations & AI-Specific Risk Detection
Traditional observability tools lack AI-aware risk detection. Coralogix, however, includes built-in AI evaluators for:
- Prompt Injection Attacks: Identifying malicious user inputs intended to manipulate model behavior.
- Data and PII Leakage: Detecting any output that could inadvertently expose sensitive or personal information.
- SQL Injection Patterns: Recognizing anomalous database query behaviors that may indicate an injection attempt.
Regarding output quality, evaluators ensure that the content produced by LLMs meets high standards. These include:
- Hallucination Monitoring: Flagging incoherent, off-topic, or factually incorrect model outputs.
- Correctness Verification: Assessing the factual accuracy and logical consistency of responses.
- Competitive Discussion Screening: Ensuring that comparative or competitive analysis content is accurate and unbiased.
4. Unified Performance & AI-SPM
Coralogix AI Center provides a centralized monitoring hub where teams can track:
- LLM operational costs: Breaks down token usage, pricing trends, and model performance per request.
- Security vulnerabilities: Highlights data leakage risks and suspicious access patterns.
- End-to-end model behavior: Correlates LLM accuracy, latency, and failure rates with real-time infrastructure performance.
This single-pane-of-glass approach eliminates the need to cross-reference multiple tools, simplifying AI monitoring workflows.
How Coralogix Enhances LLM Performance
Many AI-driven applications experience performance degradation as usage scales. Coralogix addresses these challenges through:
- Anomaly detection & proactive issue resolution: Identifies unexpected behavior patterns before they lead to failures.
- Adaptive observability: Adjusts monitoring granularity dynamically to optimize system performance.
- Root cause analysis: When performance drops, span-level trace data pinpoints the precise failure point, reducing troubleshooting time from hours to minutes.
Why Coralogix’s AI Center Stands Out
Unlike generic observability platforms, Coralogix’s AI Center is purpose-built for GenAI workflows, combining end-to-end tracing, cost tracking, and risk assessments in a single system. This makes it an ideal solution for AI engineers and enterprise teams seeking to enhance LLM reliability, efficiency, and security.
Future Directions in AI Observability
As generative AI adoption scales, so do the challenges in monitoring AI traces effectively. Traditional observability methods struggle to handle the high volume of trace data, the security risks unique to LLMs, and the complexity of distributed AI systems.
Scalability & Storage Efficiency
Modern AI observability platforms are tackling the deluge of LLM telemetry with scalable pipelines and smarter storage. At the same time, purpose-built stores enable no-sampling ingestion, retaining all traces for real-time querying without compromising performance. These advances ensure that high-volume GenAI traces can be captured and queried efficiently at scale.
Security & Compliance Innovations
Security guardrails are now integral to observability for Generative AI. Platforms increasingly detect and flag prompt injection attempts, hallucinated outputs, and toxic content in real-time.
Enhanced LLM observability APIs also provide out-of-band hooks on prompts and responses, creating detailed audit trails for compliance. These innovations strengthen trust by catching unauthorized or unsafe LLM behavior and supporting rigorous AI governance.
Multimodal Observability
As AI systems become multimodal, observability is expanding beyond text. New techniques capture image, audio, and video interactions alongside text, stitching them into unified traces.
This holistic view allows monitoring complex GenAI workflows spanning vision, speech, and language. By correlating signals across modalities, teams gain complete visibility into AI behavior, ensuring reliability in rich, multimodal applications.
Conclusion
As generative AI adoption rises, robust trace monitoring has become essential for reliable and secure AI applications. Organizations can dramatically improve troubleshooting efficiency and system reliability by implementing advanced observability techniques such as distributed tracing, real-time monitoring, and comprehensive span analysis.
The challenges of scaling trace data, managing security risks, and monitoring complex distributed systems will shape the evolution of AI observability tools and practices in the coming years.
As the field matures, we expect more sophisticated solutions that balance performance optimization with security guardrails and compliance requirements. Ultimately, organizations implementing thorough trace monitoring will improve their AI systems’ reliability and gain competitive advantages through faster innovation cycles and enhanced user experiences.
FAQ
What are traces and spans in AI monitoring?
Why is trace monitoring important for GenAI applications?
How does Coralogix’s AI Center enhance LLM monitoring?
What are the main challenges in AI observability?
How does distributed tracing improve AI system performance?
References
- Observability for LLMs, Coralogix Blog, June 18, 2024
- The Definitive LLM Observability Checklist, Arize AI, 2024
- What Is LLM Observability & How Does it Work? Datadog Knowledge Center, 2024
- Distributed Tracing: Concepts, Pros/Cons & Best Practices, Coralogix Guides, 2024
- OpenTelemetry Tips – Distributed Tracing, Cisco Live, 2024
- Best practices for monitoring LLM prompt injection attacks, Datadog Blog, Nov 14, 2024
- AI Observability: Key Components, Challenges & Best Practices, Coralogix Guides, 2024
- New Relic AI Monitoring: The industry’s first APM for AI, New Relic Blog, the industry’s first APM for AI, New Relic Blog, 2024
- Uptrace – Distributed Tracing Tools, Uptrace Blog, 2024
- Auditing Large Language Models: A Three-Layered Approach


